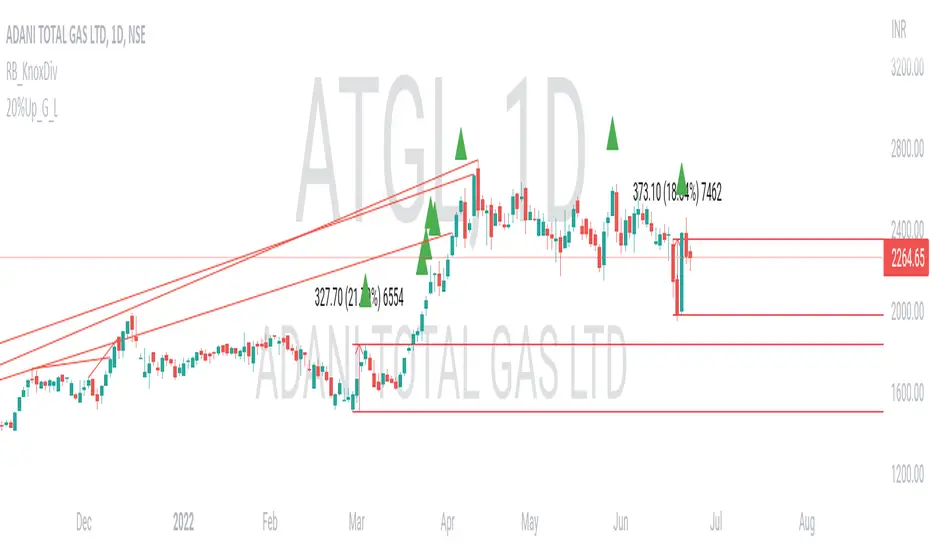
Consecutive Green Candles + 20% Move ScreenerConsecutive Green Candles Momentum Tracker
This indicator identifies powerful bullish momentum streaks in stocks, highlighting opportunities where consistent buying pressure has driven significant price increases.
The script tracks sequences of consecutive green (bullish) candles that collectively move a stock's price by more than 20%. It marks both the beginning of such streaks with a green label and their conclusion with a red arrow when price momentum finally reverses.
Perfect for traders looking to:
- Identify stocks experiencing strong directional momentum
- Spot potential reversal points after extended rallies
- Screen for securities with recent bullish strength
- Understand the magnitude of recent price runs
Simply adjust the minimum number of candles and percentage threshold to match your preferred momentum criteria.
Green

Dynamic 200 EMA with Trend-Based ColoringDescription:
This script plots the 200-period Exponential Moving Average (EMA) and dynamically changes its color based on the trend direction. The script helps traders quickly identify whether the price is above or below the 200 EMA, which is widely used as a long-term trend indicator.
How It Works:
The script calculates the 200 EMA based on the closing price.
If the price is above the EMA, it suggests a bullish trend, and the EMA line turns green.
If the price is below the EMA, it suggests a bearish trend, and the EMA line turns red.
An optional background color is added to enhance visual clarity, highlighting the current trend direction.
Use Cases:
Trend Confirmation: Helps traders determine if the overall trend is bullish or bearish.
Support and Resistance: The 200 EMA is often used as dynamic support/resistance.
Entry & Exit Signals: Traders can use crossovers with the 200 EMA as potential trade signals.
This script is designed for traders looking for a simple yet effective way to incorporate trend visualization into their charts. It is fully open-source and can be customized to fit individual trading strategies.

Green to Red Gradient for Dynamic / Color Changing IndicatorsI have evenly divided every color between green and red.
This gradient is useful for pine coders who are creating color changing, dynamic, or gradient indicators.

20% up with all continuously green candle: Lovevanshi It can be used to get the indication for 20% up movement among all continuously green candles formed in past. It is suitable for Indian company stock for short term trading plans.
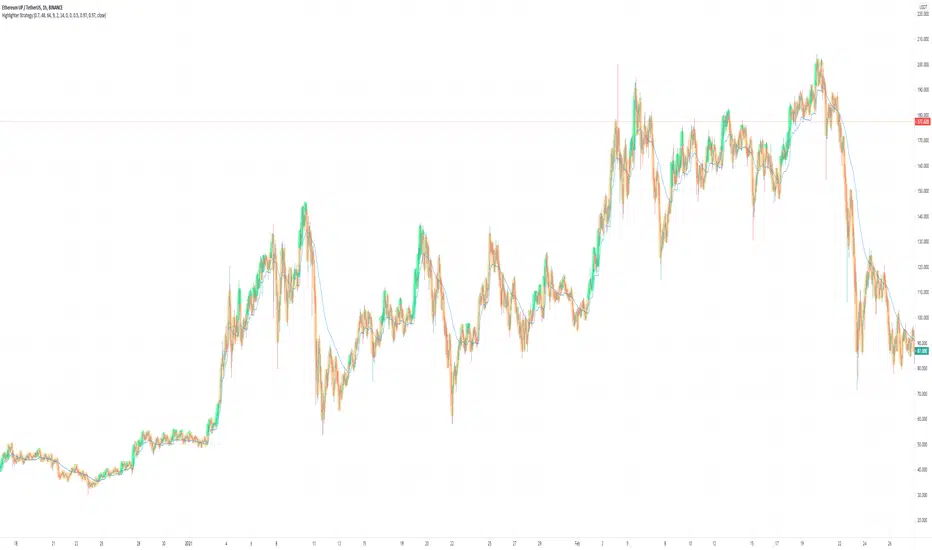
Highlighter Strategy V2// Based on Normalized Smoothed MACD by Dreadblitz
Old one was just an oscillator, I changed a few things
1) It now paints the line green/orange
2) The trigger (green/red) is now based on a signal
3) The signal is basically isUp, but with some additional controls, e.g.
4) (new) There is an embedded stoploss. This is a growth/decay function that decays slower than it grows.
5) Signal is filtered additionally by the stoploss (no green under the decaying line)
Improved On balance volume with BB channel and double MAThis is an improved version of the on balance volume indicator.
I made it inside a bollinger band channel, so we can define better the zones. At the same time I applied 2 moving averages on OBV, to get a better idea of the trend and at same time that change direction of the trend.
Green - > uptrend - > we look for buy positions
Red - > downtrend -> we look for sell positions.
At the same time we have to be aware of crosses on bollinger bands, which can indicate a change in the trend .

Candles - Cheat SheetWhat is up y'all ? (french trying to sound American)
I found that in my script archives, way back in an old cave. I think this might be useful as a few really asked me how to define a green/red candle, how to capture the wick value, the body, etc..
This is not a fancy script as usual and I'm sure they're plenty of candles pattern scripts out there but I saw no one sharing a simple candle cheat sheet for pinescript coding
Being able to define candles using codes is an essential skill to have for any Pinescripter
Still on the train so won't write a roman as usual... Kidding... I actually did it here What-is-an-Hard-Exit-and-a-few-notes-on-trading-management/
It won't bring me as many likes as any magic p**p cannon accounts promising the moon at each trade but if I can help at least 1 trader a day not losing his/her money, I'll be happy and my daily goal will be fulfilled
All the best
Dave
____________________________________________________________
Be sure to hit the thumbs up
- I'm an officially approved PineEditor/LUA/MT4 approved mentor on codementor. You can request a coaching with me if you want and I'll teach you how to build kick-ass indicators and strategies
Jump on a 1 to 1 coaching with me
- You can also hire for a custom dev of your indicator/strategy/bot/chrome extension/python
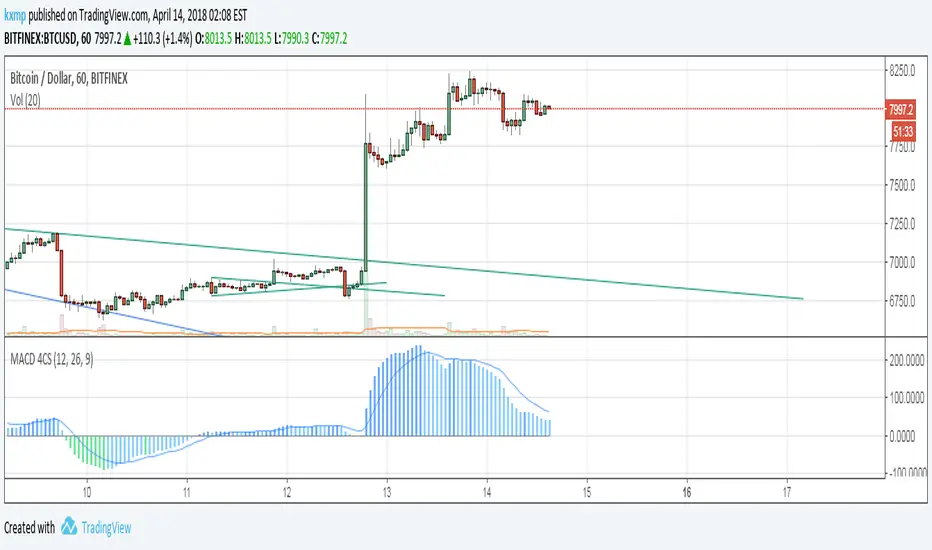
BNG MACD / Blue and Green MACDJust publish it again so it's easier to search this indicator.
Just inspired from macd 4c.
I changed it to blue and green color so it's looks better.
Blue and Green MACDJust a modified version of MACD4C
You can modify linewidth = 3 to 4 to make it thicker!!
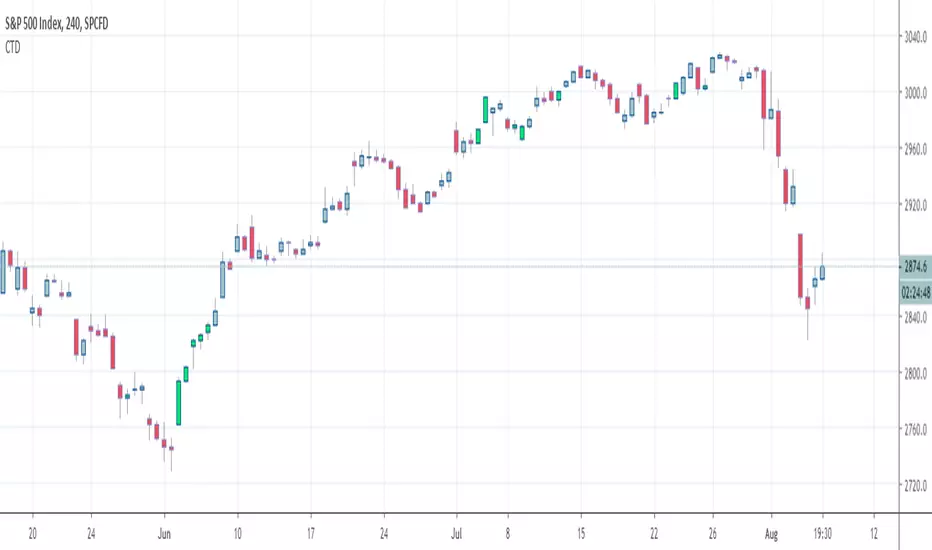
Supertrend Grid 1.0See the current pair's Supertrend direction on 4 different timeframes at once, so you won't get caught with your pants down trading against the trend. Handy for quickly space-barring through a watchlist.
Default settings are (from top to bottom) Daily, 4H, 1H and 15M but these can be changed. Any suggestions, let me know.

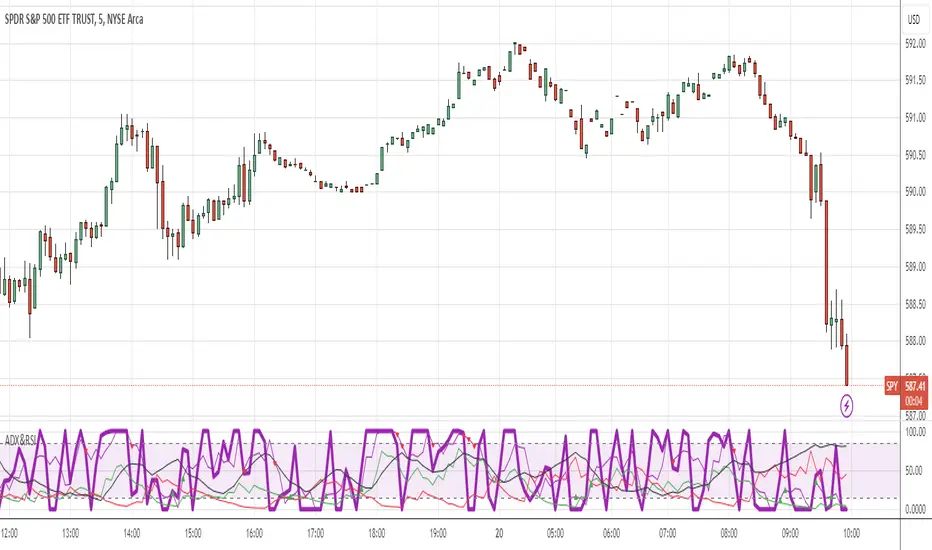
ADX and RSI ComboThis indicator combines two separate Simple RSI indicators so you can show different periods together, as well as an ADX indicator with DI+ and DI-. I prefer to use one indicator to show the whole thing, instead of stacking the individual indicators.
Simple Relative Strength IndexThis is a modified version of the base RSI indicator, which uses the Wilder's calculation with exponential MAs. This version uses simple MAs. Simple RSI is one of the indicators required for the Green Goose trading strategy, which you can learn about from OptionsPlayers.com .

Directional Movement Index 4 colors (DMI 4c)It is a normal Directional Movement Index, but instead of using lines for +DI and -DI it uses histogram and 4 colors. It also contains an horizontal line (default value @20) to indicate when a trend is confirmed or not.

RSI DivergenceRSI DIVERGENCE is a difference between a fast and a slow RSI. Default values are 5 for the fast one and 14 for the slow one.
You can use this indicator in 2 different ways:
normal RSI : check double or triple top/bottom on a chart meanwhile RSI is descending/ascending (check the example on chart)
signal line : when RSI Divergence cross zero line from bottom to top you get a buy signal (the line become green), vice versa when the RSI Divergence cross zero line in the opposite way you get a sell signal (the line become red)


Golden Cross KAMAThe usage is very easy. When the line is green you can open long position, when the line is red you can open short position and when it's black just check by yourself.
Usually I use it with RSI and Bollinger Bands , in order to determine when the signal is strong or weak.
Just play with fastest and slowest SC to adjust the smoothness.
