Grid Settings & MMThis script is designed to help you plan your grid trading or when averaging your position in the spot market.
The script has a small error (due to the simplification of the code), it does not take into account the size of the commission.
You can set any values on all parameters on any timeframe, except for the number of orders in the grid (from 2 to 5).
The usage algorithm is quite simple:
1. Connect the script
2. Install a Fibo grid on the chart - optional (settings at the bottom of the description)
3.On the selected pair, determine the HighPrice & LowPrice levels and insert their values
4.Evaluate grid data (levels, estimated profit ’%’, possible profit ‘$’...)
And it's all)
Block of variables for calculating grid and MM parameters
Variables used regularly
--- HighPrice and LowPrice - constant update when changing pairs
--- Deposit - deposit amount - periodically set the actual amount
Variables that do not require permanent changes
--- Grids - set the planned number of grids, default 5
--- Steps - the planned number of orders in the grid, by default 5
--- C_Order - coefficient of increasing the size of orders in the base coin, by default 1.2
--- C_Price - trading levels offset coefficient, default 1.1
--- FirstLevel - location of the first buy level, default 0.5
--- Back_HL - number of candles back, default 150
*** For C_Order and C_Price variables, the value 1 means the same order size and the same distance between buy levels.
The fibo grid is used for visualization, you can do without it, ! it is not tied to the script code !
You can calculate the levels of the Fibo grid using the formula:
(level price - minimum price) / (maximum price - minimum price)
For default values, grid levels are as follows:
1 ... 0.5
2...0.359
3 ... 0.211
4...0.0564
5...-0.1043
Short description:
in the upper right corner
--- indicator of the price movement for the last 150 candles, in % !!! there is no task here to "catch" the peak values - only a relative estimate.
in the upper left corner
--- total amount of the deposit
--- the planned number of grids
--- “cost” of one grid
--- the size of the estimated profit depending on the specified HighPrice & LowPrice
in the lower left corner
--- Buy - price levels for buy orders
--- Amount - the number of purchased coins in the corresponding order
--- Sell - levels of profit taking by the sum of market orders in the grid
--- $$$ - the sum of all orders in the grid, taking into account the last active order
--- TP - profit amount by the amount of orders in the grid
GRID

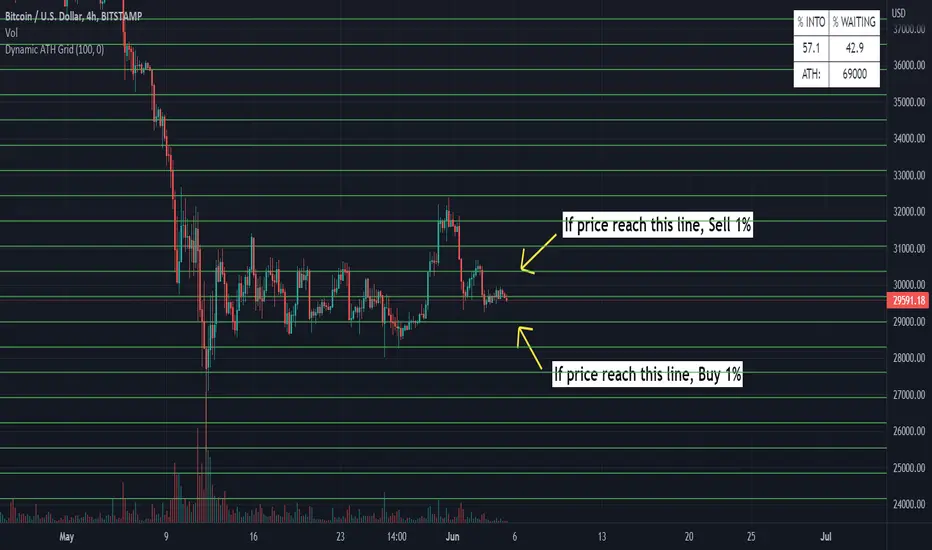
Dynamic ATH Grid
Indicator to profit all market movements.
The idea behind this indicator is:
- to sell 1% if price reach upside line
- to buy 1% if price reach downside line
This going to take profit from volatility of market.
Use only in the most reliable values, it have risk in less reliable values
- In cases of big crashes / going to 0, it will make loose your capital (exactly as if you have hold )
More indicators will be added.
Thanks for all
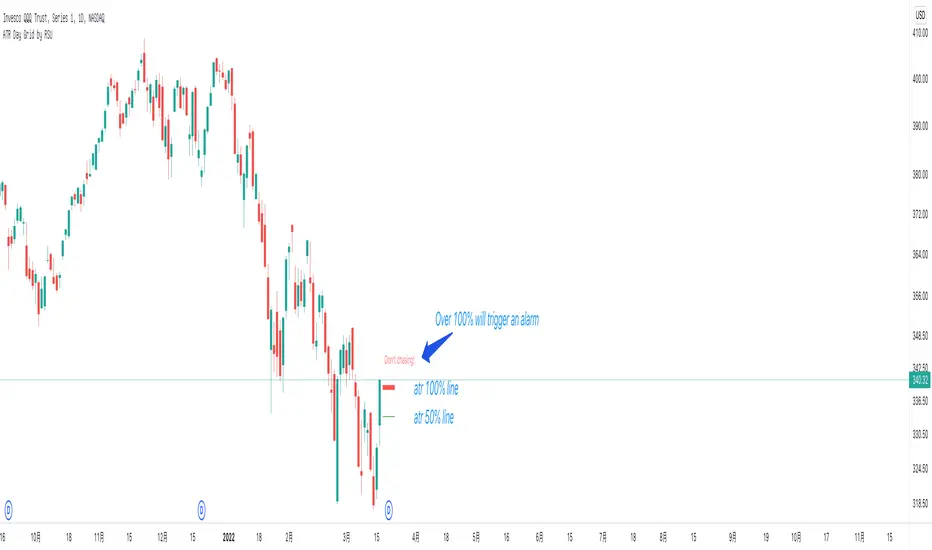
ATR Day Grid by RSUATR at the daily and intraday prompt lines, it is recommended to trade within 50%, and if it exceeds 50%, there is a risk of chasing high.
At the minute level,Day-level ATR grid line is displayed.
Fibonacci Grid [LuxAlgo]The following indicator returns multiple diagonal lines forming a grid. Each line has 45-degree and is set depending on Fibonacci ratios as well as the maximum and minimum price value over a certain lookback period. These can be used as potential support and resistance.
Users also have the option to set equidistant lines instead of having them determined by Fibonacci ratios.
Settings
Length: Lookback period for determining the maximum/minimum price value used for constructing the grid.
Resolution: Grid resolution, higher values will return more lines (only available when the "Use Fibonacci Ratios" is disabled)
Use Fibonacci Ratios: Set the lines based on Fibonacci Ratios, 6 ratios are used.
Usage
Each individual diagonal line can be used as support/resistance. Two Diagonal lines form channels where the price might evolve until a breakout.
The underlying logic of this grid determined by Fibonacci ratios is that price variations farther away from the main diagonals (in orange) would tend to move inside tighter channels.
Diagonals set using Fibonacci Ratios will form tighter channels when away from the center of the Lookback area. While equidistant lines will keep the same distance between each line.

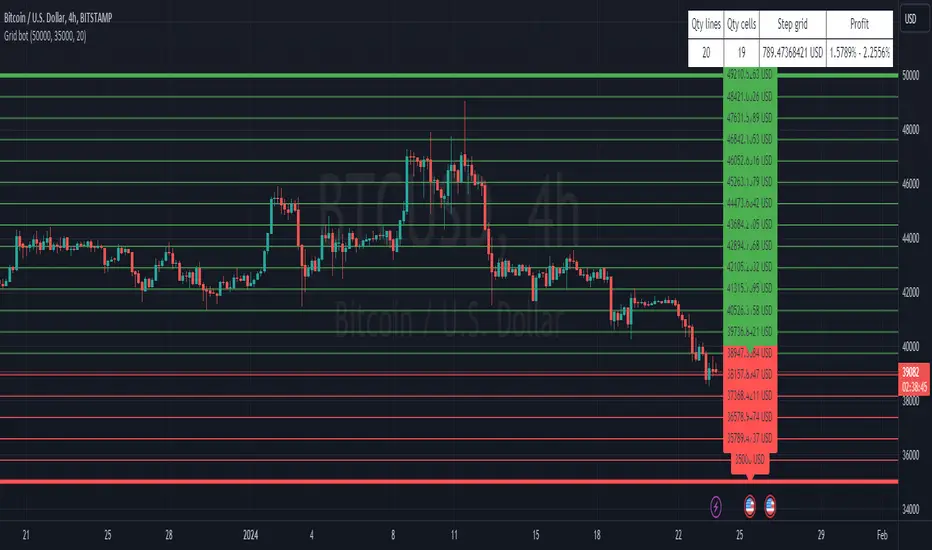
3commas GRID bot VisualisationHello everyone
This is a grid display indicator for a 3-comma grid bot.
Just enter the upper and lower borders of your grid and the number of grid cells in the indicator settings.
It's simple!
Percentage Range IndicatorThe Percentage Range Indicator is useful for assessing the volatility of pairs for percentage-based grid bots. The higher the percentage range for a given time period, the more trades a grid bot is likely to generate in that period. Conversely, a grid bot can be optimised by using grids that are less than the Percentage Range Indicator value.
I have been using the Percentage Range Indicator based on the one hour time period and 168 periods of smoothing (seven days based on one-hour periods).
Enjoy.

Fear Of Missing Out grid of forex tradingAbstract
This script finds potential safe grids placing limit orders without fear of missing out.
This script computes grids according to power of 1.0025 .
You can reference those price levels for your trading.
Introduction
Grid trading is a popular trading method.
Traders plan several price levels as grids and repeat buying at lower grids and selling at higher grids.
Grids can be round number like multiple of 100 pips.
Grids can also be support and resistance according to price history.
Some traders may think they need to adjust grids to trade.
However, there are several problems in choosing grids.
One problem is rate of change is related and therefore exponential. 20 to 30 is different from 30 to 40.
Another interesting point is there are some special impressing reversal price levels.
Several months ago, I had a question why usdjpy bounced near 108.3 .
After using a calculator, I found that 108.3 = 100 * 1.083 ≒ 100 * pow(1.0025,31) .
1.0025 , as known as 0.25% of change, is a potential stop out zone.
Therefore, we can compute grids and one grid is a little more than 1.0025 times than an another one.
After we finished computing grids, we can consider buy and sell near those grids.
Note that different traders may obtain different grid values.
For example, from 1.0 to 2.0 , it can be splited as 270 grids or 277 grids because pow(1.0025,277)<2 .
Those grids cannot always imply potential reversal points but they can be useful for traders looking for 0.25% profit targets with reducing fearing of buying or selling too early.
Computing grids
This script split from 1.0 to 10.0 into three segments.
One is 1.0 to 2.0 .
The second segment is from 2.0 to 5.0 .
The third segment is from 5.0 to 10.0 .
This script does the same thing for 0.1 to 1.0 , 10.0 to 100.0 , and so on.
For 1.0 to 2.0 and 5.0 to 10.0 , this script split a segment as 270 grids.
For 2.0 to 5.0 , this script split a segment as 360 grids.
The last step is display the next grids to the daily low and daily high.
Maybe also display the grids behind grids shown.
Parameters
x1,x2,x3,x4 : display the next x1,x2,x3,x4 grids to daily high and daily low. 1 means the next grid to daily high and daily low. 2 means the next grid to 1.
x_seg : default 2.0 . This script split from 1.0 to 10.0 into three segments. One is 1.0 to x_seg. The second segment is from x_seg to 10.0/x_seg . The third segment is from 10.0/x_seg to 10.0 .
x_grid1 : how many grids in the first segment
x_grid2 : how many grids in the second segment
x_lowprice : add this number for bigger grid distance. Generally, you don't need this number when trading forex but you may need it in stock trading. For stocks with price between 50 to 100, I recommend you use x_lowprice=100.
Conclusion and suggestions
This script can find potential grids for trading.
If price touches grids usually, we can consider buy and sell after price touches grids.
If price reverses before touching grids usually, we may consider buy and sell before price touches grids.
Those grids can remind us don't buy too much unless the price touches the next grid.
For instruments with less volatility, maybe we need more grids.
For traders with more money, they may also consider more grids for more dedicated range trading to collect more profit.
Reference
Sorry, I forgot them.

Volatility Adjusted Grid [Gann]█ OVERVIEW
Gann Square of 9 is one of the many brilliant concepts from W.D.Gann himself where it revolves around the idea that price is moving in a certain geometrical pattern. Numbers on the Square of 9 spiral tables, especially those lie in every 45degree in the chart act as key vibration levels where prices have tendency to react to (more on the table below).
There are few square of 9 related scripts here in Tradingview and while there's nothing wrong with them, it doesn't address 1 particular issue that i have: The numbers can be too rigid even when scaled based on current price because the levels are fixed, which makes them not tradable on certain timeframes depending on where the price currently sitting.
Heres 5min and 1hour Bitcoin chart to illustrate what i mean: Grey line on the left is based on Volatility Adjusted levels, while red/blue on the right are the standard Gann levels.
You can see that on 1hour chart, it provides a good levels (both Volatility Adjusted and the standard one happened to share the same multiplier in this case),
1Hour Chart:
On 5 min chart tells a different story as the range between blue/red levels can be deemed as to big for a short term trade, while the grey line is adjusted to suit that particular timeframe (You can still adjust to make it bigger/smaller from the settings, more on this below)
5Min Chart:
█ Little bit on Gann Square of 9 table
This is the square of nine table, the numbers highlighted in Red are known as Cardinal Cross and considered to be a major Support/Resistance while those in Blue color are known as Ordinal Cross considered as minor (but still important) Support/Resistance levels
Similarly, this script use these numbers (and certain multipliers) to print out the levels, with Cardinal numbers represented by solid lines and Ordinal numbers by dotted lines.
█ How it Works and Limitations
The Volatility Adjusted grid will go through several iterations of different multipliers to find the Gann number range that is at least bigger than times ATR. Because it's using ATR to determine the range, occasionally you'll notice that the line become smaller as ATR contracting (and vice versa). To overcome this, you can change the size range multiplier from the settings to retrieve the previous range size.
Use the size guide at the bottom left to find the multiplier that suits your need:
1st Row -> Previous Range -- Change Range Size to number lower than this to get a smaller range
2nd Row -> Next Range -- Change Range Size to number higher than this to get a larger range
Example:
Before:
After:
As you'll soon realise, the key here is to find the range that fits the historical structure and suits your own strategy. Enjoy :)
█ Disclaimer
Past performance is not an indicator of future results.
My opinions and research are my own and do not constitute financial advice in any way whatsoever.
Nothing published by me constitutes an investment recommendation, nor should any data or Content published by me be relied upon for any investment/trading activities.
I strongly recommends that you perform your own independent research and/or speak with a qualified investment professional before making any financial decisions.
Any ideas to further improve this indicator are welcome :)

Gridimus MaximusGridimus Maximus draws N grid lines stepping by price or percent in chosen direction from set price, or draws N grid lines stepping by pivots.
The queue function method used is adapted from an example provided on the PineCoders website, much gratitude to LucF for this gem!
To prevent grid lines out of range from causing chart to rescale right click on chart's price column and enable Scale Price Chart Only.
Pictured example above is using Type Of Increment: Steps By Pivot, Number Of Steps: 5.
Pictured example below is using Type Of Increment: Steps By Price, Number Of Steps: 6, Starts From Price: $10k, Steps By Percent Or Price: $10k.
Pictured example below is using Type Of Increment: Steps By Percent, Number Of Steps: 7, Starts From Price: $10k, Steps By Percent Or Price: 33%.
NOTICE: This is an example script and not meant to be used as an actual strategy. By using this script or any portion thereof, you acknowledge that you have read and understood that this is for research purposes only and I am not responsible for any financial losses you may incur by using this script!
MA+ ROC MTF DashboardThis is a Multi Timeframe moving average ROC (percent of change) dashboard.
This dashboard shows percent of change of current price to a moving averages on different time frames.
Most left value in the dashboard always represents your chart time frame, while the next 3 represent other time frames which you can set in 'MA+ ROC' settings.
Support User Defined time frames or automatic time frames based on a multiplier value.
Better define same or higher time frames than your chart time frame to get accurate results.
Can work in conjunction with MA+ to display the moving average line, click here:
Like if you Like and follow-up for up coming new indicators: www.tradingview.com

Grid bot development I have completed the next stage of my grid bot which is to isolate the instances in which the market will move sideways in a narrow range.

Rudimentary Grid bot ideaUsing Eulerian principles yet again, this is the beginning of my first grid bot script. Use as static S&R when trading manually. Good for SL and TP setting too.

Grid SystemThis script plots a a square composed of 8 equilateral triangles ("grid"). User can set the frequency of calculation/interval by adjusting the 't' parameter.
Steps for calculating grid:
1. Find the highest high and lowest low for last 't' periods.
2. Calculate midpoint for prices during that interval (highest high + lowest low) / 2.
3. Center of the grid = {time , price midpoint}.
Interpretation:
Volatility : If price is volatile for a given period, the area of the grid will expand, since the top and bottom sides are based on the highest high and lowest low for the period. So as range for a given period increases, the grid's area increases.
Support and resistance : The grid's center line often acts as the support / resistance line.
Trend Following : The example chart shows Cognex (CGNX) price using an interval of t=365. When the stock's trend was bullish, the area of the grids became increasingly larger and the y-coordinate of each grid was greater than that of the previous grid.

Grid Bot RSIGrid Bot Simulator. Based on RSI levels.
How it works:
Prices are divided into grids, or trade zones, that are based on RSI levels. Buys will trigger when the RSI crosses into a higher zone, after descending. Sells will trigger when the RSI crosses into a lower zone, after ascending. After triggering, a new signal will not be produced until the RSI progresses into better zone.
Standard Settings :
RSI Length
Number of Grids
RSI Type : Standard RSI or Jurik RSX (based on Everget’s formula)
Show All Grids
Experimental Features (Adjust in settings menu) :
No Trade Zone : RSI Levels where no trades will be signaled. Adjust to prevent over-buying/selling in narrow markets. Default: 35-65:
No Trade Zone (40-60)
Aggression Level : Increase aggressiveness to stack buys/sells at extreme RSI levels:
Aggression = high
Aggression = low
Market Direction : If market is trending up, the bot will skip every other sell ( = more buys than sells). If down, will skip every other buy (more sells than buys). Default: neutral.
Market Direction: down
Market Direction: neutral

Grid Bot SimulatorThis script is a grid bot simulator for ranging/choppy markets. Prices are divided into grids, or trade zones, that will trigger signals each time a new zone is entered. During ranging markets, each transaction is followed by a “take profit.” As the market starts to trend, transactions are stacked (compare to DCA), until the market consolidates. No signals are triggered above the Upper Limit or Below the Lower Limit.
Settings overview:
Upper Limit/Lower Limit : Highest and Lowest values for entire grid.
Number of Grids : Number of trade zones.
Show Grids : Show or hide all gridlines.
Show Only Current Grids : Only display the grids just above and just below the current trade zone.
High/Low for signals : If enabled, signals are triggered as soon as the price touches the next zone. If disabled, signals are triggered after bar closes. Enable this for “Once Per Bar alerts. Disable for “Once Per Bar Close” alerts.
Highlight Trade Zones
The grid bot should work well during ranging/choppy markets. Each zone will have only one trade, and then will immediately take profit in the next zone.
Ranging/Choppy Market
However, trending markets can produce multiple signals in rapid succession:
Trending Market
If the gridlines are compressing the chart space, enable the “Show Only Current Grids” in settings.
Show Only Current Grids disabled
Show Only Current Grids enabled
When changing symbols, adjust the Upper and Lower Limits to accommodate the new symbol. Otherwise, the chart will look compressed.
XBTUSD chart with ETHUSDT settings
The bot is a proof-of-concept and is considered experimental . Possible future updates will include Fibonacci grids and “smart entry/exits,” depending on the current trend. Comments and suggestions are encouraged.

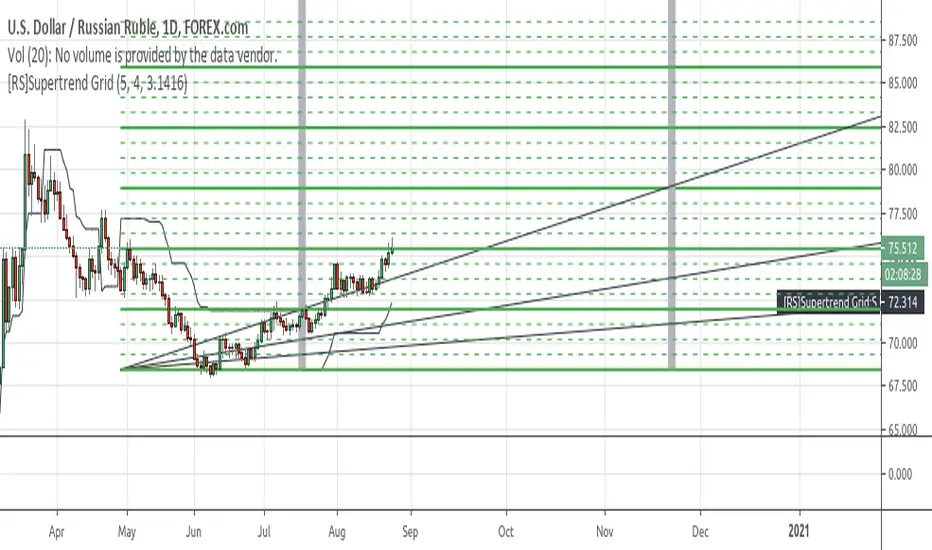
[RS]Supertrend GridDynamic grid system based on supertrend.
note: the input nlines/nfractions are not locked so if values too high might start overlapping line objects.
[HM] HORIZONTAL GRID ROUNDED (VOLATILITY BASED)The purpose of this indicator is to draw a horizontal grid having in mind:
- rounded price levels instead tradingview standard grid, zoom-based;
- calculated by volatility, using daily ATR;
- independent of timeframe in use, locked to DAILY calculations.
Further improvements are intended.
Wish this could be useful. Any questions, feel free to comment.
BoilerRoomColdCaller - 3Commas Grid Bot SignalThis is very similar to 3Commas' grid bot, the range is from the previous 7 days' lowest low decreased by 3% to the previous 7 days' highest high increased by 3%, you can also adjust if you want 7 days' highest/lowest close price as your range or highest high and lowest low as your range. 10 buys and 10 sells within the range, the unit price would be (high-low)/19.
The buy signals and the sell signals will be triggered if:
- The previous close is below one specific green line (buy line), and the current close is above that specific green line, or
- The previous close is above one specific green line (buy line), and the current close is below that specific green line
Thus, whether the price is dropping below these lines or rising above these lines, a buy or sell signal will be triggered when they cross green or red lines. Your entry price will be the next open price after this candle's close reaches the lines.
Big thanks to @glaz, who helped me a lot with this script. Please give a like button and share if you like this script. Let me know if you have questions, thanks guys.

Example - How to create multiple level gridsExample on how to create custom grids with variable N lines/labels:

ck - 3commas GRID bot VisualisationHi,
This is a very quick script indicator to show the “grid” for an active (or one you are planning to manually configure) 3commas Grid bot.
To use, you’ll need to go to your Grid bot page in 3commas and enter the Upper and Lower Limit Values, either from the “manual” section if you are planning a new Grid bot, or from an open Grid trade by clicking the monthly button and using the Upper value (in green) and the Lower value (in red).
Have fun!
Multi Bar OHLC Compare Panel (Floating Grid)Multi Bar OHLC Compare Panel by RagingRocketBull 2019
version 1.0
This indicator lets you compare OHLCV values from several specified bars. Bars can be dynamic/persistent.
You can also use it as an alternate OHLC panel if you don't like small font of the native TradingView panel.
It uses Pinescript v4 to output data dynamically as string labels in a horiz/vertical grid.
Features:
- Floating Panel with customizable horiz/vertical layout and grid spacing
- Support for up to 5 OHLC bars (highlighted with markers)
- Outputs Bar #/index, OHLCV, Bar Change Value/%, Exchange/Ticker, Timeframe, Timestamp strings
- Dynamic (fixed offset)/Persistent bars (fixed time)
- Show/Hide parts of strings
- Full output string customization, including text size, date/time format and delimiters
- 2 Anchor points for panel offset: cur bar high or range high
- Bar Change can change color
Usage:
- specify at least 1 bar index as OHLC source
- select anchor point to position the panel
- select horiz/vertical grid layout
- adjust horiz/vertical spacing
- customize output strings as needed
Notes:
- this indicator uses Pinescript v3 Compatibity Framework
- both bars 1,2 are required for log scale adjustment to work
- you can't attach the panel to screen's top/bottom and must use offset/anchor because, unlike plotshape, string labels don't support yloc=yloc.top/bottom, only yloc.above/belowbar
- you can't precisely align strings in a grid because there's no label.get_width/height to calculate mid/left points, only get_x/y/text. Alignment will break depending on string length, zoom and change color option on/off
- bar change is rendered as a separate label when change color is enabled (2 panels total) and merged into the main panel when disabled (single panel)
- you can't change the order of strings as playing with the natural order of things isn't the best of ideas
- you can modify the script to compare up to 50 OHLC bars, but do you need that much power? Of course, you do.
- you can't set color/style for string labels in Style UI, so a few extra settings were added.
- bar index is limited to 5000 for free accounts (10000 for paid), will show an error when exceeded, also when it exceeds the total number of bars in history
- in persistent bars mode all bars with index > 0 are considered persistent, bar 0 always remains a dynamic bar
- persistent bars' offset is reset: in replay mode on exit or when price reaches cur bar, or when panel layout is changed from h to v in both replay/realtime modes
- initial pos of each persistent bar relative to the first realtime bar anchor doesn't change during session - new persistent bars introduced during session are attached to the most recent cur bar anchor
P.S. Everything is proceeding as I have foreseen

MTF Polarity Grid [DW]This is an experimental study designed to track directional polarities across multiple timeframes and express them as a simple two color grid.
The polarity in this calculation is determined by divergence between a fast and slow McGinley Dynamic.
Your current resolution's polarity is the top row, the rows below are are for higher timeframes of your choice.

