Portfolio and Risk Management: Gold Based Net Growth CoefficientHello, if our topic is stocks, whatever signal we get, we have to divide and reduce the risk.
Apart from the risk, we need inflation-free figures to detect a clear growth.
Gold is one of the most successful tools to beat inflation in this regard in the historical context.
When the economy is good, we have to beat both commodities and inflation.
For this purpose, I found it appropriate to develop a net growth factor free from gold growth.
Investors need several stocks with a high growth rate and as much risk-free as possible.
Personally, I think that the science of portfolio and risk management will last a lifetime and should continue.
I think this subject is a research and development subject.(R & D)
My research and publications on this matter will continue publicly.
I wish everyone a good day.
NOTE : You can determine the return in the time period you want to look back by adjusting the period in the rate you want from the menu.
The standard value is 200 days. (1 year)
Crescita

Coronavirus Cases Doubling Indicator - Days to doubleHello guys! Batcash here!
Since the coronavirus has become a global pandemic, all eyes have been on the efforts to control the growth of the infections.
To help the common masses understand the statistics of exponential growth I have decided to make the Coronavirus growth indicator.
Basically the indicator will give an estimate of how many days are required for the current number of coronavirus cases to double.
So if the indicator lists the current number as 2.6, it means that the current number of coronavirus infections eg. 33272 as of writing in the US will double to 66544 in 2.6 days if the current growth rate persists.
Please use the following search title to search for Confirmed Coronavirus cases (CONFIRMED_)
eg.
CONFIRMED_US - USA
CONFIRMED_KR - South Korea
CONFIRMED_CN - China
CONFIRMED_DE - Germany
The higher the number of days in the indicator, the better!!
Please stay safe and stay informed!
Wish the world a speedy recovery!

Bitcoin Logarithmic Growth Curves & ZonesI found this awesome script from @quantadelic and edited it to be a bit more legible for regular use, including coloured zones and removing the intercept / slope values as variables, to leave space for the fib levels in the indicator display. I hope you all like it.

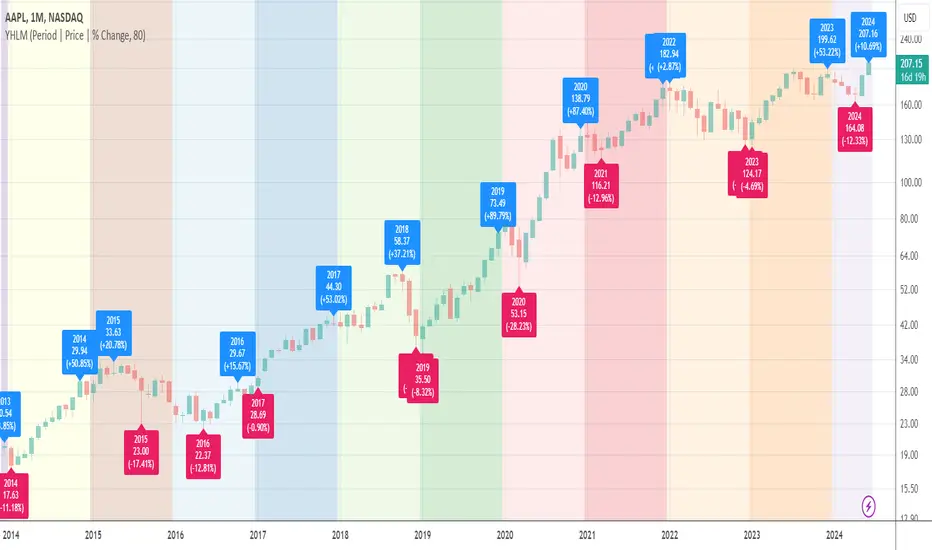
Year Open Price LevelAn utility tool that plots a dynamic level using the opening price of each year on the chart.
Allows to highlight the change in the price relative to this level.

Yearly High/Low MarksAn utility tool for analysts. It marks the highest and lowest prices for each year down to 1989.
Works everywhere and doesn't use any calls of built-in functions that relate to the data extraction.
AAPL, D
AAPL, M
BLX, D
BLX, W
BLX, M
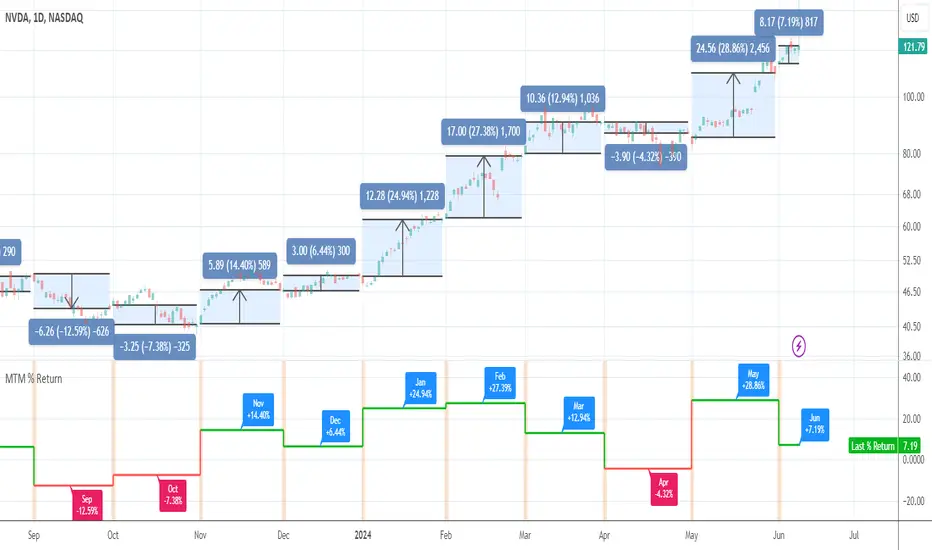
Month-to-Month % ReturnAn utility tool to see month-to-month performance of the asset and to eliminate the need in drawings. It works everywhere but better in use on the daily timeframe.
WhipsawThe Whipsaw indicator shows the overall slope of the market with a proprietary modified slope formula for determining directional bias.

Naked Put - Growth IndicatorDISCLAIMER: Do NOT follow this strategy unless you are aware of the risks of selling naked options.
1) I have identified 20 companies with 30%+ YoY revenue growth (using the most recent quarter) and minimum "average trading volume": ZEN, TEAM, BABA, SHOP, RNG, SPLK, NFLX, FB, WIX, SQ, MULE, WDAY, MU, HUBS, ABT, LOGM, NEWR, NVDA, MELI, AMZN, NOW. I like companies that fit this criteria because 30%+ revenue growth means their revenue double every ~2.5 year and their "market cap" is based on their revenue.
2) When you see a green "$" icon above a candle on a DAILY chart, that means it's a good time to "sell naked puts" using the solid green line as the approximate "strike price". I prefer 3-9 months until expiration and "stagger" my expirations so it's not possible for everything to be put to me all at once.
3) I use a "minimum premium" and "max contracts" that I sell that suits my risk tolerance, you will need to calculate your own contract size based on your risk tolerance.
*NOTE: This only works on a DAILY chart, and only works on the companies identified above -- if you are using intraday, weekly or monthly, the "$" signs do NOT appear.
RISK NOTE: I do NOT sell any naked puts unless I am 100% ready to own the shares AND have enough capital in my account if they are put to me, you should do the same. Don't follow this strategy unless you are prepared to OWN shares at expiration.

Function Linear Decay V2EXPERIMENTAL:
improved range detection (it now locks range when its last formed on the appropriate side improving readability as it doesnt auto adjust when opposite extreme moves)
