HG Scalpius H & SS ScanHG Scalpius H & SS Scan
This indicator highlights hammer candles and shooting star candles based on the below definitions:
Hammer = lower wick >= 2* real body and closes in top half of range
Shooting Star = upper wick >= 2*real body and closes in bottom half of range
hammer = (min(open,close)-low)>= (2*abs(open-close)) and close > (((high-low)/2)+low)
shootingStar = (high-max(open,close))>= (2*abs(open-close)) and close < (((high-low)/2)+low)
Hammer


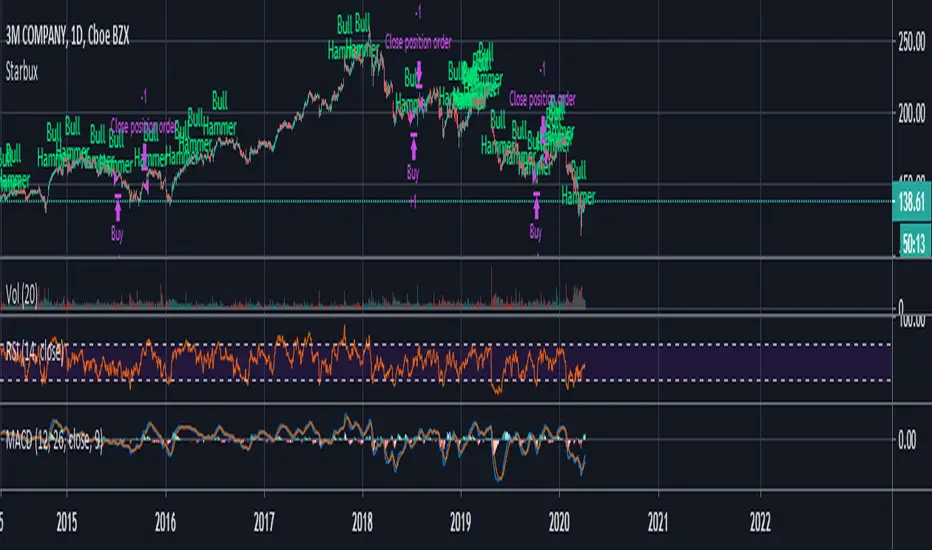
StarbuxI made this in starbucks .
Bullish hammer trading signal algorithm
using MACD for trend determination and holding period.
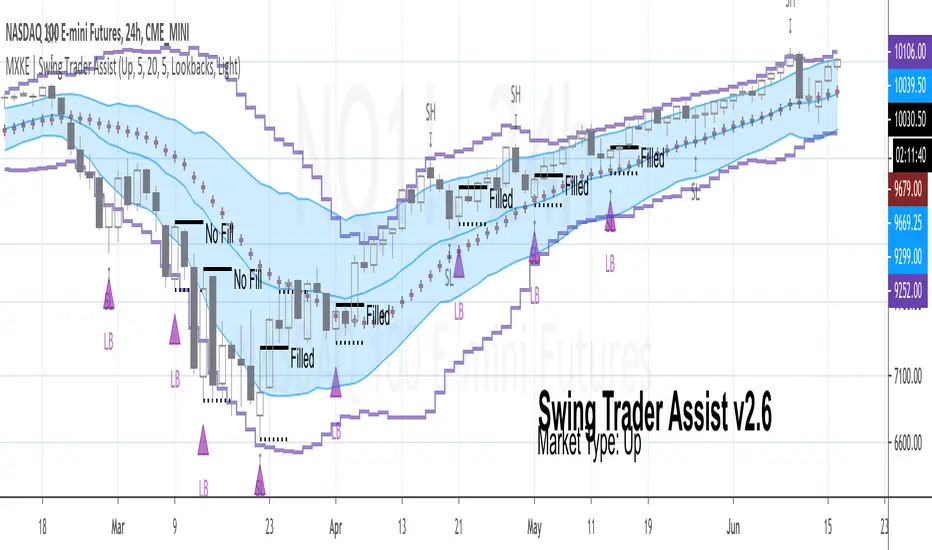
MXKE | Swing Trader AssistIntroduction
Swing Trader Assist indicator is designed to assist in the systematic identification of Hammers & Lookback signals within Uptrending markets, Stars & Lookback signals within Downtrending markets, and Mean Reversion signals within Sideways markets. The trader must first identify a strong market trend, then apply the indicator. Application of the indicator to weak trends will render equally weak signals. Application of the indicator to strong trends will render equally strong signals. Identification of strong trends is the responsibility of the individual trader and is instrumental to the successful deployment of this indicator and accompanying trading plan.
*Please comment below to request access*
*Please share with me on Twitter your usage and/or ideas for improvement so that I may improve this indicator in the future*
Market Types
Uptrend: Higher highs + Higher lows
Downtrend: Lower highs + Lower lows
Sideways: Higher highs + Lower lows (Expanding Range) or Lower highs + Higher lows (Narrowing Range)
Position Sizing
1R = .25%-2% of total nominal capital dependent upon timeframe and risk appetite
Order Types
Entry: Buy Stop 1 tick above High of “Up” Signal Bars; Sell Stop 1 tick below Low of “Down” Signal Bars
Stop: Bar Close <= 1 tick below Low of “Up” Signal Bar; Bar Close >= 1 tick above High of “Down” Signal Bar
Profit Target: 1.5R distance from “Up” or “Down” fill level with the option to trail stop on each new swing high/low; Bollinger Band Midline minimum 1.5R distance from “Sideways” fill level with option to trail stop on continuation to the opposite end of the range (opposite Bollinger Band)
Trading Plan
❑ Market Type is clearly identifiable as Up, Down or Sideways
❑ Swing Trader Assist indicator is set to the corresponding Market Type: Up, Down or Sideways
❑ Position size is no more than .25%-2% of total nominal capital (based on distance from Signal Bar fill level to Signal Bar stop level as 1R)
❑ Distance from Signal Bar fill level to potential Profit Target is minimum 1.5R
❑ On Hammer or Star fill: close position into trend extension at 1.5R+ or adjust trailing stop on each new swing high/low
❑ On Mean Reversion fill: close position at midline or adjust trailing stop on each continuation to opposite end of range
Usage Notes
The indicator will display developing signals intrabar and it is therefore suggested to wait until bar close to act on any signals. “Autodetect” setting under “Market Type” is currently in beta mode. While it is designed to reveal only relevant signals within strong trends based on a series of EMAs, this setting has not been extensively tested. Use with caution.
The indicator is not meant to be a mechanical trading system. It is designed to assist the trader in objectively and systematically identifying signal bars during the execution of the below swing trading plan. It is up to the trader to determine if overall price action warrants acting upon the signal bars or not.
Case Studies
Divergence for many indicator v3Hello Everyone. Almost one year later, with Pine version 4, I developed new version of the Divergence for many Indicator.
It analyses divergences for 10 predefined indicators and then draws line on the graph. Red for negatif divergence (means prices may go down or trend reversal), Lime for positive divergences (means prices may go up or trend reversal)
Divergences version 2 has latency because it waits higher time frame completion. in this new version the script uses Pivot Points and on every bar it checks divergence between last Pivot point and current bar and if it finds any then immediately draws line and removes old one. so there is no latency with this version.
There are predefined 10 indicators in the script, you have option to choose which indicators the script would analyse for divergence. (RSI , MACD , MACD Histogram, Stochastic , CCI , Momentum, OBV, Diosc, VWMACD and CMF)
In replay mode you can see how the script puts new divergence line and removes old one. you better see it for yourself by using replay mode.
Hope you Enjoy!

Long Tail Candle by Oliver VelezThis script detects an event created by Oliver Velez, it is a wide-range candle with a small body and a long tail (hammer-type candle), its range is noticeably larger than previous candles, as a rule it can be taken that the body should be maximum of 30% of the total range of the candle with a long tail. The stop goes under the tail and the signal is given when the next candle followed by the long tail candle exceeds its body, do not program this condition so that the alert indicates that a long tail candle was generated and the trader has some Time to visualize the graph and wait for the signal.
The default configuration is very basic, each trader must adjust to their needs.
- Trend filters can be activated.
- Alerts available.
Thumbs up
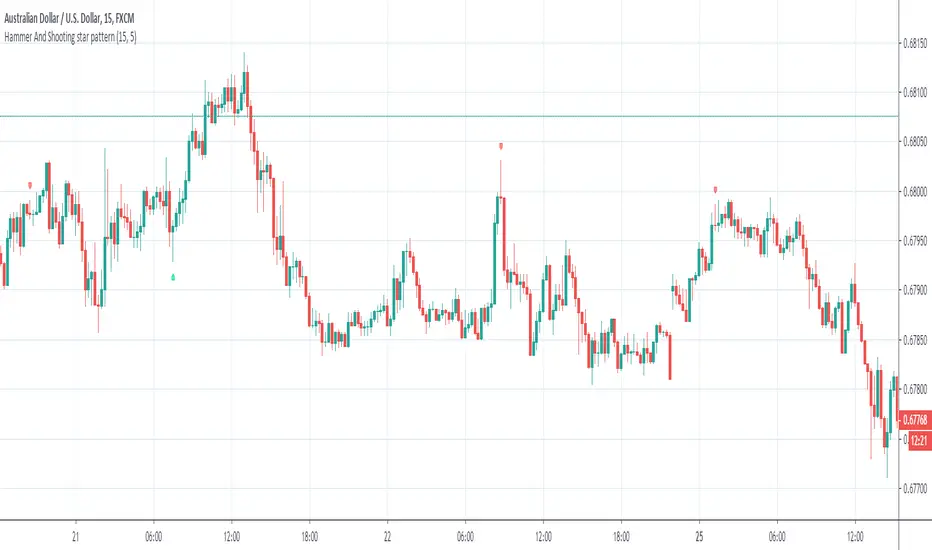
Hammer And Shooting star patternThis script gives you signals based on the shooting star and hammer patterns. You can customize how much bigger you want the wick of the candle to be than the body of the candle and how high the candle has to be compared to the x amount of candles back. We have also coded in alerts:)
Ultimate Pullback IndicatorWhat is the Ultimate Pullback Indicator?
This indicator detects pullback trading opportunities by analyzing price action in a very specific manner.
By combining simple trend filters with various advanced candlestick patterns it detects high-probability trend-continuation setups (and optional exits).
If you use this script to set alerts then you will never miss a pullback trading opportunity ever again!
I personally use this indicator to profitably trade pullback signals in the forex markets on multiple timeframes, from the 15-Minute chart to the 4-Hour and Daily chart.
For more information visit my website: The Ultimate Pullback Indicator .
How Do I Access It?
I currently use this script to trade live money in the forex markets, but I’m also constantly testing and improving it. Therefore this is a constant work-in-progress and I’m always taking meticulous care to make it better.
That’s why this is a premium script that requires payment to access. The other advantage of charging for it is that it retains exclusivity to only a select few dedicated traders.
You can access the script by purchasing a monthly subscription on my website .
If you don’t want to pay for this script then I completely understand and I have plenty of other free scripts that you might be interested in!
Free Trial
I’m a trader myself and so I know how skeptical you might be that this indicator is worth your time and money.
That’s why I am offering a free 14 day trial of the indicator. All you need to do to initiate your trial is Join My Mailing List!
How It Works
When price is above the 50-EMA the script will wait for a pullback of at least two red candles. Once that condition is met, it begins searching for advanced entry patterns.
The opposite is true for short trades – price must be below the 50-EMA and must pull back by at least two green candles before it will begin searching for entry reasons.
Once it detects a valid entry reason it will draw a green arrow (for longs) or a red arrow (for shorts) as well as your stop loss and target price (the red and green lines).
But these settings can be customized however you like. You can change the EMA to any period you want, you can adjust your stop loss distance, you can enable or disable the entry and exit reasons as you wish, and you can adjust the rules for some of the patterns.
For a full list of features and visual examples visit the indicator page on my website: The Ultimate Pullback Indicator .

Pin Bar-Trading RoadMapPin bar- Trading RoadMap
Simple Script to show
Up Pin Bar = Yellow
Down Pin Bar = Black
The Pin Bar Criteria:
- The Shadow ≥ 2 X Body
- Open And Close In The Top 33%
Have a peaceful and profitable trading day 😊
Khaled Maziad

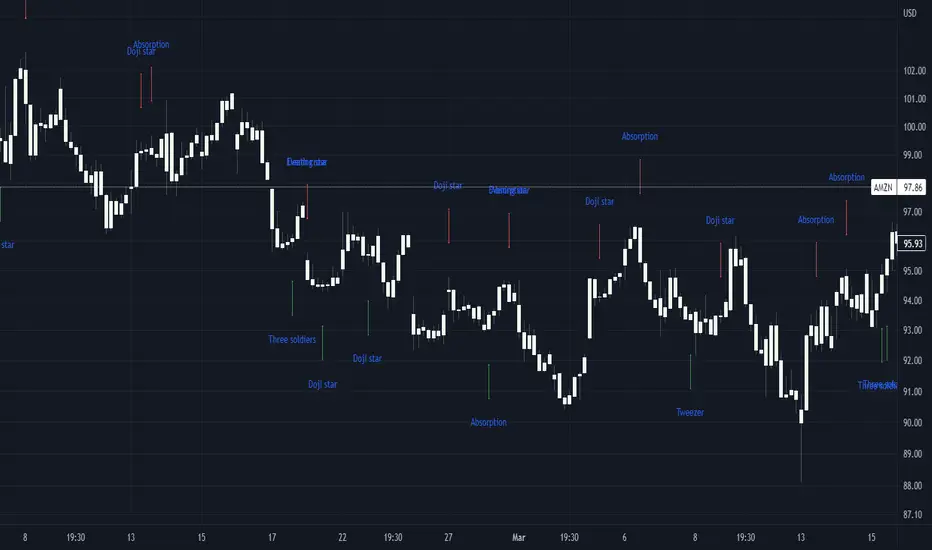
Basic candle patternsBasic candle patterns marker marks:
- Doji stars
- Doji graves
- Doji dragonflies
- Hammers
- Reversed hammers
- Hanging mans
- Falling stars
- Absorption up/down
- Tweezers up/down
- Three inside ups/downs
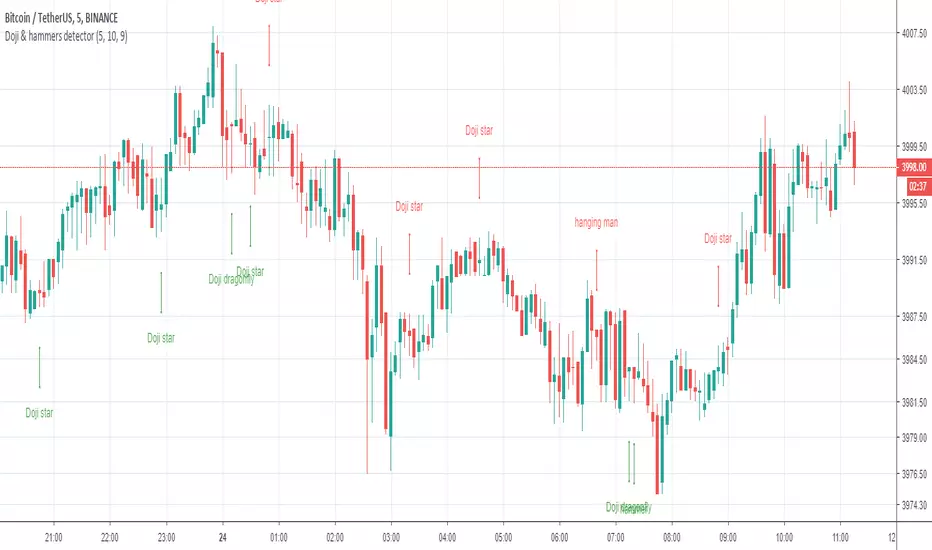
Doji & hammers markerDoji & hammers marker marks:
- long/ short doji star ( marks as doji star )
- doji grave
- doji dragonfly
- hammer
- falling star
- hanging man
- reversed hammer
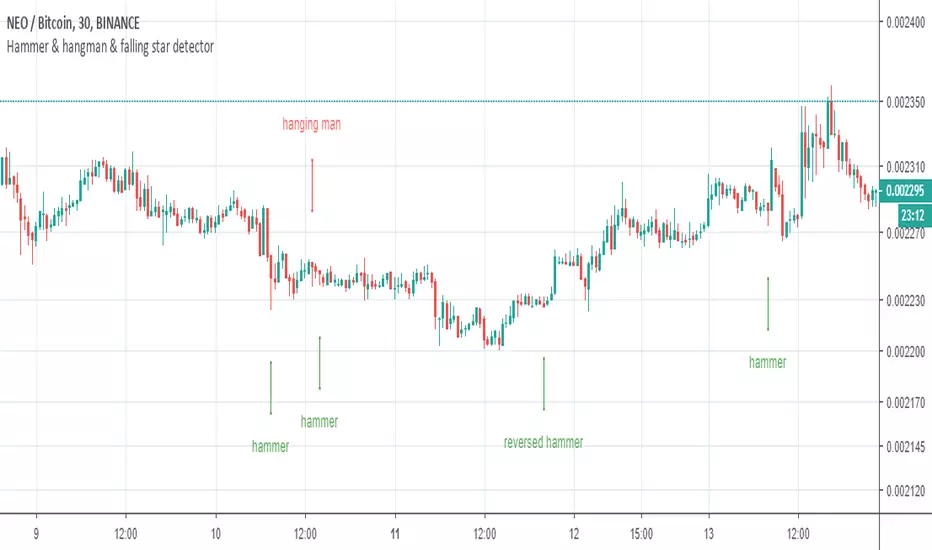
Hammer and Hanging Man candlesticks detectorSimple script to detect and mark possible reversal candlesticks - "hammer" and reversed version "hanging man".
hammer:
en.wikipedia.org(candlestick_pattern)
hanging man:
en.wikipedia.org(candlestick_pattern)
ACW THE HAMMER OF PRINZ PROAcw Hammer Script update
ranges
small,medium, heavy longs/shorts + buy and sell to execute signals when daily vwma passes conditions

Candlestick identificationThis is a first draft of a candlestick pattern recognition study. As of now individual candles and some two-candle patterns can be identified. More to come ...
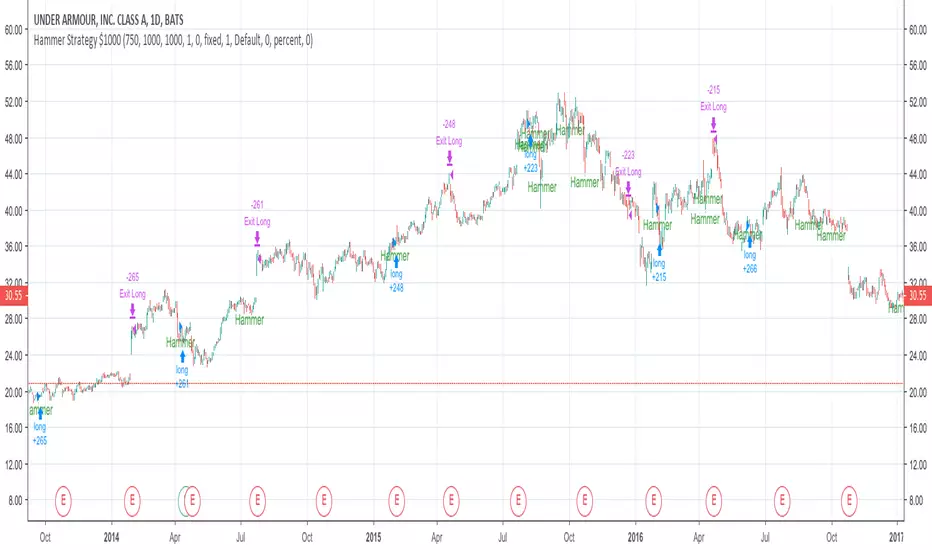
Basic Hammer StrategyThis is a basic strategy that will buy after a hammer is printed, and sell when a predetermined risk or reward price is hit. You can change the risk and reward values in the settings. Risk and reward values are in increments of $0.01. Default values are 75 ($0.75) and 200 ($2.00). If the strategy is producing losses, try adding a zero to the end of the risk value and the reward value. Example: Higher valued stocks may do better with a Risk of 750 ($7.50) and a Reward of 2000 ($20.00). Maybe even a Risk of 750 ($7.50) and reward of 1000 ($10.00). Play around with these values to get the best result for different charts. Initial investment is set to $1000
Hammer/Hanging Man/Shooting StarThe script highlights the Hammer, Hanging Man, and Shooting Star candlesticks on the main chart screen. Please use an oscillator that shows oversold and overbought conditions with this script.
Hammer StrikerThis indicator Scans for Divergence and Hammer and inverted Hammer and doji
after the first oversold spike must come with divergence a doji or a hammer is armed depending on the time frame
is the capitulation candle that is collected
u can then buy or sell

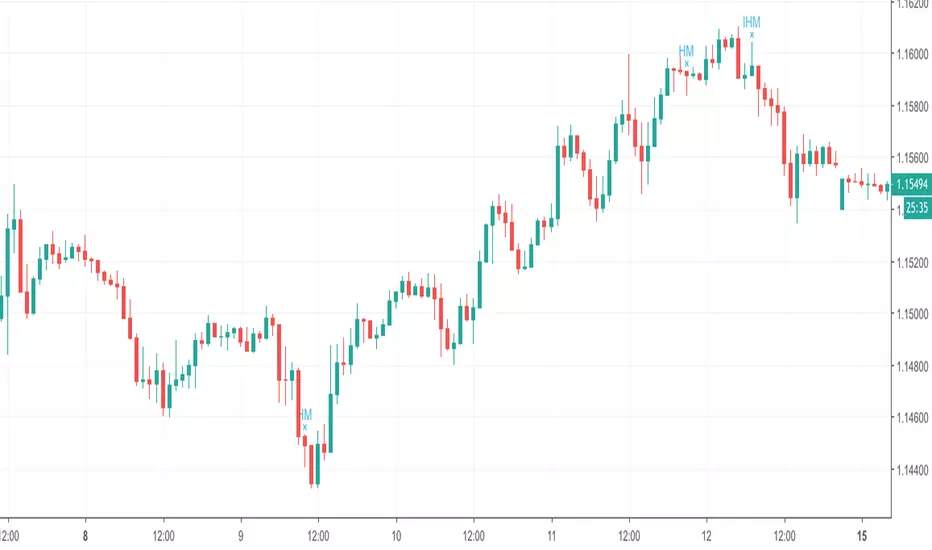
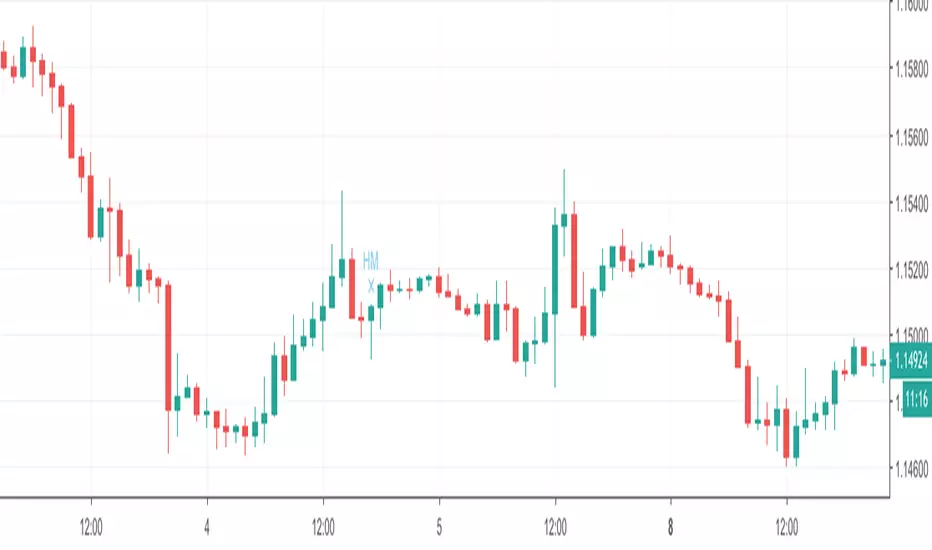
Hammer & Hanging Man & Inverted Hammer & Shooting StarThis script tries to identify the candles that have Hammer & Hanging Man & Inverted Hammer & Shooting Star patterns
Spotting HammersThis script can be used to spot hammers on the charts, I try to avoid false positives by ignoring candles which have less than 0.25% price difference between open and close.

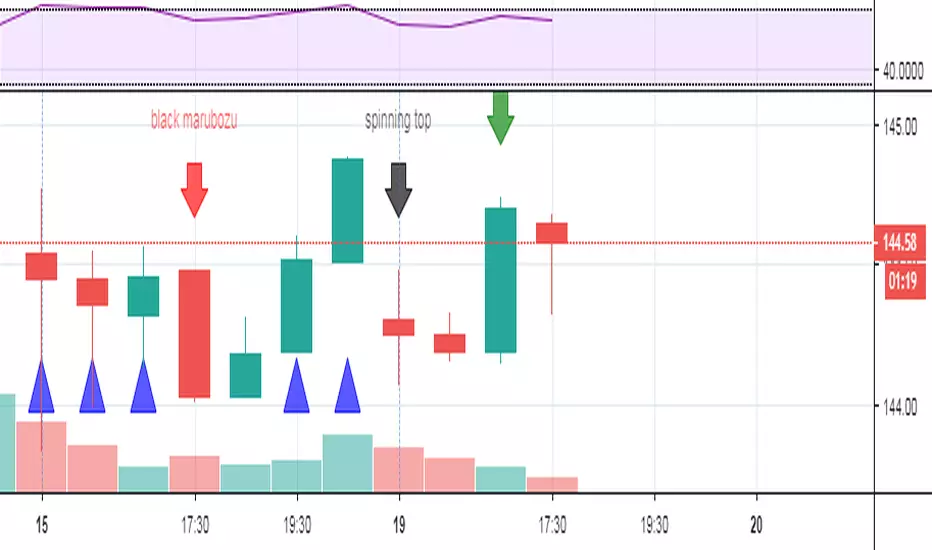
Reversal Candlestick Pattern With Trend IndentifierThis script help to identified popular candlestick pattern combined with trend identifier.
Most script only focus on criteria of the pattern. Such as how much the length of the body compared to previous candle etc.
Besides criteria of the candle, this script also considered the trend into the logic.
For example bullish engulfing is a bullish reversal signal, which is only valid in a down trend.
To identified trend, I'm using RSI. Normally, RSI less than 50 is considered a down trend, and RSI greater than 50 is considered up trend. In this script, you can customize the criteria of how much RSI is up trend and down trend.
Default value RSI >= 55 is up trend, RSI <= 45 is down trend.
Your feedback and suggestion is welcome.
Supported pattern:
White Marubozu (wm)
Black Marubozu (bm)
Hammer (h)
Hanging Man (hm)
Inverted Hammer (ih)
Shooting Star (ss)
Bullish Engulfing (e)
Bearish Engulfing (e)
Tweezer Bottom (tb)
Tweezer Top (tt)
Three White Soldiers (tws)
Three Black Crows (tbc)
Morning Star (ms)
Evening Star (es)
Three Inside Up (tiu)
Three Inside Down (tid)
Reference:
babypips.com

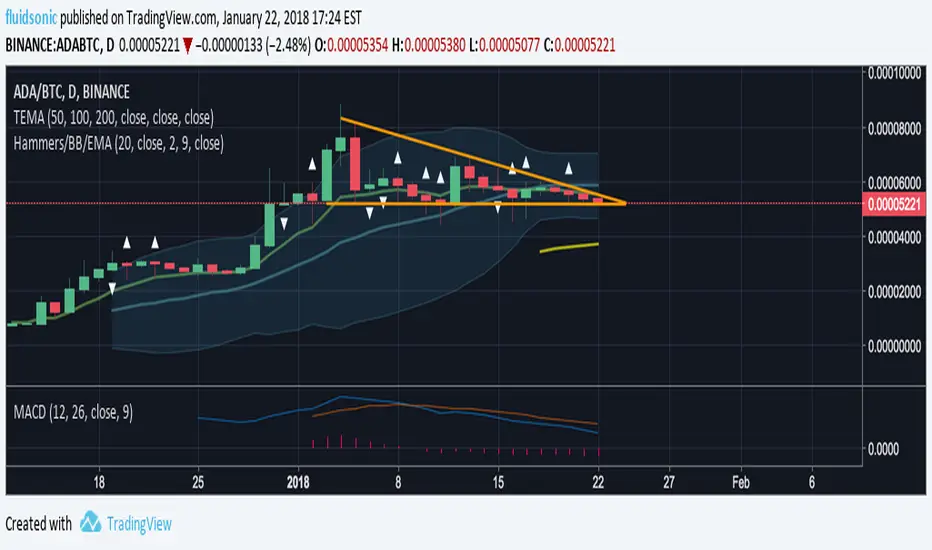
Hammers, Bollinger Bands & Moving Average ExponentialShows indicators above/below hammer-like candles.
Also adds BB & EMA in order to reduce active indicator count.
Candlestick Patterns [DW]This is a simple study designed to track multiple candlestick patterns. Custom alerts included.
