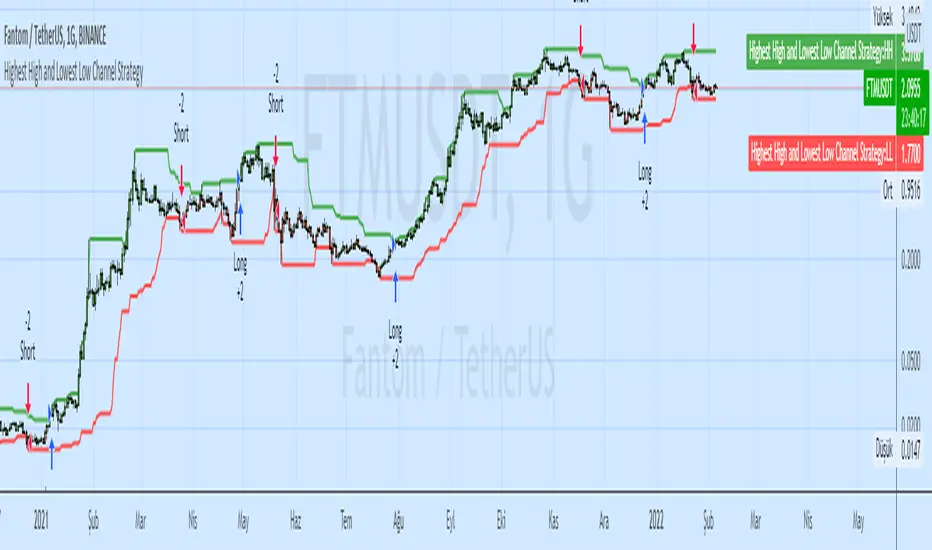
Highest High and Lowest Low Channel StrategyHighest / Highest High Highest (Data) - HHV (Data, Period)
Lowest / Lowest Low Lowest (Data) LLV (Data, Period)
These functions calculate the highest / lowest value of a selected data.
Highest High and Lowest Low options are mostly used.
The Highest function calculates the highest value of the selected data in the past.
The Lowest function calculates the lowest value of the selected data in the past.
High
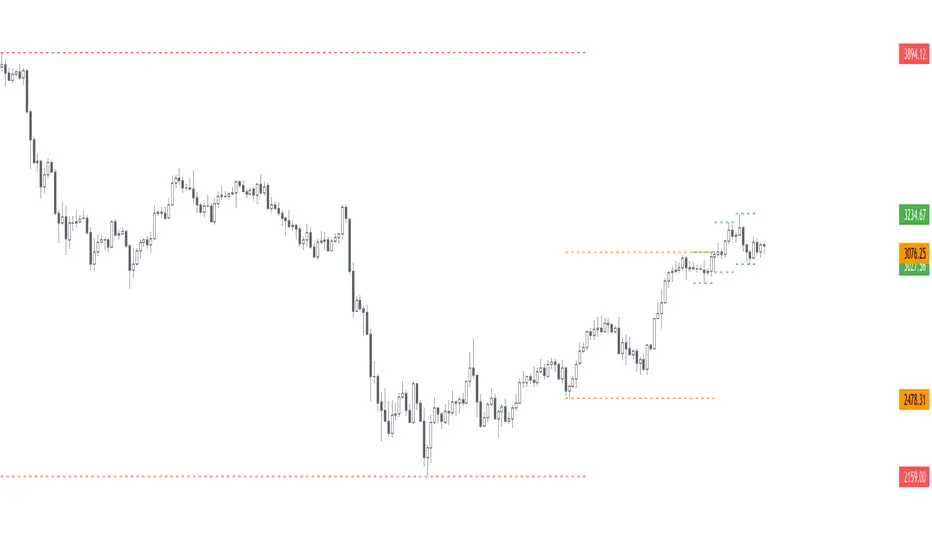
Fractals | Swing Points | Highs & Lows | Custom PeriodsSimple script which marks out key swing highs & lows.
One of the only indicators I have on the chart most days
- perfect for naked charting
- quickly helps you to visually identify key areas of interest
An extension of Bill Williams fractals
- aka short term swing points
Allows you to filter for only the most prominent swing points
- you can even overlay multiple swingpoint filters in different colours (as per example chart)
The number ( Fractal Periods) is simply:
- the number of less prominent points either side of your swing high/low
- example shown on the chart
Otherwise make a fist
- look at your 5 knuckles
- swing high is your middle knuckle
- 2 lower points either side
Bill Williams Original Fractal:
Fractal Periods = 2
Your Fractal Period for Filtering:
3, 4, 5, 30, 365, etc
Allows you to find swing points down to:
Fractal Periods = 1
Simple, easy, shared to enjoy =)

OasisTrading OHL Levels This indicator is free to all Oasis Trading Group members.
Open, High, and Low levels for D, W, M, 90D, 12M.
Labels and Alerts coming soon.
For Access or Questions: Private message us. Thank you.

Stochastic RibbonA series of highs and lows of different lengths to create a ribbon-like indicator to emulate the stochastic oscillator's top (100), middle (50) and bottom (0). Traders can determine the strength of the support and resistance by the number of converging lines, choose price points and visualise momentum waves.
Inputs:
Theme: multiple colours/themes (theme 2)
Length: high/low length (14)
Start: plot number to start ribbon on (1)
PlotNumber: number of plots to show; maximum 10 per top, middle, bottom (10)
Example:
Length: 14
Start: 5
PlotNumber: 10

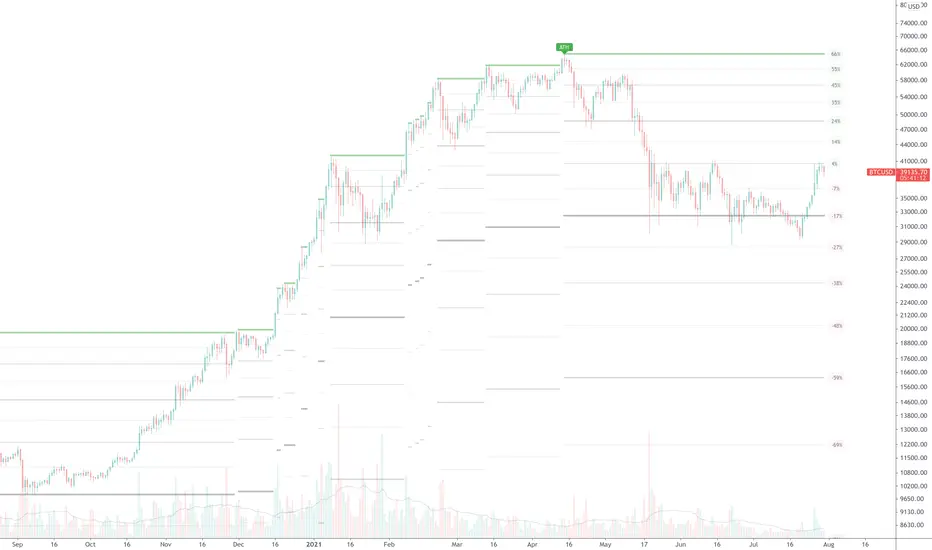
True ATH/ATL w/ labelsPlots the All Time High and All Time Low, with optional labels when a new ATH/ATL is created. Reaches all the way back in history for the true high/low, not limited to the most recent 5000 candles like most scripts. Works on all time frames.
D/W/M/Y OpenThis is just a small Script
It show you:
Low and high of
Yesterday, last week, last month and last year
+
Open today

Previous Week high & lowIt indicates the previous week high and low.
When overlaid on the daily chart, it give buy and sell signals (in the understanding you have made a trade setup). Buy when the price crosses the previous week high, sell when it crosses the previous week low.

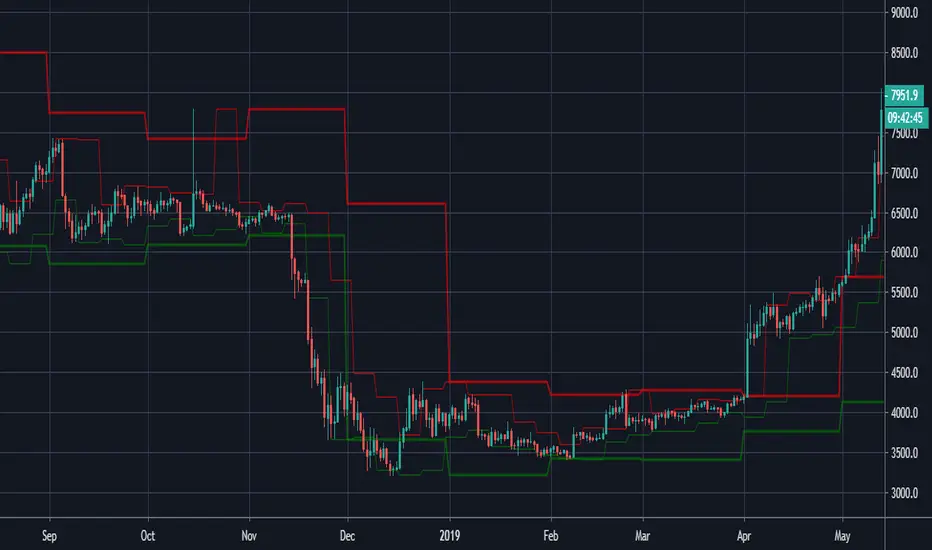
Moving High & Low (2 Time Frames)===========
Moving High & Low (2 Time Frames)
===========
A simple line set indicator displaying the highs and lows of the previous selected timeframe upon a lower timeframe chart (2 line sets available).
e.g. Displaying the Highs & Lows of the last week and/or month on the 1D chart
-----------
Useful for 2 very different approaches to trading markets -
Finding Breakout Points:
For example - When candlestick closes above or below highs from previous week/month it may be a good time to go long as if the trend continues it may well go on for a long time making lots of pips along the way!
Finding SAR points within a range:
For example - When price starts ranging within horizontal line sets that aren't moving either way too much it may be a good idea to place long/short orders at appropriate key levels dictated by these range extremities, anticipating the price to reach these levels and deflect (Stop & Reverse) back the other way.
Either way we would recommend you NOT use this indicator alone, this is very much a confirmation tool or as an aid to find key levels of support/resistance.
Good Luck and Happy Trading!
Yearly OHLplots Yearly Open, High, Low levels
Interesting interactions to note at previous yearly opens

Custom Time ranges. Daily price ranges.Addition to previous time range script, now containing daily ranges. You can select a day of the week, and have it show the high, low, mid, and open of that day.
For the time bands:
Monday = 2
Tuesday = 3
Wednesday = 4
Thursday = 5
Friday = 6
Saturday = 7
Sunday = 1
Example 1:
1500-1800:2
This will colour the background between 3pm and 6pm on Mondays.
Example 2:
0000-0600:247
This will colour the background between midnight and 6am on Mondays, Wednesdays, and Saturdays.
For the Daily price ranges:
Just select the tick-box forthe day, and then the price levels you'd like to see.
I want to add specific weekly levels to this, for example: week 06 of year 2020, but I've not figured out how to do it yet. If anyone knows, I'd appreciate it if you let me know. I'll then update this script.
As always, any questions you may have, please leave in comments below and I'll respond when I have time.
If you notice anything good with this indicator, let me know. We are all in this to make money after all! ;)

Adam H Grimes - Keltner Channels with Day's High & LowThe indicator shows the day's high and low along with the Keltner Channels.
Keltner Channel Period - 20
Keltner Channel Multiple - 2.25

Previous Day Week Highs & LowsThis script plots the previous n day and week highs and lows (previous two days and previous week by default).
Here are some additional info about the script behavior:
Plots highs and/or lows
Plots for days and/or weeks
Day highs and lows are shown only on intraday timeframes
Week highs and lows are shown only on timeframes < weekly
Extension of High, Low and InbetweenThis script plots an extension my other script High, Low, Inbetween.
It sometimes makes it difficult to view the candles effectively so I've added this separately to my other script
It calculates the range between high/low and midpoint.
It then plots these lines as extensions from the high and low.
This is done twice.

High, Low and MidpointThis indicator plots the daily high and low from the previous day. (BLACK)
It then calculates the midpoint of the high and low and plots this. (RED)
This indicator can be used to identify daily ranges and to identify possible support and resistance levels.

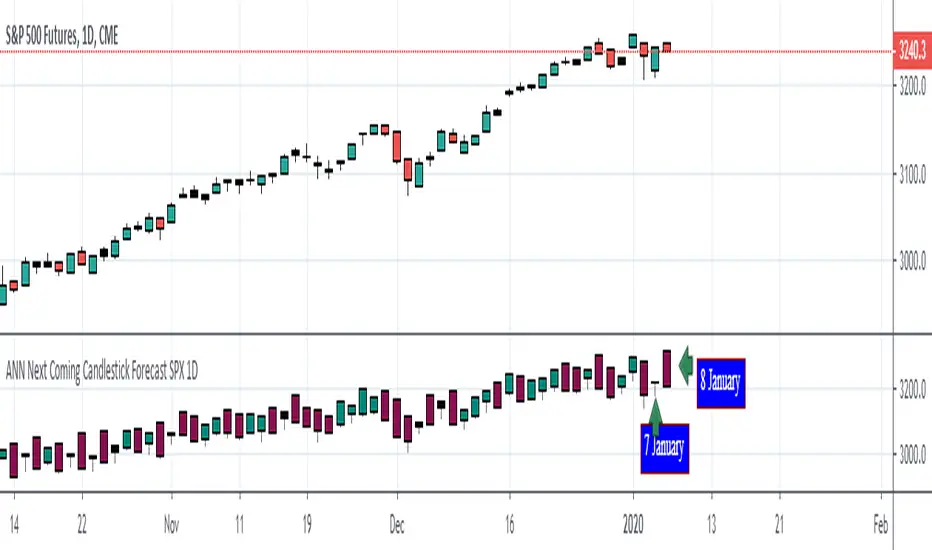
ANN Next Coming Candlestick Forecast SPX 1D v1.0WARNING:
Experimental and incomplete.
Script is open to development and will be developed.
This is just version 1.0
STRUCTURE
This script is trained according to the open, close, high and low values of the bars.
It is tried to predict the future values of opening, closing, high and low values.
A few simple codes were used to correlate expectation with current values. (You can see between line 129 - 159 )
Therefore, they are all individually trained.
You can see in functions.
The average training error of each variable is less than 0.011.
NOTE :
This script is designed for experimental use on S & P 500 and connected instruments only on 1-day bars.
The Plotcandle function is inspired by the following script of alexgrover :
Since we estimate the next values, our error rates should be much lower for all candlestick values. This is just first version to show logic.
I will continue to look for other variables to reach average error = 0.001 - 0.005 for each candlestick status.
Feel free to use and improve , this is open-source.
Best regards.
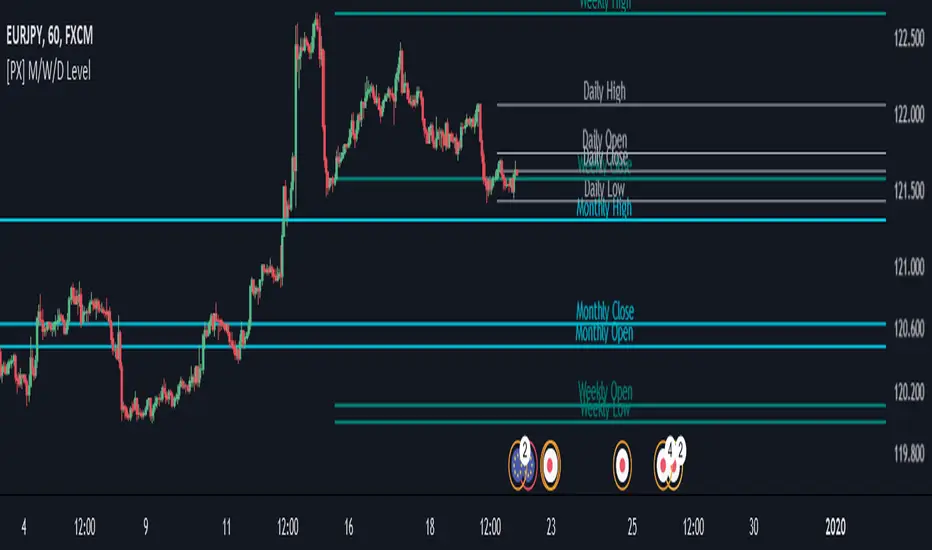
[PX] M/W/D LevelHey guys,
this script shows monthly, weekly and daily OHLC data represented as horizontal level.
I tried to make it as user-friendly as possible. Therefore, you can add different colors and styles for each level, as well as turn them on and off.
With the "Label Offset" -parameter you are in control where the label text should appear. You can shift it from left to right and vice-versa. To shift it to the left choose a negative value. To shift it to the right use a positive one.
This best setting for me personally is the "Candle Selection" -dropdown. This allows you to decide wether you want to show the previous candles OHLC-data or the current live OHLC-data.
!!CAUTION!! If you use the "Current Month/Week/Day" -selection be aware that values shown are "live"-data of the current candle. Therefore, values will change the same way your chart keeps changing on live data.
The "Previous Month/Week/Day" -selection on the other hand is historical data and therefore only changes once we reached a new month/week/day.
If you like my work, consider leaving a like :)
Happy trading!
High and Lows + ATRScript is showing previous year, month and day high and low, plus ATR range from the open price on the current day.

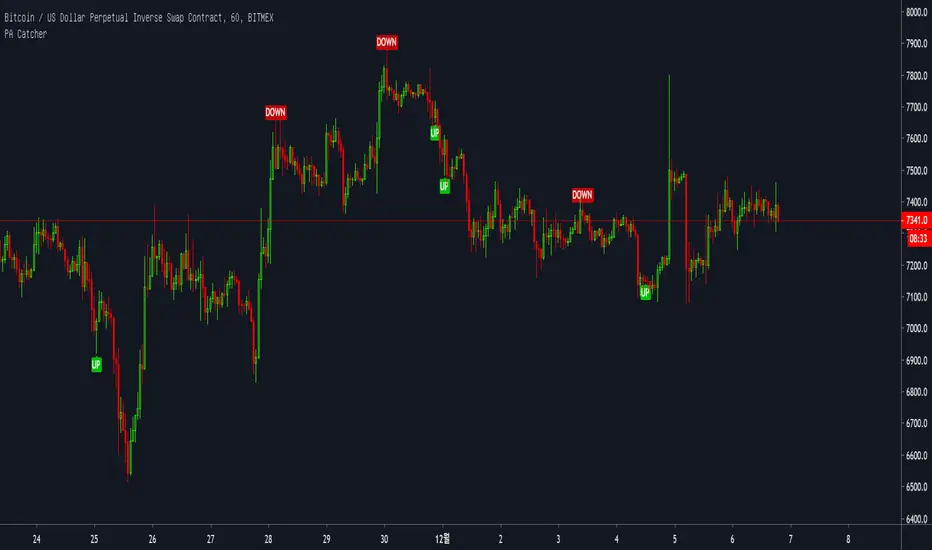
PA CatcherThis is PA Catcher Indicator
Good to Catch small pullback Point
Using with Trend Indicator

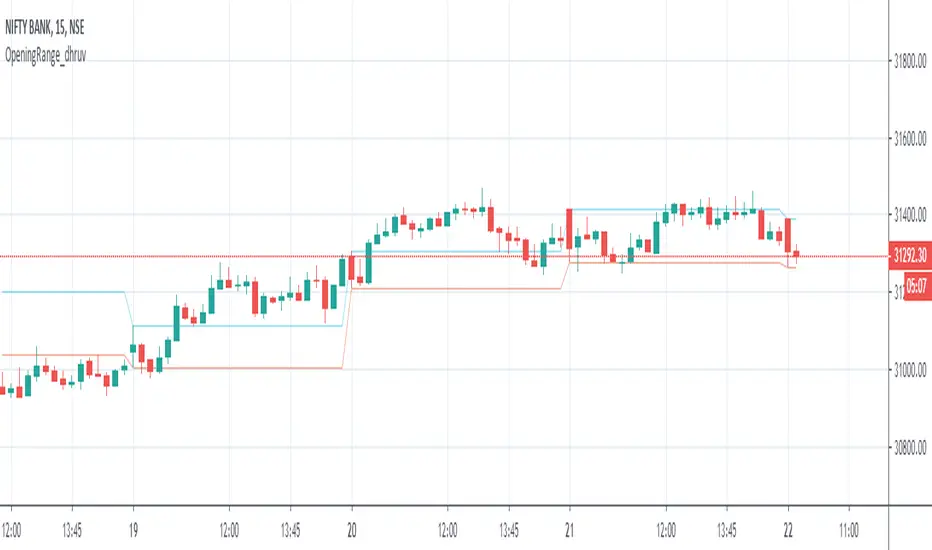
Opening Range_dhruvHello Traders ..
this is the strategy for opening range 15 min high low auto marking tool
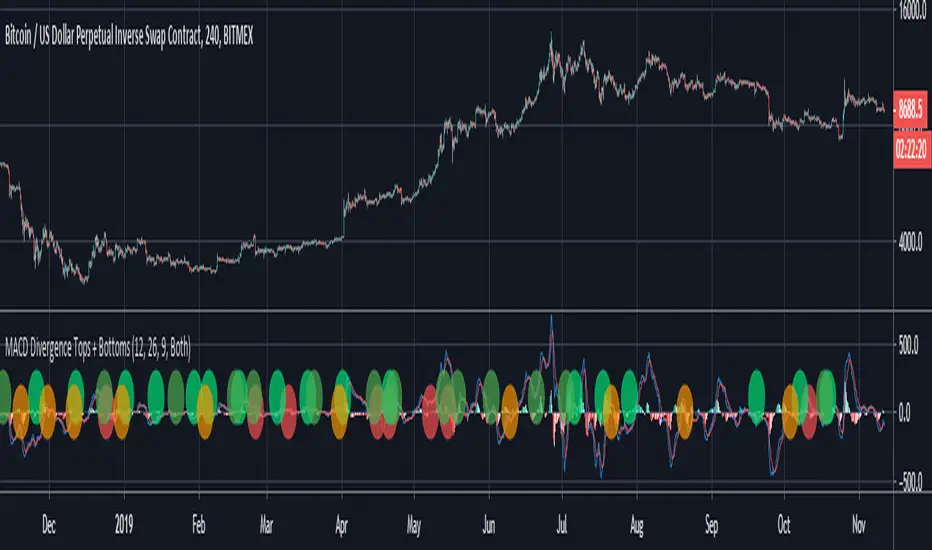
MACD Divergence Tops + BottomsMACD Indicator which plots local peaks and troughs in divergence.
"Classic" Divergence is specified as:
- A higher price, with reduced MACD high --> Potential Sell Point
- A lower price, with higher MACD low --> Potential Buy Point
"Alternative" Divergence is specified as:
- A higher MACD high, with reduced price --> Potential Sell Point
- A lower MACD low, with higher price --> Potential Buy Point
MACD Divergence should be used in combination with other indicators. This indicator identifies local tops and bottoms, with potential for macro trend shifts.