Higher Timeframe Trend Indicator V3.0What is it?
An indicator that depicts the trend of up to 5 higher timeframes on the same chart without needing to context-switch between charts.
Features
- Supports up to 5 timeframes
- Trends indicated by 5 colored buttons: one for each timeframe
- Varying shades of green: uptrend
- Varying shades of red: downtrend
- White/silver: sideways/neutral
- Configurable length (time period) for each timeframe
- Increase length to capture long term trends; decrease it to capture only short term ones
- Configurable sensitivity for each timeframe
- Sensitivity determines what angle is considered trending and what is not
- Increase sensitivity to capture weak trends
- Decrease sensitivity to filter out weak trends and capture only strong/steep ones
- Sensitivity ranges from 1 (least sensitive) to 3 (most sensitive)
- Move the labels around vertically for better visibility by changing the "Location" and "Offset" parameters
How should one use it?
Use it to quickly browse through charts to understand the context across timeframes, and zero in on only those that have trends aligning on the higher and lower timeframes as per your strategy. For e.g., a chart that is trending up strongly on the 15min and 60min (indicated by dark green colored buttons), and trending down on the 1 and/or 5 min (indicated by red-colored buttons), can be shortlisted for a potential pullback trade. Use your favorite pullback strategy (Supply/Demand, Support/Resistance, Moving Averages, etc.) to hop in on the trend.
How are trends determined?
The indicator uses normalized %change in price of the linear regression line segment of the chosen price sources (close, high, low, MA, etc.) over a specified length to determine trend direction and intensity
Known Issues
Will indicate the trend correctly only for timeframes *higher* than the current (visible) resolution/timeframe of the chart. Might not indicate it correctly for lower timeframes ( i.e., lower than the current (visible) resolution/timeframe of the chart). For this reason, all timeframes lower than the current resolution will be hidden in the present release.
Future releases
- I am still experimenting with various sensitivity levels and the corresponding trend shades to make the tool as accurate and intuitive as possible. These modifications might come in
- Sensitivity levels might be increased.
- Bug fixes, if any
Highertimeframes

A Deeper Look Into Security Function & Possible ImprovementsThere is a link below that further explain the purpose of this publication.
A fresh new look into the limitations of the security() function and perhaps expand our horizons on having access to more accurate data no matter from what timeframe you are on.
docs.google.com
As always, it is my desire to help the community to continue reaching new highs.

Daily Moving Averages on smaller timeframeHi everybody, I've made an enhanced version of this indicator published by @veryevilone.
Here's the things I've added:
Now you can choose the type of the moving average between SMA and EMA.
Now you can have up to three moving averages, each with its own settings.
Now you can choose if the datas come from high, low or close.
Hope you enjoy this.

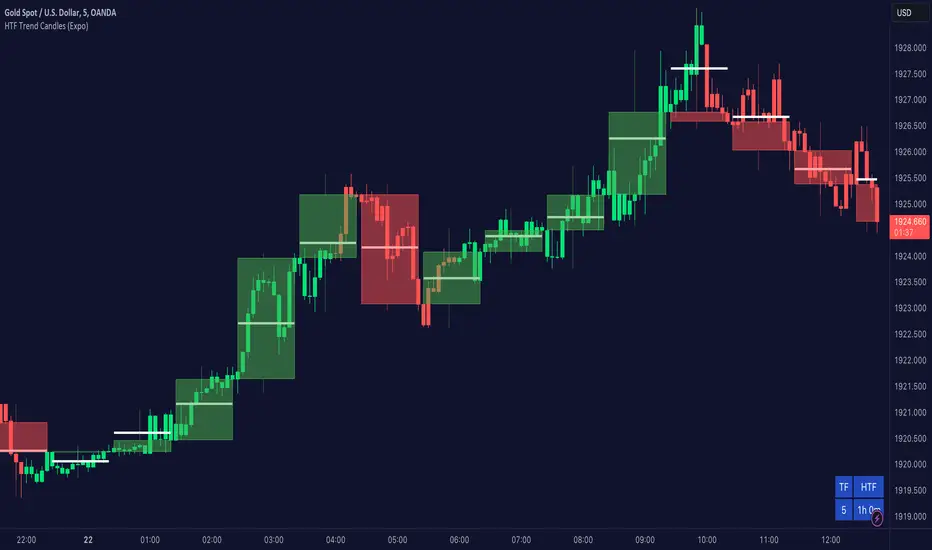
Higher TimeFrame Trend Candles (Expo) The trend is your friend!
Higher TimeFrame Candles (Expo) identifies the trend from Higher TimeFrame and displays a Zone where the trend changes. It is an effective and convenient way of getting a broader picture of the market and you will always be sure that you're trading in the same direction as the higher timeframe trend.
The user can choose which time frame to use. Heikin Ashi Trend can be displayed.
HOW TO USE
1. Use the indicator to identify the direction of the trend.
2. Use the indicator to identify trend changes.
--> Visual Order should be set to "Bring to Front" in order to see the color of the candles.
INDICATOR IN ACTION
4 hour chart
The indicator work on Heikin Ashi, Candles, Bars, Renko, Line Break, Kagi, and Point & Figure chart.
I hope you find this indicator useful , and please comment or contact me if you like the script or have any questions/suggestions for future improvements. Thanks!
I will continually work on this indicator, so please share your experience and feedback as it will enable me to make even better improvements. Thanks to everyone that has already contacted me regarding my scripts. Your feedback is valuable for future developments!
ACCESS THE INDICATOR
• Contact me on TradingView or use the links below
-----------------
Disclaimer
Copyright by Zeiierman.
The information contained in my scripts/indicators/ideas does not constitute financial advice or a solicitation to buy or sell any securities of any type. I will not accept liability for any loss or damage, including without limitation any loss of profit, which may arise directly or indirectly from the use of or reliance on such information.
All investments involve risk, and the past performance of a security, industry, sector, market, financial product, trading strategy, or individual’s trading does not guarantee future results or returns. Investors are fully responsible for any investment decisions they make. Such decisions should be based solely on an evaluation of their financial circumstances, investment objectives, risk tolerance, and liquidity needs.
My scripts/indicators/ideas are only for educational purposes
The trend changes direction.
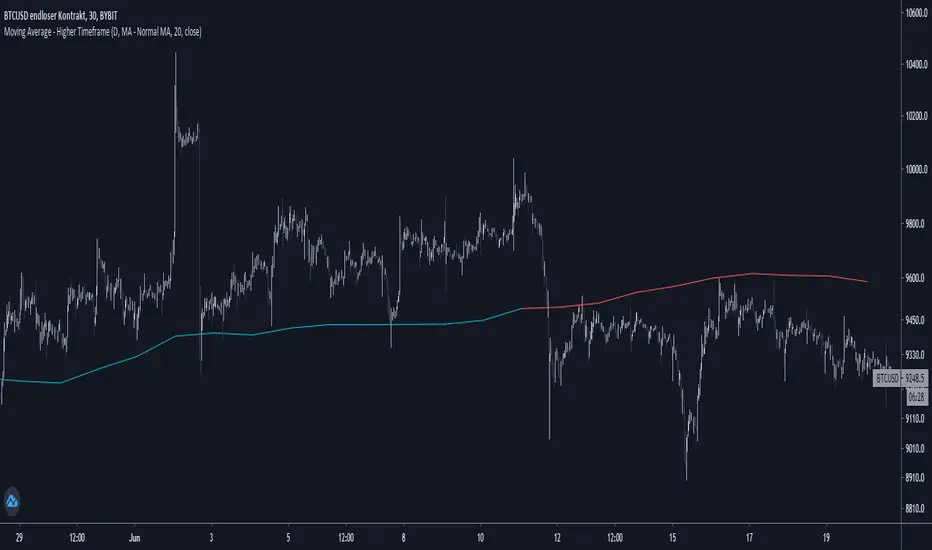
Moving Average - Higher TimeframeThis indicator let you choose between different Moving Average types while being able to adjust the plotted timeframe:
- Simple Moving Average
- Exponential Moving Average
- Weighted Moving Average
- Hull Moving Average
Set lengths according to your needs / your preferred moving average.
If you have any opinions or wishes feel free to contact me or simply leave a comment.
//@jnnkwnsch
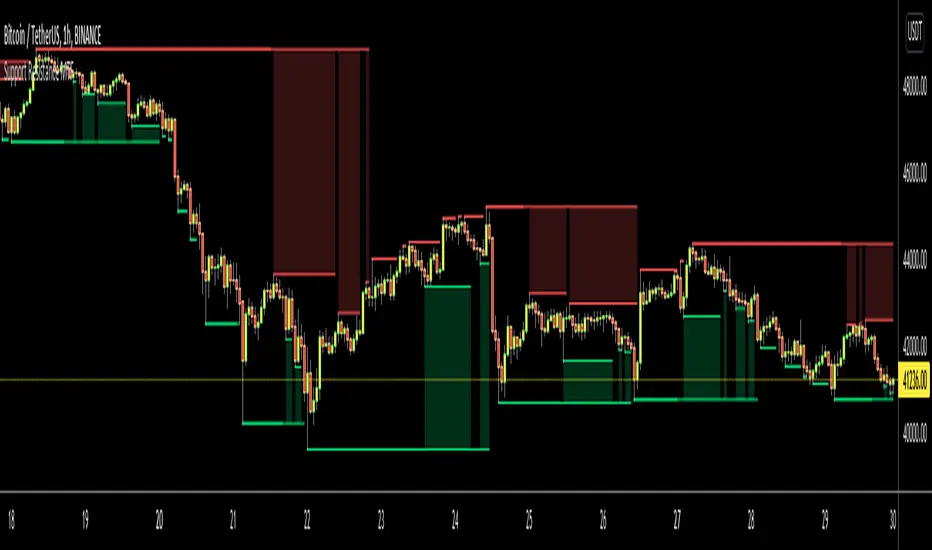
Support Resistance MTFHello Traders,
This is Support Resistance script that uses Multi Time Frame. While getting Close/Open/High/Low values of Higher Time Frames the script does NOT use Security function , instead it calculates them.
while choosing Higher Time Frame, you can use "Auto" option so it uses predefined Higher Time Frames, or you can choose the Higher Time Frame Manually from the list. options for HTF => 15mins, 30mins, 60mins, 120mins, 180mins, 240mins, 720mins, Day, Week, 2 Weeks, Months, 3 Months, 6 Months, 12 Months.
You have option to use High/Low or Close/Open values while calculating support resistance levels.
"Period for Highest/Lowest Bars" option is used as loopback period to check if it's Highest/lowest bars. smaller numbers = more sensitive result.
You have option for transparency and coloring of support/resistance levels/zone => Red, Lime, Blue, White, Black, Olive, Gray
An example for 15 min chart, 4hours selected as HTF
You can set transparency and colors as you wish:
You can choose Close/Open prices while calculating S/R levels instead of High/Low
Enjoy!
Trend LinesHello Everyone! This is my new trend lines script (after beta version that was published almost one year ago)
The idea is to find Pivot Highs (PH) and Pivot Lows(PL) first.
Then, If current PH is smaller then previous PH (means no new higher high and possible downtrend) then draw trend line using them. and also it checks previous trend line (if exits) and if current angle is smaller then don't extend previous one.
Same idea when using Pivot Lows, If current PL is higher then previous PL (means no new lower low and possible uptrend) then draw trend line using them. and also it checks previous trend line (if exits) and if current angle is smaller then don't extend previous one.
Optionally style of old trend lines drawn as dashed.
Hope you enjoy it!

Bollinger Bands MTF [LonesomeTheBlue]With this script you can follow Bollinger Bands for current and higher time frame together. Higher time frame is calculated by script.
if current period
1m => higher period=5m
3m => higher period=5m
5m => higher period=15m
15m => higher period=1h
30m => higher period=1h
45m => higher period=1h
1h => higher period=4h
2h => higher period=4h
3h => higher period=4h
4h => higher period=1day
1day => higher period=1week

Triple Power Moving Average v.02 by @Nico.MuselleALL THE POWER OF MULTIPLE MOVING AVERAGES ---- NOW COMPLETELY FOR FREE
Did you ever want to apply the Daily Moving Averages to an hourly chart ?
Are you tired of switching between time frames for seeing where that moving average is on the higher time frame ?
Do you want to display these moving averages on your current time frame ?
NOW YOU CAN !
In comes the Power Moving Average which offers you the opportunity to :
Display moving averages of any (higher) time frame you wish
In this version we added 4 hour, 6 hour, 8 hour and 12 hour selection for your moving averages
Select which type of Moving Average you want to display
Select up to 3 different types, lengths and time frames to display
Power Moving Average offers the following types of averages :
SMA - Simple Moving Average
EMA - Exponential Moving Average
WMA - Weighted Moving Average
VWMA - Volume Weighted Moving Average
RMA
See the configuration options here :
i.imgur.com
Q : Why are the Power Moving Averages not smooth historically ?
A : As the moving average is calculated on the close of the higher time frame and this close does not change for X- candles, the moving value does not change
Q : Can I add more than one Power Moving Average ?
A : Yes you can, just apply the Power Moving Average multiple times to your chart (free TradingView accounts are limited to 3 indicators)
Q : Can I apply lower time frame Moving Averages ?
A : While this is possible, the value will change during your current time frame candle, this might however be something scalpers want ?
Q : I have a free TradingView account and reached my indicator limit, what can I do ?
A : There are 2 possible solutions, first one is to get a TradingView Pro account (www.tradingview.com), second option is to get our Triple Power Moving Average for FREE.
If you like the indicator, please like and share !
Thank you !

Power Moving Average by Nico MuselleA PRO version with more options is available at
Did you ever want to apply the Daily Moving Average to an hourly chart ?
Are you tired of switching between time frames for seeing where that moving average is on the higher time frame ?
Do you want to display these moving averages on your current time frame ?
NOW YOU CAN !
In comes the Power Moving Average which offers you the opportunity to :
Display moving averages of any (higher) time frame you wish
Select which type of Moving Average you want to display
Power Moving Average offers the following types of averages :
SMA - Simple Moving Average
Read more: Simple Moving Average (SMA) www.investopedia.com
EMA - Exponential Moving Average
Read more: Exponential Moving Average (EMA) www.investopedia.com
WMA - Weighted Moving Average
Read more: Linearly Weighted Moving Average www.investopedia.com
VWMA - Volume Weighted Moving Average
Read more : www.tradingsetupsreview.com
RMA
Read more : partners.futuresource.com
Q : Why are the Power Moving Averages not smooth historically ?
A : As the moving average is calculated on the close of the higher time frame and this close does not change for X- candles, the moving value does not change
Q : Can I add more than one Power Moving Average ?
A : Yes you can, just apply the Power Moving Average multiple times to your chart (free TradingView accounts are limited to 3 indicators)
Q : Can I apply lower time frame Moving Averages ?
A : While this is possible, the value will change during your current time frame candle, this might however be something scalpers want ?
Q : I have a free TradingView account and reached my indicator limit, what can I do ?
A : There are 2 possible solutions, first one is to get a TradingView Pro account (www.tradingview.com), second option is to get our Triple Power Moving Average for a one time price. Please PM for more information.
If you like this script, please share and hit that like bottom ! Also check out my other indicators here : www.tradingview.com
Thank you !

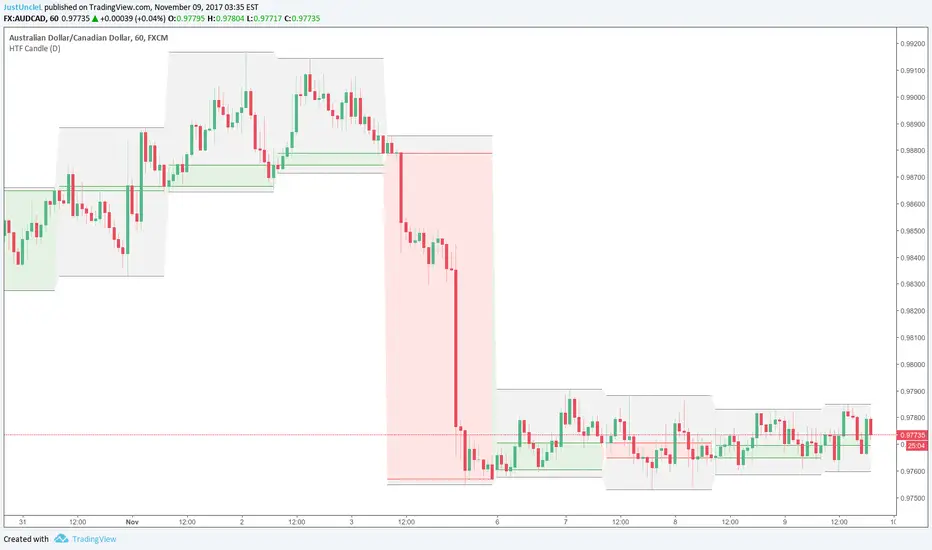
HTF Candle R1.2 by JustUncleLDescription:
This indicator creates a representation of a Higher Time Frame (HFT_) candlestick which is overlaid onto the Current chart. You can optionally show Body and/or Wicks.
Warning:
Be aware the current HTF_ candle does not back update the bar representation and chart needs be refreshed to update properly. I don't know of a way around this issue.