Highlight

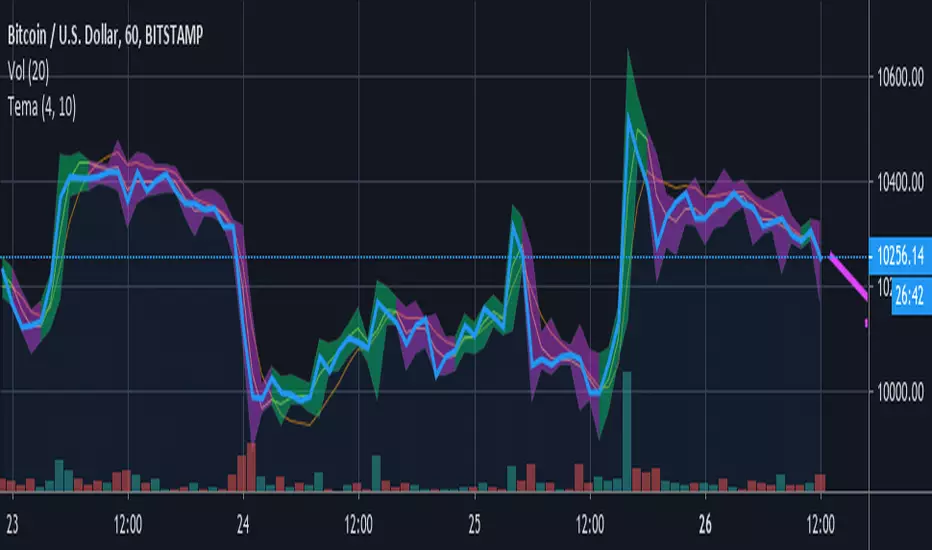
Team TemaTema highlights bars based on the triple ema ( tema ) with two different length qualifiers.
The tema is believed to react quicker to price fluctuations than the simple moving average ( sma ), the exponential moving average ( ema ), and the double ema ( dema ). The shorter length tema crossing over the longer one is believed to indicate a bullish trend ahead, highlighted in green. The shorter length crossing below the longer one may indicate a bearish trend is on the way.
Benefits.
It has been found that most traders lose money because they panic early, and don't let profits run. Tema helps me to filter out trading noise , reduce stress and stay in profitable trades longer . Highlighting the candle wicks reveals trends in highs and lows that may be difficult to see otherwise. I like being able to adjust the settings and look back to see how much noise would have been good to filter out.
Things to watch out for.
Like other moving averages, the tema is a lagging indicator , vulnerable to false signals, especially during a large move up or down . Use with other indicators that are better designed for detecting tops and bottoms. Adjust the lengths to filter out what you think may be wrong signals. The settings are subjective , and it depends on the security and the time period. Manually create a note or reminder with your favorite settings for each. You may choose how much price fluctuation to filter out by going into settings, marked with the gear icon.
Unconfirmed sentiment arrow.
Tema draws an arrow of current sentiment , based on the unconfirmed price action of the faster tema. It shows where it thinks prices are presently going, barring other factors. Its main purpose is to extend a line from the end of the tema, so it is not difficult to see. Remember, it is probably wrong until the last bar closes. And even then, buyers or sellers could come along at any moment and change the outlook.
Year Open Price LevelAn utility tool that plots a dynamic level using the opening price of each year on the chart.
Allows to highlight the change in the price relative to this level.

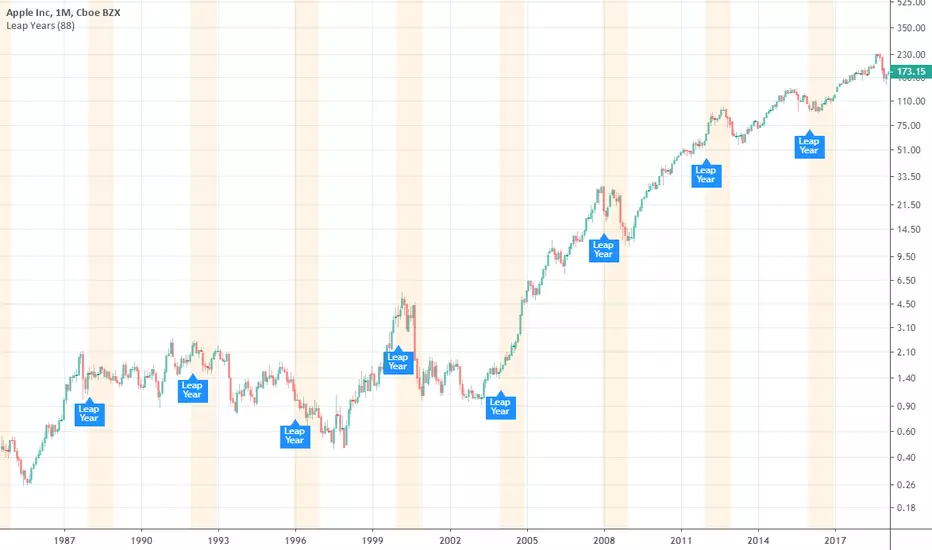
QuartersAn utility tool that highlights the financial calendar quarters and marks the beginning of each period with label.
Weekly Chart:
As always, you can support the author with donations via PayPal or crypto. I will be much appreciated and thankful for that.
A list of addresses is here bit.ly

Commodity Channel Index Plus (CCI+)Same CCI you love, but with a candle highlighter, control over Overbought & Oversold Line placement, and Alert Conditions for Overbought & Oversold and Recoveries, built right in.
Set the Overbought/Oversold Lines anywhere you want... use them to create CCI+ Alerts.

Volume HighlighterHighlight Candles or Volume Bars when volume breaks through the Moving Average, without volume obscuring your chart or candles! Also set an alert when volume breaks through its moving average! 1) Create an alert, 2) Select "Volume Highlighter" from the Alert Condition dropdown box, 3) select "Volume Bars" from the second dropdown, and 4) select "Volume MA Breakthrough" from the third dropdown.
Normal:
Choice of Highlighting Volume Bars and/or Candles on the chart:
Enjoy.
~jdhadwin

Trading hours background highlight UTC basedHighlights trading opening hours in the background based on UTC times.
Settings for US and EU markets available now, let me know if you want other markets.
Range Identifier [LazyBear] ---- May 05 2015 -----
Added support for filtered ranges:
RID V3 : pastebin.com
RIDv3 has full backward compatibility (!?), meaning all my descriptions below still apply for V3.
-- In addition, I have added a NON-OVERLAY mode, which can be put in its own pane, that shows the number of bars in the current range.
-- in Overlay mode, you can switch on/off filtering ranges based on the bar count.
Sample chart:
---- April 30 2015 -----
Updated the source to show a connected Midline only when ConnectRanges option is enabled.
Updated src: pastebin.com
Sample chart:
---- Original Desc ----
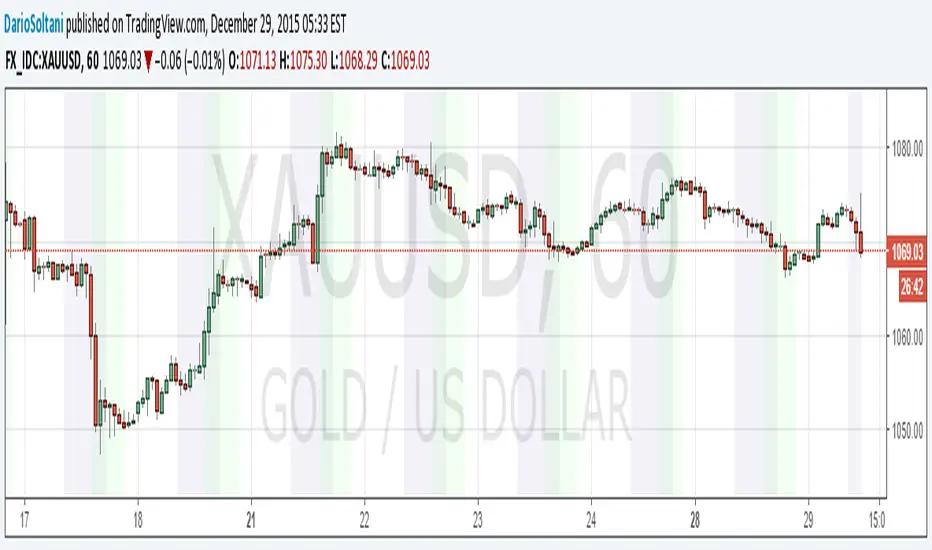
This is a simple indicator that highlights the price ranges. Very helpful in determining a breakout.
There are many ways to incorporate this in to your strategy. One simple idea could be to buy if the price breaks above a range, when above the specified EMA, and to SELL when it breaks down from a range below the EMA.
All options are configurable. Alerts can be setup using the specified plot names.
By default it shows only the ranges, but can be configured to show the full "channel". Chart below shows connected ranges with highlights ON.
Range highlighting can be turned OFF. Chart below shows that:
Note for the pine coders:
As you probably noticed in the charts above, single range is showing 2 colors(red/green). Fill() doesn't accept a series for colors, so I worked around this using two fill() statements with a moving DUMMY line, to get this mixed color effect.
List of my public indicators: bit.ly
List of my app-store indicators: blog.tradingview.com
