Liquidity Sweeps 2.0 – MGTrading Professional Liquidity Sweep Engine with Volume, MACD, Trend, SMT Divergence & Rolling VWAP
Liquidity Sweeps 2.0 is a **complete precision-based liquidity detection framework** built for traders who follow smart money concepts, sweep-based entries, and algorithmic price behavior.
This tool detects **high-probability buy/sell sweeps**, confirms them with market structure, Volume, MACD engine, Trend filtering, SMT divergence, and overlays a Rolling VWAP to track accumulation & distribution behavior.
It is designed for futures, indices, forex, crypto, and options traders.
-
🔥 **MAIN FEATURES**
✅ **1. True Liquidity Sweep Detection**
Automatically detects when price:
* Sweeps a prior high (Sell Sweep)
* Sweeps a prior low (Buy Sweep)
* Rejects and closes back inside the previous range
This helps identify real **stop hunts**, **liquidity grabs**, and **reversal moments**.
---
✅ **2. Volume Spike Confirmation (Smart Filter) **
Sweeps are only confirmed when volume exceeds the dynamic SMA threshold.
This filters out weak sweeps and keeps only **high-quality liquidity grabs**.
✅ **3. MACD Engine Confirmation**
Advanced MACD rules confirm sweeps by:
* MACD direction
* MACD signal agreement
* MACD histogram alignment
This dramatically increases accuracy and removes fake sweeps that occur in weak trends.
Optional **MACD Divergence Detection** reveals trend exhaustion before major reversals.
✅ **4. EMA Trend Filter (9/21) **
Avoid fighting the trend with the optional trend filter:
* Only buy sweeps in uptrend
* Only sell sweeps in downtrend
Great for scalpers and day traders who want trend alignment.
✅ **5. SMT Divergence (Relative Strength vs Reference Symbol) **
Enable SMT to detect when:
* Your chart sweeps a high/low
* But the reference symbol DOES NOT
This creates **displacement**, a powerful reversal signal used by institutional traders.
The symbol is selectable (ES, NQ, SPY, QQQ, BTC.D, DXY, etc.).
✅ **6. Rolling VWAP (RVWAP)**
A more dynamic version of VWAP using:
* Time-based rolling windows
* Volume-weighted price
* Automatic or adjustable window size
* Color change based on slope
Excellent for tracking **accumulation**, **distribution**, and **algorithmic trend bias**.
✅ **7. Clean Mode**
Only show “confirmed” sweeps with a ✓
Ideal for traders who want a simple and clean chart.
# 📊 **LABELS & COLOR CODING**
* 🟥 **Sweep Sell**
* 🟩 **Sweep Buy**
* 🟧 **MACD Bearish Divergence**
* 🟩 **MACD Bullish Divergence**
* 🟦/🟧 **RVWAP Up/Down Trend**
* “✓” means the sweep passed all confirmations.
# 🎯 **WHO IS THIS FOR?**
✔ Futures Traders (ES, NQ, YM, RTY, CL, GC)
✔ Options Traders (SPX, SPY, QQQ)
✔ Forex Traders
✔ Crypto Traders
✔ Smart Money / ICT Style Traders
✔ Liquidity Sweep Traders
✔ Scalpers, Day Traders, Swing Traders
If you trade **liquidity**, **sweeps**, **SMT**, **divergence**, or **VWAP-based behavior**, this indicator is designed for you.
# 🧠 **HOW TO USE IT**
1. Wait for a sweep label to appear at a liquidity pool.
2. Confirm with volume + MACD + trend (if enabled).
3. Watch RVWAP for bias (accumulation vs distribution).
4. Enter on the imbalance/FVG, retrace, or structure break.
5. Use SMT divergence as a premium confirmation.
This tool does NOT repaint after the bar closes.
Signals only appear when conditions are confirmed.
# 📦 **SETTINGS OVERVIEW**
* Lookback window for sweeps: (7 - 13)
* Volume spike threshold
* MACD lengths & filters
* Trend filter (EMA 9/21)
* SMT reference symbol
* RVWAP window + colors
RVWAP Line Width: (2) & Minimum Window Bars: (5)
* Label placement & visual adjustments
* Clean mode
Everything is fully customizable.
⚠️ **DISCLAIMER**
This indicator is for educational purposes only.
It does not guarantee profits.
Always backtest, practice proper risk management, and trade responsibly.
❤️ **If this helped you, leave a like & comment! **
Your support motivates further updates, improvements, and new tools.
Highs

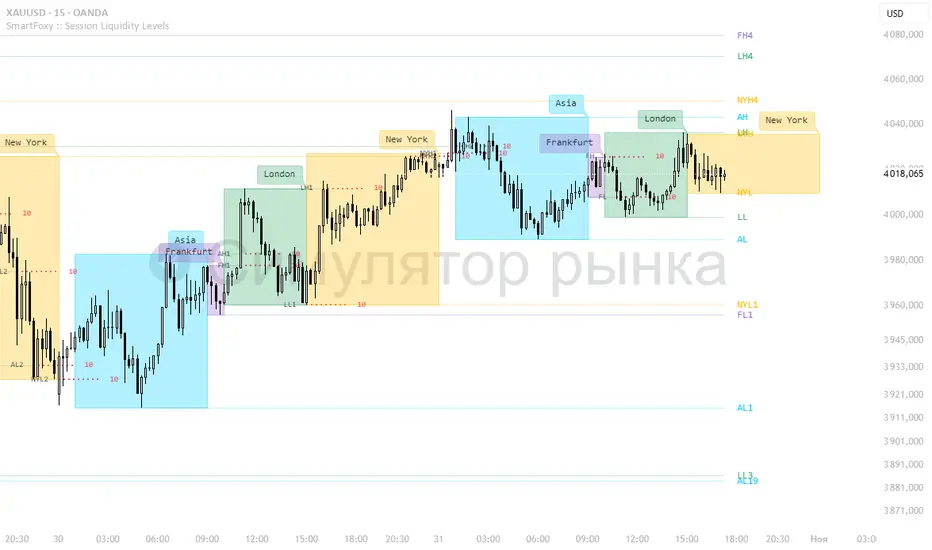
Killzone Session High/Low Levels [SmartFoxy]Killzone Session High/Low Levels
The Killzone Session High/Low Levels indicator by SmartFoxy provides a complete intraday framework for understanding session-based liquidity, market structure rotation, and breakout behavior across global trading sessions.
It automatically plots the High/Low ranges for each selected session, highlights session killzones, and tracks breakout events with optional alerts.
This tool is designed for traders who rely on session dynamics (Asia, Frankfurt, London, New York) to identify liquidity targets, sweep zones, key ranges, and continuation/reversal opportunities.
________________________________________
How It Works
The indicator detects the active trading sessions for each day and builds structural High/Low ranges for them:
• Asia Session Range (High/Low);
• Frankfurt Session Range;
• London Session Range;
• New York Session Range;
• Optional custom session (NY Open, or any killzone).
For each session, the script can display:
• Session box or column;
• High/Low levels;
• Labels for every range (H/L);
• True session boundaries using user-defined timezone;
• Auto-extended levels up to the latest candle;
• Break levels after a breakout;
• Conditional removal or recoloring after a level is breached.
This gives traders a clean visual map of session liquidity and how price interacts with it throughout the day.
________________________________________
Key Features
1. Multiple Global Sessions •➤ Asia, Frankfurt, London, New York, plus one custom session for advanced killzone mapping.
2. Session High/Low Liquidity Levels •➤ Automatic plotting of every session’s High and Low, with optional labels and price markers.
3. Session Boxes or Columns •➤ Two display modes allow traders to visualize the session either as a filled box or a clear vertical column.
4. Breakout Logic & Temporary Levels .
When price breaks a session High/Low:
• Levels can be extended for a selected number of bars
• Or removed instantly after a breakout
• Or recolored to highlight the sweep event
This enables clean identification of liquidity grabs, breakouts, and continuation setups.
5. Alerts for Session Breakouts .
Set alerts when price breaks:
• Any session level
• Only levels formed on the current day
Perfect for traders who want real-time notifications of sweeps or key structure breaks.
6. Full Customization
You can configure:
• Session times;
• Timezone;
• Colors;
• Labels;
• Line styles and widths;
• Breakout behavior;
• Killzone range handling.
Everything is adjustable to match any trading style.
________________________________________
How to Use
1. Enable the sessions you want to track •➤ Asia, Frankfurt, London, New York, or custom.
2. Choose display mode
Box mode for visual range blocks;
Column mode for clean vertical alignment.
3. Enable High/Low Levels .
These act as liquidity magnets and key rejection zones.
4. Turn on Breakout Levels (optional)
Useful for spotting sweeps and continuation setups.
5. Turn on Alerts if you want notifications when price breaks levels.
6. Use session levels as liquidity reference points .
They work exceptionally well with smart money concepts (SMC), ICT, and intraday structure analysis.
________________________________________
Why This Indicator Is Useful
Shows exactly where liquidity is placed each session;
Highlights market structure transitions as sessions hand over control;
Helps identify stop hunts, sweeps, reversals, and continuation patterns;
Provides real-time alerts for structural breaks;
Organizes the chart and reduces noise;
Works with any intraday timeframe and any market.
This makes it valuable for scalpers, day traders, and SMC/ICT-style analysts.
________________________________________
Summary
Killzone Session High/Low Levels delivers a complete, highly customizable intraday mapping system based on global trading sessions.
It clarifies the session structure, reveals liquidity targets, and empowers traders to make confident trading decisions using clean, objective market data.
New Highs-Lows US (NYSE,NASDAQ,AMEX) New 52-weeks Highs vs. Lows US market (NYSE,NASDAQ,AMEX)
Enjoy ;)

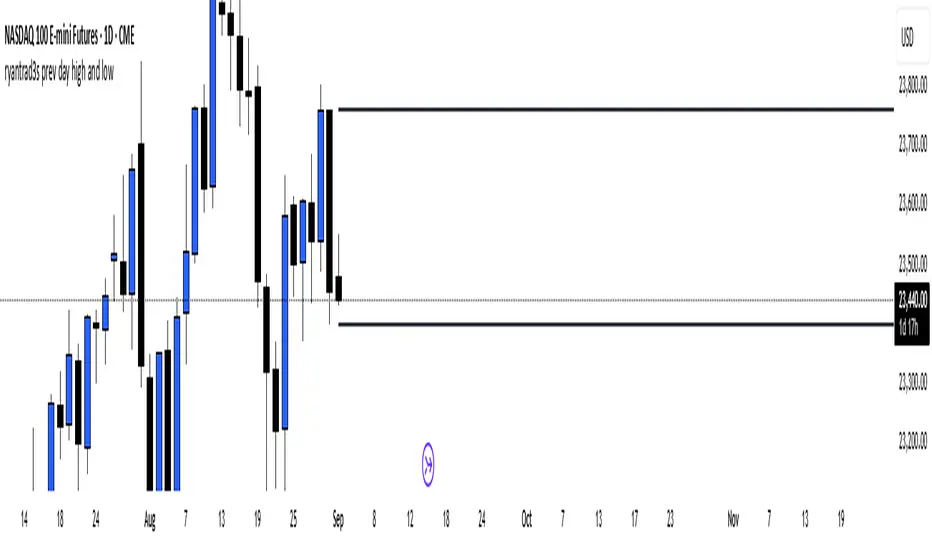
ryantrad3s prev day high and lowThis indicator can help you find the Daily high and low a lot faster than what it usually does, having this indicator equipped will make it a lot more convenient for any trader that uses anything to do with Daily highs and lows. Hope this helps.
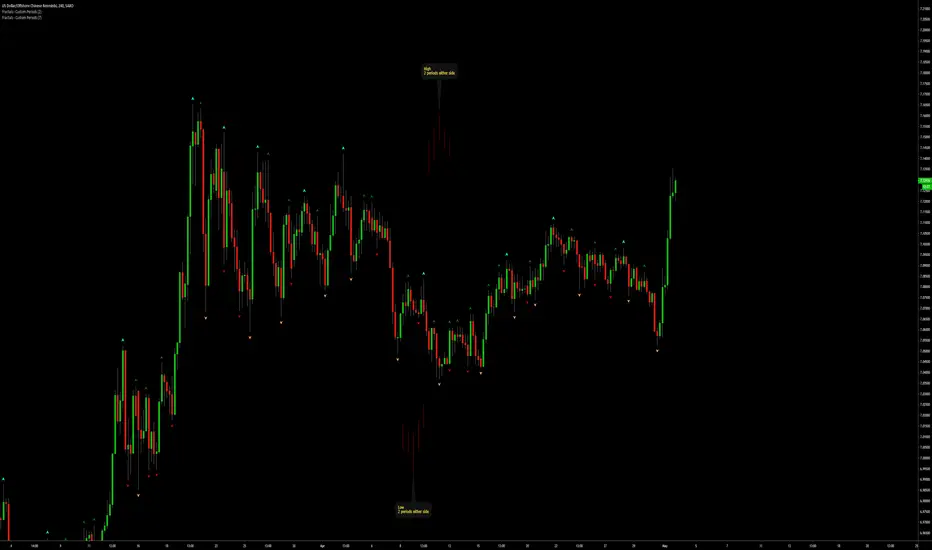
New Highs - MarkerDescription:
This indicator highlights every bar that sets a new high or matches the previous high.
New Highs (ATH or Lookback Highs) are marked with a green triangle above the candle.
Equal Highs (ties) are marked with an orange triangle above the candle.
You can choose between All-Time Highs (lookback = 0) or rolling lookback highs over a user-defined number of bars.
Alerts are included for both new highs and equal highs.
Use this tool to quickly spot breakouts or double-top style patterns as they form.
Essa - Market Structure Crystal Ball SystemEssa - Market Structure Crystal Ball V2.0
Ever wished you had a glimpse into the market's next move? Stop guessing and start anticipating with the Market Structure Crystal Ball!
This isn't just another indicator that tells you what has happened. This is a comprehensive analysis tool that learns from historical price action to forecast the most probable future structure. It combines advanced pattern recognition with essential trading concepts to give you a unique analytical edge.
Key Features
The Predictive Engine (The Crystal Ball)
This is the core of the indicator. It doesn't just identify market structure; it predicts it.
Know the Odds: Get a real-time probability score (%) for the next structural point: Higher High (HH), Higher Low (HL), Lower Low (LL), or Lower High (LH).
Advanced Analysis: The engine considers the pattern sequence, the speed (velocity) of the move, and its size to find the most accurate historical matches.
Dynamic Learning: The indicator constantly updates its analysis as new price data comes in.
The All-in-One Dashboard
Your command center for at-a-glance information. No need to clutter your screen!
Market Phase: Instantly know if the market is in a "🚀 Strong Uptrend," "📉 Steady Downtrend," or "↔️ Consolidation."
Live Probabilities: See the updated forecasts for HH, HL, LL, and LH in a clean, easy-to-read format.
Confidence Level: The dashboard tells you how confident the algorithm is in its current prediction (Low, Medium, or High).
🎯 Dynamic Prediction Zones
Turn probabilities into actionable price areas.
Visual Targets: Based on the highest probability outcome, the indicator draws a target zone on your chart where the next structure point is likely to form.
Context-Aware: These zones are calculated using recent volatility and average swing sizes, making them adaptive to the current market conditions.
🔍 Fair Value Gap (FVG) Detector
Automatically identify and track key price imbalances.
Price Magnets: FVGs are automatically detected and drawn, acting as potential targets for price.
Smart Tracking: The indicator tracks the status of each FVG (Fresh, Partially Filled, or Filled) and uses this data to refine its predictions.
🌍 Trading Session Analysis
Never lose track of key session levels again.
Visualize Sessions: See the Asia, London, and New York sessions highlighted with colored backgrounds.
Key Levels: Automatically plots the high and low of each session, which are often critical support and resistance levels.
Breakout Alerts: Get notified when price breaks a session high or low.
📈 Multi-Timeframe (MTF) Context
Understand the bigger picture by integrating higher timeframe analysis directly onto your chart.
BOS & MSS: Automatically identifies Breaks of Structure (trend continuation) and Market Structure Shifts (potential reversals) from up to two higher timeframes.
Trade with the Trend: Align your intraday trades with the dominant trend for higher probability setups.
⚙️ How It Works in Simple Terms
1️⃣ It Learns: The indicator first identifies all the past swing points (HH, HL, LL, LH) and analyzes their characteristics (speed, size, etc.).
2️⃣ It Finds a Match: It looks at the most recent price action and searches through hundreds of historical bars to find moments that were almost identical.
3️⃣ It Analyzes the Outcome: It checks what happened next in those similar historical scenarios.
4️⃣ It Predicts: Based on that historical data, it calculates the probability of each potential outcome and presents it to you.
🚀 How to Use This Indicator in Your Trading
Confirmation Tool: Use a high probability score (e.g., >60% for a HH) to confirm your own bullish analysis before entering a trade.
Finding High-Probability Zones: Use the Prediction Zones as potential areas to take profit, or as reversal zones to watch for entries in the opposite direction.
Gauging Market Sentiment: Check the "Market Phase" on the dashboard. Avoid forcing trades when the indicator shows "😴 Low Volatility."
Confluence is Key: This indicator is incredibly powerful when combined with your existing strategy. Use it alongside supply/demand zones, moving averages, or RSI for ultimate confirmation.
We hope this tool gives you a powerful new perspective on the market. Dive into the settings to customize it to your liking!
If you find this indicator helpful, please give it a Boost 👍 and leave a comment with your feedback below! Happy trading!
Disclaimer: All predictions are probabilistic and based on historical data. Past performance is not indicative of future results. Always use proper risk management.

Essa's Sessions IndicatorOverview
This powerful tool is designed to visually map out the key trading sessions: Asia, London, and New York directly on your chart. By highlighting these periods and plotting their respective highs and lows, it helps you identify critical price levels, gauge market sentiment, and pinpoint potential breakout opportunities with ease.
What It Does
Visualizes Key Trading Sessions: Automatically draws colored backgrounds for the Asia, London, and New York sessions to show you exactly when the most important market activity is happening.
Plots Session Highs & Lows: Displays precise horizontal lines for the highest and lowest prices reached during each session, acting as key support and resistance levels.
Dual Timezone Mode: Easily switch between London (GMT/BST) and New York (EST/EDT) timezones with a single click. The indicator automatically adjusts all session times for you, ensuring accuracy no matter where you are.
Interactive & Informative Labels: Hover over any session high or low label to see a detailed tooltip containing:
The exact price level.
The session's price range (calculated in pips or points).
The total daily price range for broader context.
A simple volatility gauge (from "Low Vol 😴" to "High Vol 🔥").
Customizable Alerts: Enable breakout alerts to receive instant notifications the moment the price closes above a session high or below a session low.
Simple, powerful, and highly informative, this indicator is an essential tool for traders looking to build strategies around session-based price action.

Swing Highs and Lows between two InstrumentsThis Indicator will show you common Swing Points between two different trading symbols.
You can also use it to display the Swing Points of the current symbol or another symbol only.
When applying the Indicator to your chart it will ask you to put in a symbol. This symbol is used to find common Swing Points against the symbol that you have on your screen. Should you decide not to choose any symbol the indicator will instead mark all Swing Points for the current symbol.
Settings
Symbol: Choose any symbol that you want to compare to the selected symbol on your screen.
Sensitivity: The sensitivity defines how many candles left and right of a Swing Point have to be below (Swing High) or above (Swing Low) in order for the Indicator to mark it. A lower sensitivity will give a lot more Swing points, whereas a higher sensitivity will show less, but more important Swing Points.
Equal Highs Permissible: When calculating where a Swing Point is you can decide how you want equal highs and equal lows to be handled. The default is set to "yes" which means equal highs will be counted as if they were below (Swing High) or above (Swing Low). Choosing "no" will alter the indicators behaviour and only mark a Swing Point if all values within the sensitivity are below (Swing High) or above (Swing Low). As equal highs/lows are not below/above the Swing Point, but at the same level it will not mark the Swing Point.
Options:
You can choose to display Swing Highs and Lows for each symbol individually as well as Common Swing Points, which is the default. If you choose to display different Swing Points at the same time the visual order of importance is the following: common Swing Points > current symbol Swing Points > second symbol Swing Points.
You can also change the symbols and colors that mark the Swing Points or restrict the timeframes that the Indicator works on.

Electronic Trading Hours Session/CandlesThis indicator visually distinguishes the electronic trading session, spanning from the prior day's close (e.g., 5:00 PM EST) through the overnight period until the next day's opening bell (e.g., 9:30 AM EST).
It can be customized to highlight this period with a shaded zone or colored candles depending on the trader’s preference.
The overnight levels that create the opening range gap often act as critical zones of liquidity.
The indicator provides a clear visual cue of potential price magnets that smart money (institutional traders) may target during the opening bell session to trigger liquidity sweeps.

highs&lowsone of my first strategy: highs&lows
This strategy takes the highest high and the lowest low of a specified timeframe and specified bar count.
It will then takes the average between these two extremes to create a center line.
This creates a range of high middle and low.
Then the strategy takes the current market movement
which is the direct average(no specified timeframe and specified bar count) of the current high and low.
Using this "current market movement" within the range of high middle and low it determins when to buy and then sell the asset.
*********note***************
-this strategy is (bullish)
-works good with most futures assets that have volatility/ decent movement
(might add more details if I forget any)
(work in progress)

Essa's Indicator 2.0Essa's Indicator V2: Beginner's Guide
This custom TradingView indicator has been designed to help you identify key trading opportunities based on session highs/lows, volatility, and moving averages. Below is a breakdown of the main features:
1. Exponential Moving Averages (EMAs)
Fast EMA (Blue Line): Tracks the short-term market trend (default: 9-period EMA).
Slow EMA (Red Line): Tracks the longer-term market trend (default: 21-period EMA).
You can turn on/off the EMAs using the "Show EMAs" option in the settings.
EMAs help smooth out price action and give a clearer picture of trends. A crossover of the fast EMA above the slow EMA can signal an upward trend, while the reverse may indicate a downward trend.
2. Session Highs and Lows
The indicator tracks price highs and lows for three major trading sessions:
London Session (Red): Highlighted in red. Active between 08:00 and 17:00 (LDN timezone) or 03:00 and 12:00 (NY timezone).
New York Session (Blue): Highlighted in blue. Active between 12:00 and 21:00 (LDN timezone) or 07:00 and 16:00 (NY timezone).
Asia Session (Yellow): Highlighted in yellow. Active between 22:00 and 08:00 (LDN timezone) or 18:00 and 03:00 (NY timezone).
Highs and lows for each session are plotted on the chart as lines. Breakouts from these levels can signal important trading opportunities:
London High/Low: Red lines.
New York High/Low: Blue lines.
Asia High/Low: Yellow lines.
The background color also changes depending on the active session:
London: Light red background.
New York: Light blue background.
Asia: Light yellow background.
3. Breakout Alerts
You can set alerts when the price breaks above or below session highs/lows:
Break Above London High: Alert triggered when the price crosses the London session high.
Break Below London Low: Alert triggered when the price falls below the London session low.
Similar alerts exist for the New York and Asia sessions as well.
4. Volatility-Adjusted EMA
The EMAs in this indicator are adjusted based on volatility (ATR - Average True Range). This allows the EMAs to respond to market conditions more dynamically, giving you more accurate trend readings in volatile markets.
5. ZigZag Feature (Optional)
You can enable the ZigZag feature to help visualize the price action's highs and lows:
ZigZag Lines: Highlight major peaks and troughs in price movements, helping you spot trends more easily.
This is helpful for identifying reversals or trend continuations.
6. Fractal Markers
This indicator uses fractals to mark potential turning points in the market:
Green Triangles (Above the Price): Indicate up fractals (potential reversal points where the price could move upwards).
Red Triangles (Below the Price): Indicate down fractals (potential reversal points where the price could move downwards).
Fractals can be a helpful confirmation tool when identifying entry and exit points.
7. Custom Timezone Options
You can choose between London (LDN) and New York (NY) timezones in the settings to adapt the session times to your trading location. This ensures the session high/low markers are displayed correctly for your trading region.
By default, the New York (NY) timezone is enabled for FXCM charts in the UK.
For BTC charts, you will need to switch to the appropriate time zone manually.
Thanks
Essa

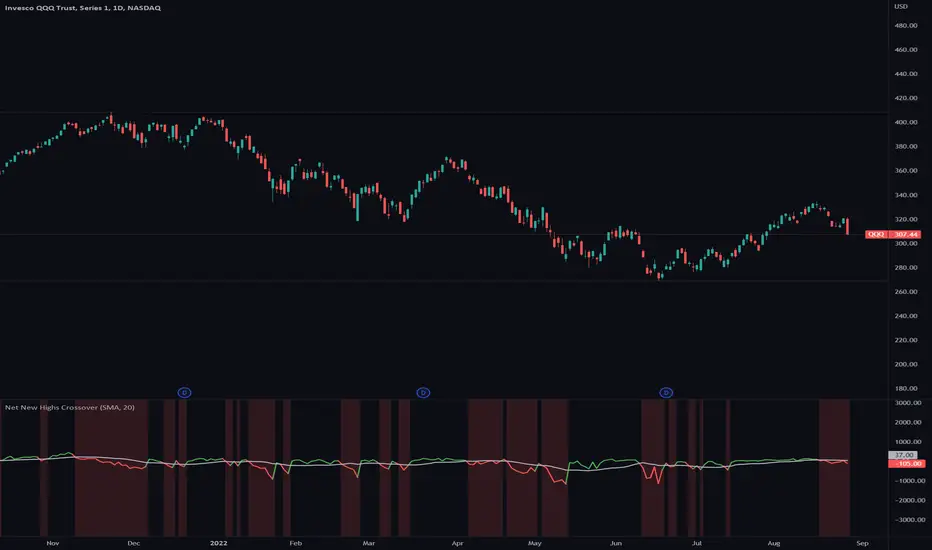
Net New Highs CrossoverA lot of traders have a hard time to get in and out of the market at the right time.
Net New Highs of stocks can guide you to increase or decrease your exposure based on the current market health.
They are calculated by subtracting the new highs of the new lows, based on all stocks of the NYSE, NASDAQ and AMEX.
+ A positive value shows that the market is doing good, since more stocks are making new highs compared to new lows.
- A negative value shows that the market is doing bad, since more stocks are making new lows compared to new highs.
Combined with a moving average you can see crossovers that can warn you early when there is a change in the current market health.
Features
■ You can select different Net New High indices or combine them (NYSE, NASDAQ and AMEX)
■ You can specify a moving average line ( SMA / EMA and length)
■ Use single color or two colors for the moving average line to better spot the crossovers
Hints
*New highs and new lows index values currently only get updated at the end of the day
*Only works on daily timeframe
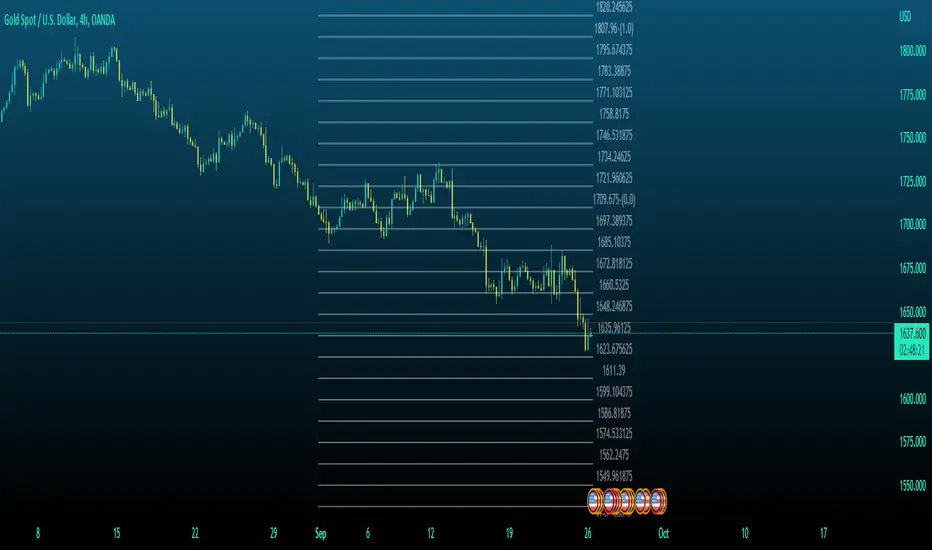
MTF High and Low FractionsMTF High and Low Fractions
Description
An experimental script that prints 1/3, 1/4 and 1/8 levels of the previous timeframe's high and low to the current timeframe. The idea is quite simple. It mirrors the the previous high and low with user selected levels. The default setting is the previous daily high and low but can be customized on user discretion.
New levels are printed after the close of the previous timeframe and open of the new timeframe (user's timeframe setting).
How To Use
Levels should not be used blindly. Levels can be used as confluence when aligned with high probability supply and demand zones, support, resistance, order blocks, and so on.
Number of New Highs - Number of New Lows in US MarketShow numbers of new highs vs numbers of new lows for Nasdaq, NYSE and AMEA

[TTI] Net New Highs / Lows––––History & Credit
There are multiple methodologies that use Net New Highs for the NASDAQ or NYSE as a market direction indicator. Recently, I saw Matt Caruso to also apply such methodology, so I decided to code this indicator.
–––––What it does
👉 Plots a Net Change histogram. This shows New Highs - New Lows, if the histogram is above 0 this means there are more highs than lows
👉 Plots Background colouring. This is dependant on the sensitivity setting of the indicator. We would require a few days of downward action before concluding a downward action. Sensitivity can be adjusted in the menu
👉 Bot the Histogram and the Background colouring can be turned on and off (as per screenshot example)
–––––How to use it
You can use it to validate if the market conditions are ripe for entering a trade. For instance if you trade long, you would want to confirm with the indicator that general market is facilitating moves to the upside. IBD have mentioned more than once that a stock move is 50% due to the general market move.

MTF Market Structure Highs and LowsThe indicator marks the last fractal highs and lows (W,D,4H and 1H options) to help determine current market structure. The script was created to help with directional bias but also as a MTF visual aid for stop hunts/liquidity raids.
Liquidity areas are where we assume trader's stop losses would be when buying or selling. Liquidity lies above and below swing points and institutions need liquidity to fill large orders.
Monitor price action as it hits these areas for a potential reversal trade.

Michigandolf's 30min Opening RangeThis script plots the 30min Opening Range as well as the previous day's high & low.
Description:
Blue Line = Top of the 30min Opening Range for the session
Pink Line = Bottom of the 30min Opening Range for the session
White Line = Mid-Point of the 30min Opening Range for the session
White Transparent Area = The full range of the 30min Opening Range
Green Line = Yesterday's High for the session
Red Line = Yesterday's Low for the session
Use:
The Opening Range will continue to expand until the first 30minutes of trading has passed, at which point the range will lock in place for the remainder of the trading session. Many traders use these important levels to gauge trade entries and exits (e.g. Mark Fisher's ACD strategy).
This script does not work currently work for futures (e.g. ES, NQ, RTY) due to the session start time. Will configure for futures trading in a future update.

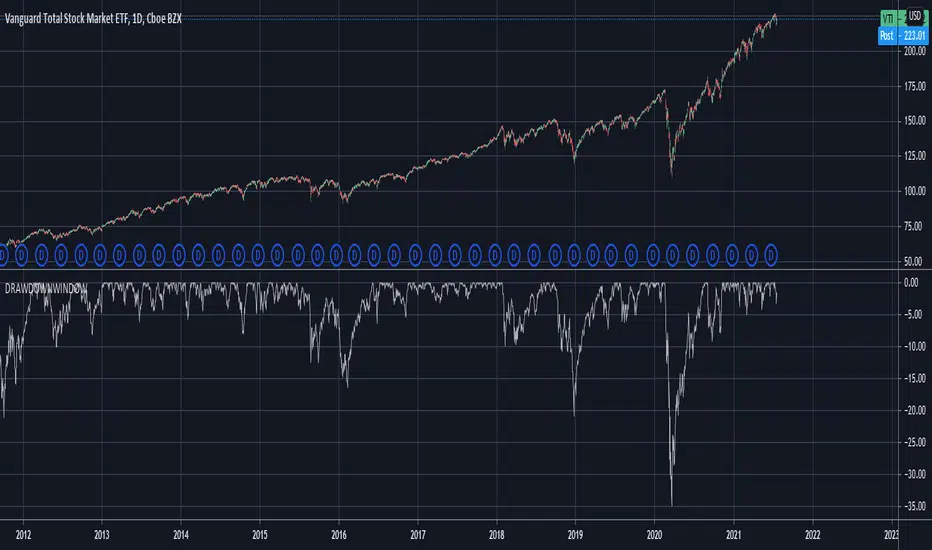
Drawdown over Window (in percentage)Unlike other scripts, which compare against the all time high, this allows you to specify the window over which the high should be searched.
If you want to compare against the all time high, just choose a long enough window.
Swing Failure Pattern Inquisitor SFP Inquisitor
v0.2a
coded by Bogdan Vaida
Code for Swing High, Swing Low and Swing Failure Pattern.
Note that we're still in the alpha version, bugs may appear.
Note that the number you set in your Swing History variable
will also be the minimum delay you see until the apples appear.
This is because we're checking the forward "history" too.
The SFP will only check for these conditions:
- high above Swing History high and close below it
- low below Swing History high and close above it
In some cases you may see an apple before the SFP that "doesn't fit"
with the SFP conditions. That's because that apple was drawn later and
the SFP actually appeared because of the previous apple .
20 candles later.
Legend:
🍏 - swing high
🍎 - swing low
🧺 - candle where the last swing was driven from
🍌 - swing failure pattern
🍎🍌 - hungry scenario: swing low but also a SFP compared to the last swing

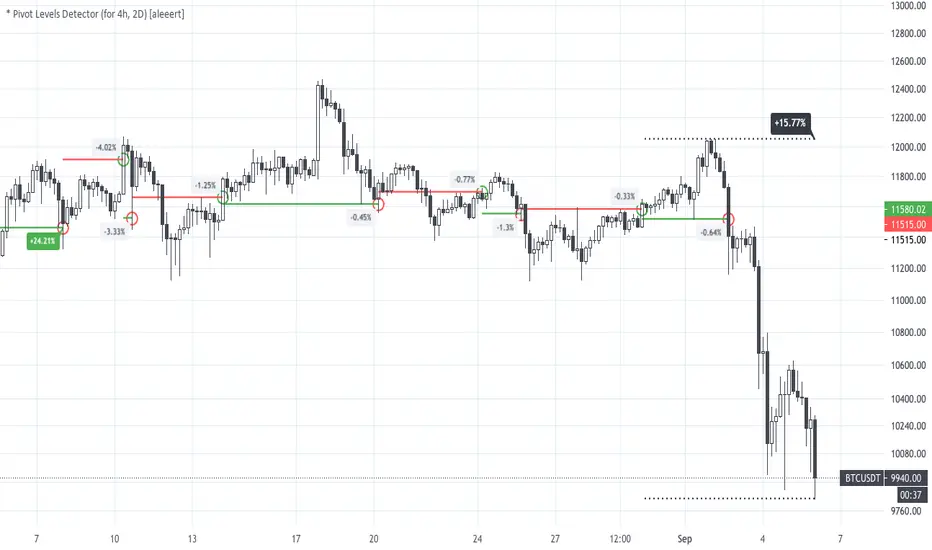
* Pivot Levels Detector (for H4, D2) [aleeert]Pivot Levels Detector is the script based on idea about breakouts of pivot levels which based on certain numbers of bars used for reaching the target and breakout the level. Working timeframes are H4 and 2D . The script works better with BTCUSD, ETHUSD, EOSBTC, AAPL, TSLA.
No repainting!
The script doesn't use any moving averages or other relative methods which cancel or change data on previous bars. Once the signal is showed it will stay forever.
NOTE: The results from Strategy Tester could slight vary from results you see on the chart. It's because of calculation method used on Strategy Tester, which uses a data from closed bars only, not by target reaching. So the results you see on the chart are more correct.
Follow me for receiving more scripts and indicators.
Regards,
aleeert
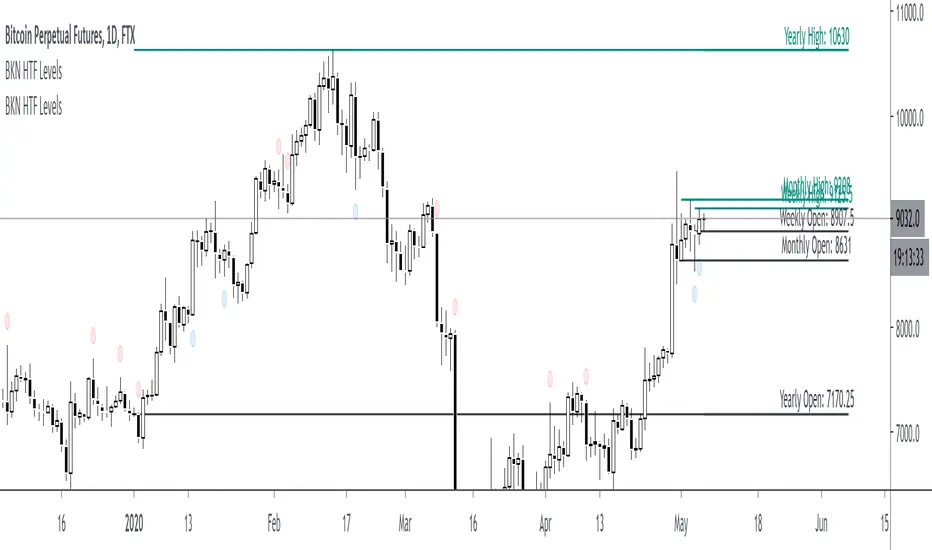
BKN High Timeframe LevelsThis indicator is developed to mark out yearly, monthly, weekly and daily levels. Allows you to select if you want to plot the open, high or low. Don't really recommend using the indicator for closes as it looks ahead to the current bar so it will just show the current price as the close.
High timeframe opens specifically are great levels to watch for reactions. By request, we've added the ability to plot highs or lows in addition to the opens. If you'd like to see opens as well as highs or lows, you would add the indicator to your chart twice and you have the option to change the color of the lines on the secondary indicator.
Fractals | Swing Points | Highs & Lows | Custom PeriodsSimple script which marks out key swing highs & lows.
One of the only indicators I have on the chart most days
- perfect for naked charting
- quickly helps you to visually identify key areas of interest
An extension of Bill Williams fractals
- aka short term swing points
Allows you to filter for only the most prominent swing points
- you can even overlay multiple swingpoint filters in different colours (as per example chart)
The number (Fractal Periods) is simply:
- the number of less prominent points either side of your swing high/low
- example shown on the chart
Otherwise make a fist
- look at your 5 knuckles
- swing high is your middle knuckle
- 2 lower points either side
Bill Williams Original Fractal:
Fractal Periods = 2
Your Fractal Period for Filtering:
3, 4, 5, 30, 365, etc
Simple, easy, shared to enjoy =)
Highs & Lows of Last [x] Bars===========
Highs & Lows of Last Bars
===========
We have found this indicator invaluable over the past few years - whether you prefer to trade Crypto, Forex, Commodities or something else this indicator could prove really useful. It's always nice to know the highs and lows of the last Week or Month, the problem being the information is only really relevant at the start or end of that chosen time period; throughout the mid-section of that time period the chart will either be displaying irrelevant information or info that has been/is being re-painted. Not good!
Our Highs & Lows of Last Bars Indicator will remove this re-painting problem and display up-to-date information from higher time frames without compromising the integrity of your current chart period.
-----------
Most high & low finder indicators will use, (for example), a 'W' or 'M' as their higher TF to get HTF results - we do things just a little bit differently, it's like this:
Most other High/Low Indicators:
~ MON 1st (get high/low value from 'W' TF) ~
~ MON 8th (get new data and plot from 'W' TF)
etc. - This leads to gaps in the data, re-painting and missing lots of potential mid-week trades.
Our High & Low of Last Bars:
~ MON 1st (get high/low value from LAST 7 DAYS) ~
~ TUE 2nd (get high/low value from LAST 7 DAYS) ~
etc.
This provides a much smoother High/Low plot with more relevant information. You can clearly see areas of support and resistance, updated on the LTF chart using data from a HTF.
Because we've included 2 TF's you can use simultaneously you can see when the lower TF touches the Higher TF this (generally, but not always!) means there's a breakout coming!
Hope this is useful to you guys!
Good Luck and Happy Trading!
