The Essa System V1.5The Essa System V1.5
Overview
The Essa System is a comprehensive trading strategy and backtesting tool designed for traders who use market structure and Fibonacci retracements. It automatically identifies significant trading ranges, calculates key retracement levels, and then backtests a complete trading strategy based on entries at these levels.
This is more than just an indicator; it's a full suite of analytical tools designed to help you develop, test, and analyze a complete trading plan directly on your chart.
How It Works
The system's logic is based on a classic price action concept:
Range Detection: First, it automatically identifies a significant trading range by finding the highest high and lowest low based on pivot points over a user-defined lookback period.
Fibonacci Analysis: Once the range direction (bullish or bearish) is established, the script calculates and displays key Fibonacci retracement levels (50%, 61.8%, 70.5%, and 78.6%).
Trade Execution: The system then looks for historical and live trading opportunities, entering a trade when the price pulls back to one of the enabled Fibonacci levels. All trades are managed with a predefined Stop Loss and Take Profit in pips.
Key Features
Automatic Range & Fibonacci Analysis: Automatically draws the primary trading range and key Fib levels, updating as market structure evolves.
Historical Backtesting: Plots all historical trade entries based on the strategy rules, allowing for a complete performance review over the chosen chart history.
Detailed Trade Visuals: Displays active trades on the chart with clear lines and boxes for entry, stop loss, and take profit zones.
Advanced Session Filtering: Allows you to isolate trades to specific market sessions (London, New York, Asia) with timezone support and daily trade limits.
Built-in Risk Management: A cornerstone of the system. It automatically calculates the required position size for each trade based on your specified Account Size, Risk Percentage, and Stop Loss.
Comprehensive Performance Tables: The script includes two powerful analytical tables:
Trade Helper Table: Shows the status of live or potential upcoming trades, including entry/SL/TP prices and the calculated position size.
History Table: Logs all recent trades and calculates key statistics like Profit Factor, Win Rate, and the overall PnL impact on your account balance.
Customizable Strategy: Fine-tune every aspect of the strategy with inputs for the lookback period, SL/TP in pips, which Fib levels are tradable, and a cooldown timer to prevent over-trading.
How to Use
Add the indicator to your chart.
Navigate to the settings and, under "Account Settings," configure your Account Size and Risk Per Trade (%). This is essential for the PnL and position sizing calculations to be meaningful.
Under "Session Filter Settings," adjust the sessions you wish to trade.
Analyze the historical trades and the performance tables to understand the strategy's behaviour on your chosen asset and timeframe.
Disclaimer: This is a tool for strategy analysis and backtesting. It is not financial advice. Past performance is not indicative of future results. Always use proper risk management.
Highs

Electronic Trading Hours Session/CandlesThis indicator visually distinguishes the electronic trading session, spanning from the prior day's close (e.g., 5:00 PM EST) through the overnight period until the next day's opening bell (e.g., 9:30 AM EST).
It can be customized to highlight this period with a shaded zone or colored candles depending on the trader’s preference.
The overnight levels that create the opening range gap often act as critical zones of liquidity.
The indicator provides a clear visual cue of potential price magnets that smart money (institutional traders) may target during the opening bell session to trigger liquidity sweeps.

highs&lowsone of my first strategy: highs&lows
This strategy takes the highest high and the lowest low of a specified timeframe and specified bar count.
It will then takes the average between these two extremes to create a center line.
This creates a range of high middle and low.
Then the strategy takes the current market movement
which is the direct average(no specified timeframe and specified bar count) of the current high and low.
Using this "current market movement" within the range of high middle and low it determins when to buy and then sell the asset.
*********note***************
-this strategy is (bullish)
-works good with most futures assets that have volatility/ decent movement
(might add more details if I forget any)
(work in progress)

Essa's Indicator 2.0Essa's Indicator V2: Beginner's Guide
This custom TradingView indicator has been designed to help you identify key trading opportunities based on session highs/lows, volatility, and moving averages. Below is a breakdown of the main features:
1. Exponential Moving Averages (EMAs)
Fast EMA (Blue Line): Tracks the short-term market trend (default: 9-period EMA).
Slow EMA (Red Line): Tracks the longer-term market trend (default: 21-period EMA).
You can turn on/off the EMAs using the "Show EMAs" option in the settings.
EMAs help smooth out price action and give a clearer picture of trends. A crossover of the fast EMA above the slow EMA can signal an upward trend, while the reverse may indicate a downward trend.
2. Session Highs and Lows
The indicator tracks price highs and lows for three major trading sessions:
London Session (Red): Highlighted in red. Active between 08:00 and 17:00 (LDN timezone) or 03:00 and 12:00 (NY timezone).
New York Session (Blue): Highlighted in blue. Active between 12:00 and 21:00 (LDN timezone) or 07:00 and 16:00 (NY timezone).
Asia Session (Yellow): Highlighted in yellow. Active between 22:00 and 08:00 (LDN timezone) or 18:00 and 03:00 (NY timezone).
Highs and lows for each session are plotted on the chart as lines. Breakouts from these levels can signal important trading opportunities:
London High/Low: Red lines.
New York High/Low: Blue lines.
Asia High/Low: Yellow lines.
The background color also changes depending on the active session:
London: Light red background.
New York: Light blue background.
Asia: Light yellow background.
3. Breakout Alerts
You can set alerts when the price breaks above or below session highs/lows:
Break Above London High: Alert triggered when the price crosses the London session high.
Break Below London Low: Alert triggered when the price falls below the London session low.
Similar alerts exist for the New York and Asia sessions as well.
4. Volatility-Adjusted EMA
The EMAs in this indicator are adjusted based on volatility (ATR - Average True Range). This allows the EMAs to respond to market conditions more dynamically, giving you more accurate trend readings in volatile markets.
5. ZigZag Feature (Optional)
You can enable the ZigZag feature to help visualize the price action's highs and lows:
ZigZag Lines: Highlight major peaks and troughs in price movements, helping you spot trends more easily.
This is helpful for identifying reversals or trend continuations.
6. Fractal Markers
This indicator uses fractals to mark potential turning points in the market:
Green Triangles (Above the Price): Indicate up fractals (potential reversal points where the price could move upwards).
Red Triangles (Below the Price): Indicate down fractals (potential reversal points where the price could move downwards).
Fractals can be a helpful confirmation tool when identifying entry and exit points.
7. Custom Timezone Options
You can choose between London (LDN) and New York (NY) timezones in the settings to adapt the session times to your trading location. This ensures the session high/low markers are displayed correctly for your trading region.
By default, the New York (NY) timezone is enabled for FXCM charts in the UK.
For BTC charts, you will need to switch to the appropriate time zone manually.
Thanks
Essa

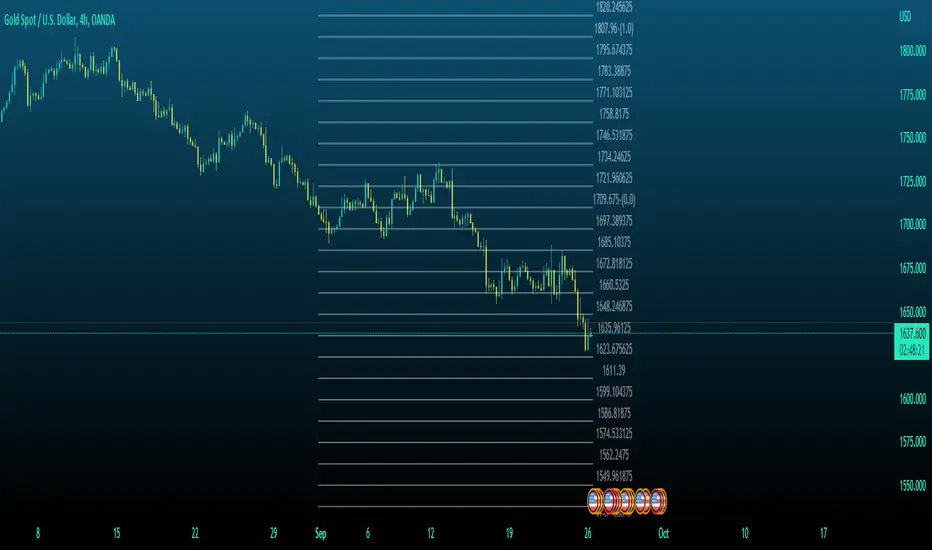
MTF High and Low FractionsMTF High and Low Fractions
Description
An experimental script that prints 1/3, 1/4 and 1/8 levels of the previous timeframe's high and low to the current timeframe. The idea is quite simple. It mirrors the the previous high and low with user selected levels. The default setting is the previous daily high and low but can be customized on user discretion.
New levels are printed after the close of the previous timeframe and open of the new timeframe (user's timeframe setting).
How To Use
Levels should not be used blindly. Levels can be used as confluence when aligned with high probability supply and demand zones, support, resistance, order blocks, and so on.
Number of New Highs - Number of New Lows in US MarketShow numbers of new highs vs numbers of new lows for Nasdaq, NYSE and AMEA

MTF Market Structure Highs and LowsThe indicator marks the last fractal highs and lows (W,D,4H and 1H options) to help determine current market structure. The script was created to help with directional bias but also as a MTF visual aid for stop hunts/liquidity raids.
Liquidity areas are where we assume trader's stop losses would be when buying or selling. Liquidity lies above and below swing points and institutions need liquidity to fill large orders.
Monitor price action as it hits these areas for a potential reversal trade.

Michigandolf's 30min Opening RangeThis script plots the 30min Opening Range as well as the previous day's high & low.
Description:
Blue Line = Top of the 30min Opening Range for the session
Pink Line = Bottom of the 30min Opening Range for the session
White Line = Mid-Point of the 30min Opening Range for the session
White Transparent Area = The full range of the 30min Opening Range
Green Line = Yesterday's High for the session
Red Line = Yesterday's Low for the session
Use:
The Opening Range will continue to expand until the first 30minutes of trading has passed, at which point the range will lock in place for the remainder of the trading session. Many traders use these important levels to gauge trade entries and exits (e.g. Mark Fisher's ACD strategy).
This script does not work currently work for futures (e.g. ES, NQ, RTY) due to the session start time. Will configure for futures trading in a future update.

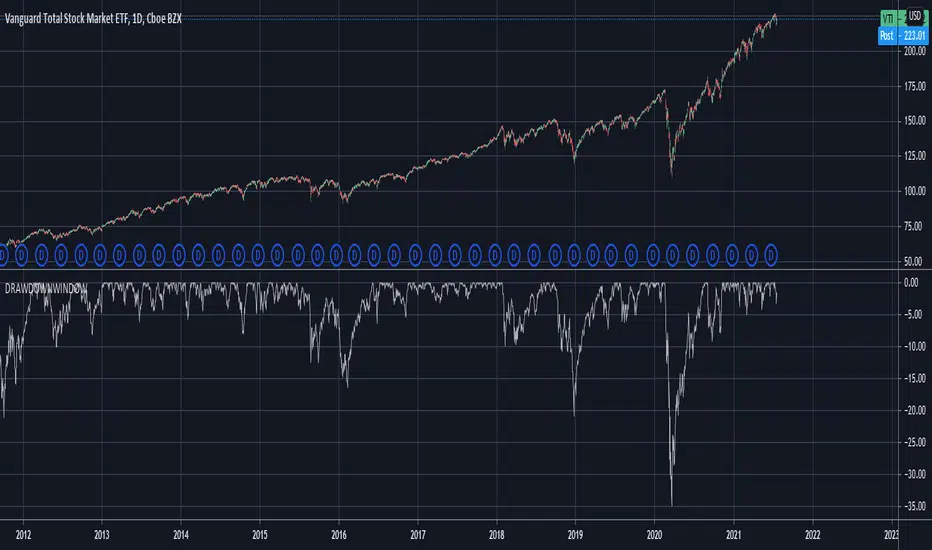
Drawdown over Window (in percentage)Unlike other scripts, which compare against the all time high, this allows you to specify the window over which the high should be searched.
If you want to compare against the all time high, just choose a long enough window.
Swing Failure Pattern Inquisitor SFP Inquisitor
v0.2a
coded by Bogdan Vaida
Code for Swing High, Swing Low and Swing Failure Pattern.
Note that we're still in the alpha version, bugs may appear.
Note that the number you set in your Swing History variable
will also be the minimum delay you see until the apples appear.
This is because we're checking the forward "history" too.
The SFP will only check for these conditions:
- high above Swing History high and close below it
- low below Swing History high and close above it
In some cases you may see an apple before the SFP that "doesn't fit"
with the SFP conditions. That's because that apple was drawn later and
the SFP actually appeared because of the previous apple .
20 candles later.
Legend:
🍏 - swing high
🍎 - swing low
🧺 - candle where the last swing was driven from
🍌 - swing failure pattern
🍎🍌 - hungry scenario: swing low but also a SFP compared to the last swing

Previous Day Week Highs & LowsThis script plots the previous n day and week highs and lows (previous two days and previous week by default).
Here are some additional info about the script behavior:
Plots highs and/or lows
Plots for days and/or weeks
Day highs and lows are shown only on intraday timeframes
Week highs and lows are shown only on timeframes < weekly
[RD] high / low lines pv4 v1==================================================================
July 7 2019 - high / low lines pv4 v1 - by RootDuk
==================================================================
Easy script to draw some lines on the input variable barsback.
You can extend the lines on the sides: left, right, both or none.
With the show variables (bools) you can show or hide the lines
Lines: high to high, low to low, high to low or low to high
Easy way to find support / resistance based on the past with
extended lines. Cheers and enjoy
===================================================================
Notes
===================================================================
Hope TV (pinescript) will get color inputs for line or a type color so we can
easily create inputs for colors for lines. Now its static. If someone knows
another way, pls let me know, i'll integrate it
===================================================================
Updates
===================================================================
Non so far v1

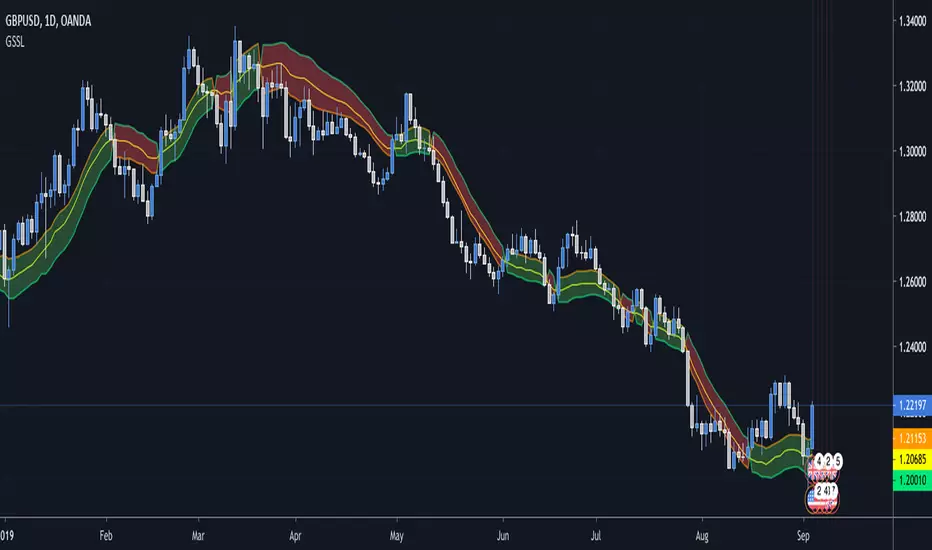
Generalized SSL by Vts// Generalized SSL:
// This is the very first time the SSL indicator, whose acronym I ignore, is on Tradingview.
// It is based on moving averages of the highs and lows.
// Similar channel indicators can be found, whereas
// this one implements the persistency inside the channel, which is rather tricky.
// The green line is the base line which decides entries and exits, possibly with trailing stops.
// With respect to the original version, here one can play with different moving averages.
// The default settings are (10,SMA)
//
// Vitelot/Yanez/Vts March 2019
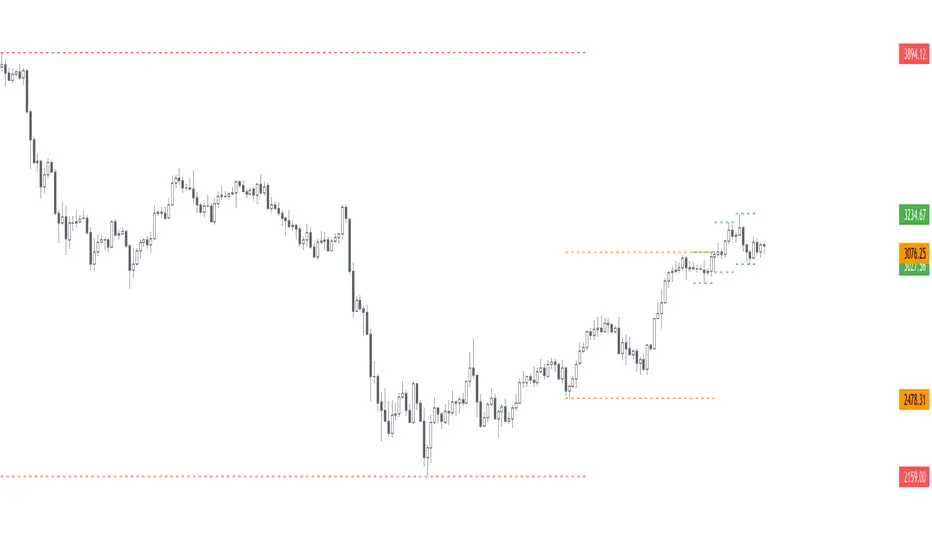
TradingCryptoCourse Support/ resistance BreakoutThis indicator looks for breakouts above and below the latest highs and lows.

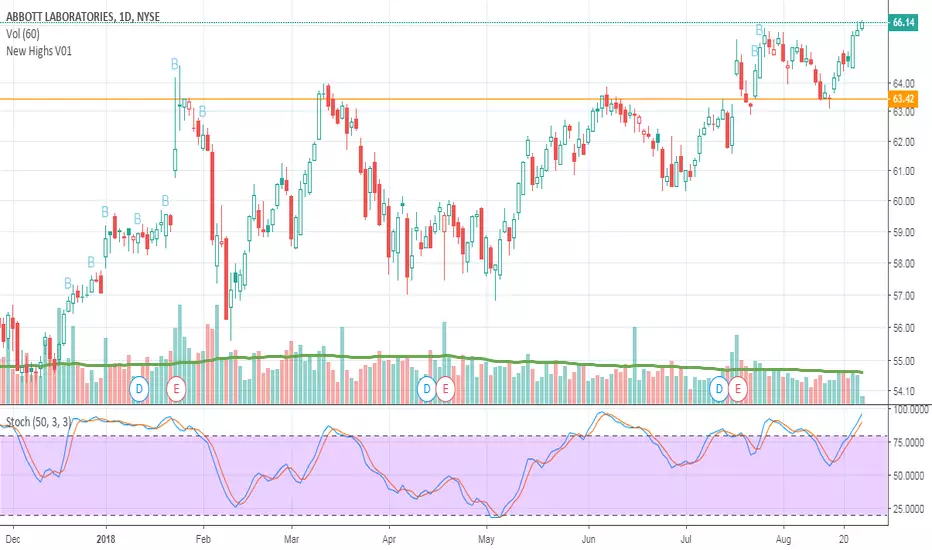
New Highs V01Script is meant for finding stocks in new uptrends and has had a pullback. Looking for support confirmation before going long. My first script.
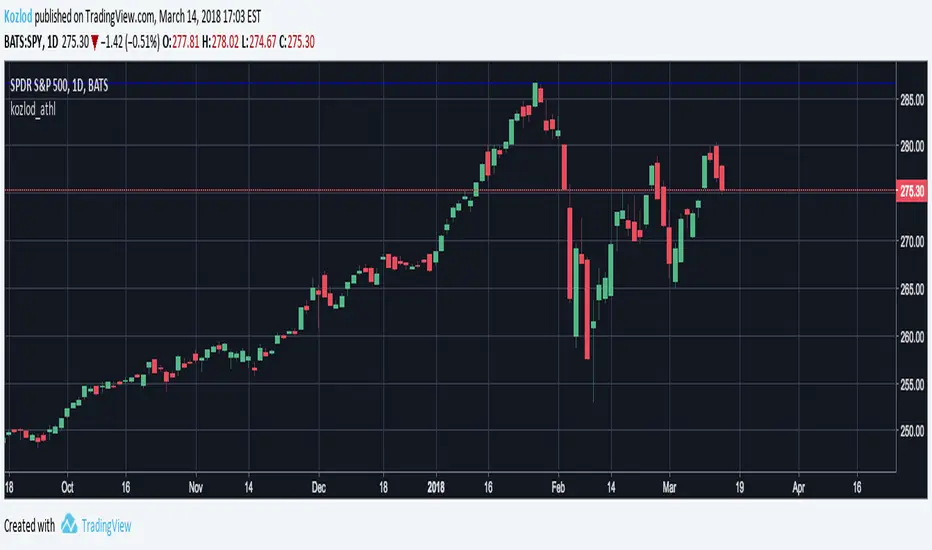
Kozlod - All-time high/low alertsA small script to track all-time high/low levels.
You can create alerts when levels will be updated.
52 Week High/Low52 Week High / Low Indicator
A simple, unobtrusive indicator that can be used on any timeframe to display the 52 week high/low values.
Features
Works on any timeframe.
Unobtrusive: Simple horizontal lines showing only the current 52 week values.
Allows the user to select whether to calculate the 52-week values from candle close values or the respective highs/lows.
For full overview and code commentary - Visit the backtest-rookies website.

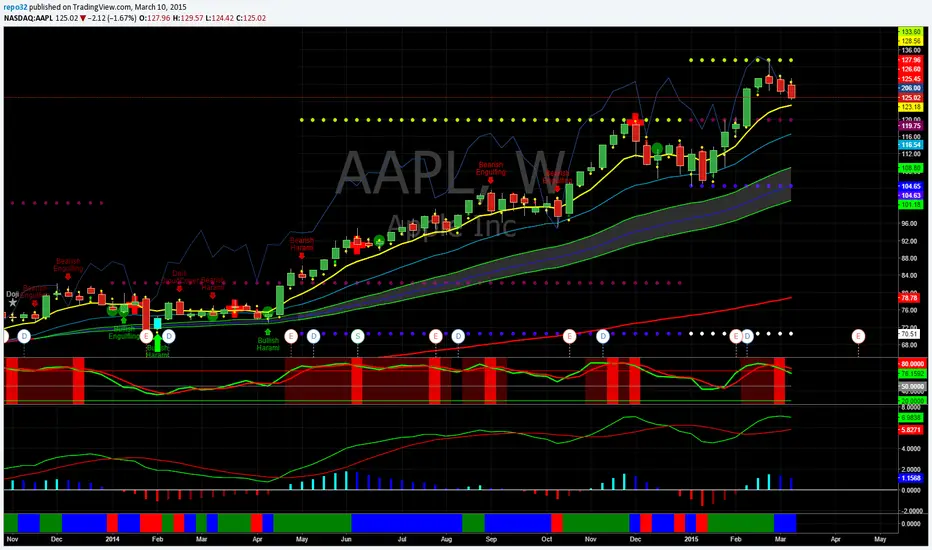
MA ExtensionThis indicator measures the vertical distance form the current close to the MA of your choice. I find that it does not work best as an oscillator, but it works well for providing early signals for taking profits when trend continuating. For example, if you go short due to a retracement to the MA (of your choice) take profits when a bearish trendline is broken (signalling the start of a bullish correction) that corresponds to the highs of the chart. The logic behind this indicator is that the breakouts of trendlines of an assets difference from an MA will precede corresponding breakouts of trendlines drawn on raw price. Kind of like Momentum, except it takes trend into account. Momentum has the same leading feature when it comes to drawing trendlines , but trendlines will be harder to draw due to the Momentum indicators oscillatory behavior.
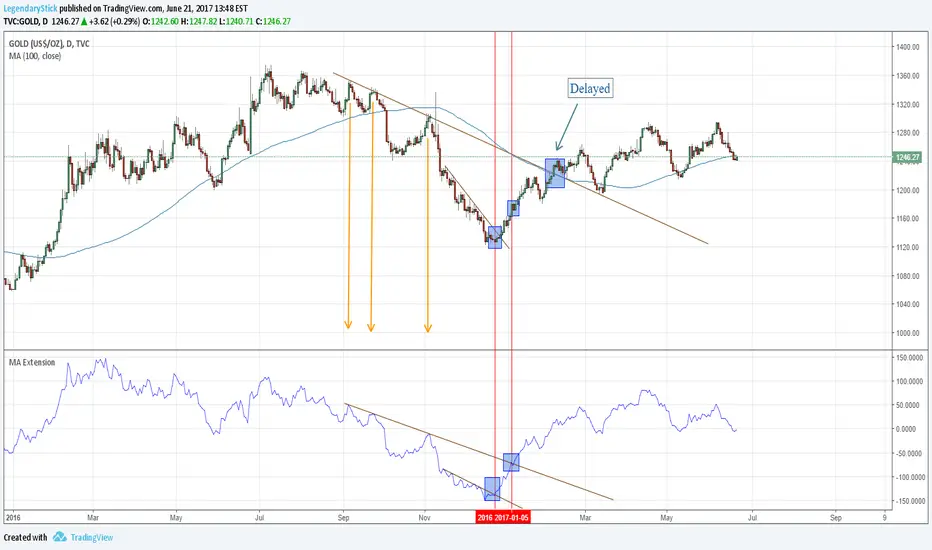
MA ExtensionThis indicator measures the vertical distance form the current close to the MA of your choice. I find that it does not work best as an oscillator, but it works well for providing early signals for taking profits when trend continuating. For example, if you go short due to a retracement to the MA (of your choice) take profits when a bearish trendline is broken (signalling the start of a bullish correction) that corresponds to the highs of the chart. The logic behind this indicator is that the breakouts of trendlines of an assets difference from an MA will precede corresponding breakouts of trendlines drawn on raw price. Kind of like Momentum, except it takes trend into account. Momentum has the same leading feature when it comes to drawing trendlines , but trendlines will be harder to draw due to the Momentum indicators oscillatory behavior.

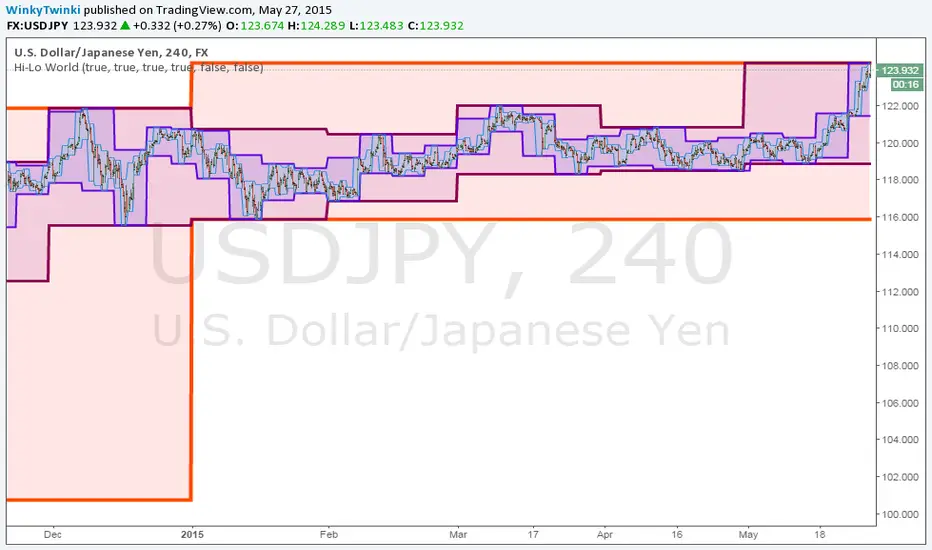
Hi-Lo WorldThis script plots the highs/lows from multiple timeframes onto the same chart to help you spot the prevailing long-term, medium-term and short-term trends .
List of timeframes included:
Year
Month
Week
Day
4 Hour
Hour
You can select which timeframes to plot by editing the inputs on the Format Object dialog.
High Low YearlySorry for the mess above. Not sure how to remove it. It was not what I was looking to post. I added the the clean chart below.
This was requested by "N". It displays the current yearly highs and lows along with the previous years highs and lows. Just a nice way to see the support resistance in all time frames.