Smart Indicator 28 - Swing Pivots (Higher Highs and Lower Lows)A simple way to find Higher Highs and Lower Lows (HH and LL) whit automatic Fibonacci Lines in the most common levels.
In this indicator the Higher Highs only happens when a high value are rising from each other in the last "Length of Real Pivots" highs and the next same number of highs are falling in every single bar.
The Lower Lows are inverted, LL only appears if a low is falling in every single bar in the last number of length and the lows price of the "n" bars next are rising.
You can use this Indicator in any kind of market.
Volatilità storica

Borjas Tarh Explosive PivotsBorjas Tarh Explosive Pivots
This indicator includes:
1. Historical Volatility Percentile ( HVP ) +SMA+EMA
Core Idea (balipour) :
HVP Code Help (semiotic) : www.tradingview.com
For the Detailed Description read the Core (HVP) Idea indicator by "balipour" above.
2. Bollinger Bands Width ( BBW )
It's an Oscillation of BBW So it's trapped between 0 to 100. (And Lightly Smoothed)
3. Volume Oscillator
The Volume is oscillated so it's trapped between 0 and -30. (And Lightly Smoothed)
Below 10 Means the Volume in the context of the Candle Volume is pretty low.
4. The Shapes
These Shapes are based of all factors above.
D ( Blue ) : HVP is pretty Low. An Explosive Move is Coming.
A ( Yellow ) : An Explosive Move is Building Up.
B ( Orange ) : An Explosive Move is Near.
C ( Purple ) : An Explosive Move Will Happen Very Soon.
There is an Alternative Set:
On = Annual HVP and Default BBW .
Off = Fibonacci HVP and BBW .
© mrhashem
© Borjas Tarh Company
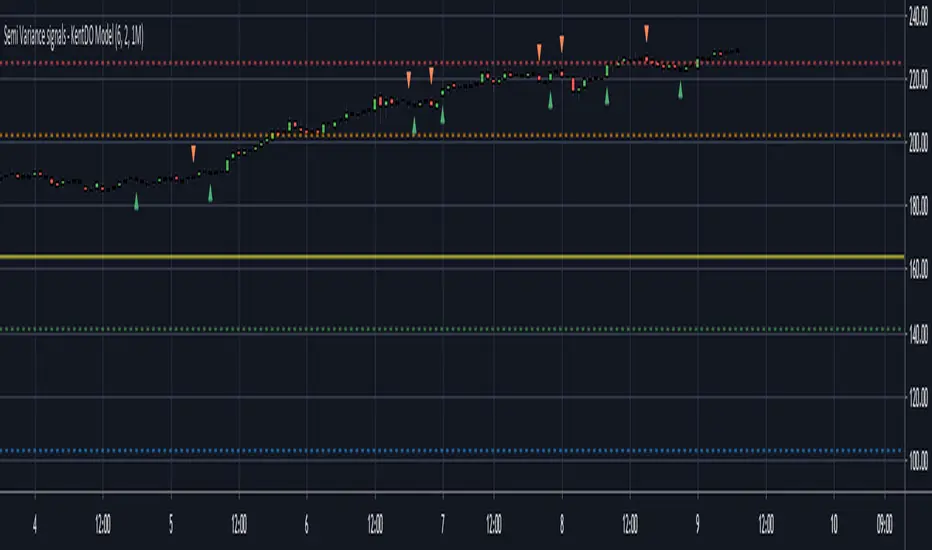
Semi Variance signals - KentDO ModelThe indicator generated by measuring the difference in yield volatility in two directions up and down, is called a Semi-measure of risk. A change in the sign of the difference between two halves of volatility produces a buy and sell signal.
The indicator can customize the number of observations.
The indicator adds reference Pivot Point level points for a larger time frame. Can edit the number of decimals, so suitable for Indices, Curencies, Futures, Crypto, Bonds
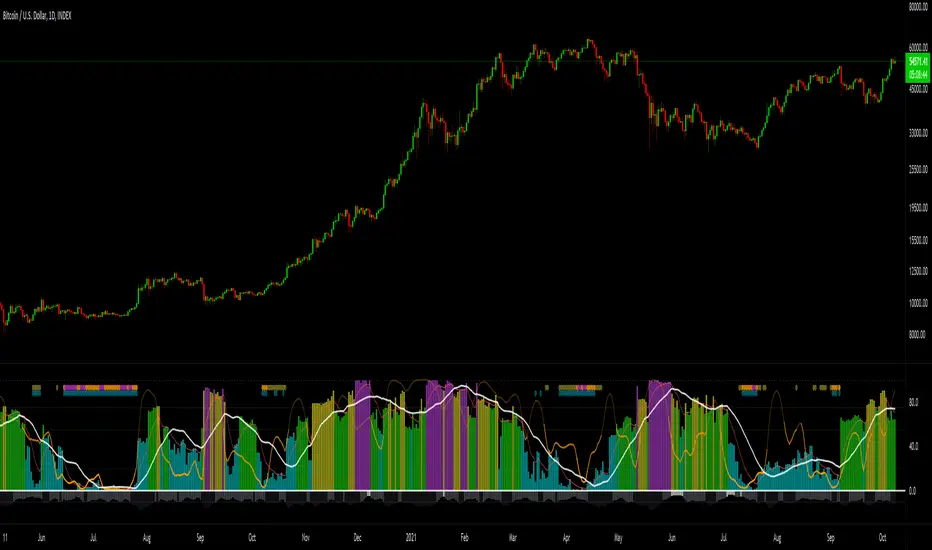
[KICK] Volatility HeatmapWith this indicator you can gauge the price volatility of an instrument across multiple timeframes in a very compact visualization. It allows you to find critically low areas of volatility and predict the likelihood of an imminent move or the conclusion of a move. While you can do this with other indicators, it is often easy to miss low volatility on timeframes that you don't normally survey.
Features:
Measure volatility using either Average True Range Percentile Rank (ATR-PR) or Historical Volatility Percentile (HVP)
Measure volatility from any other source (e.g. Volume, or custom series from another indicator) using HVP
2 Rendering Modes (Smooth and Distinct) as seen in the sample chart above
Ability to show current timeframe Volatility in bar chart above the heatmap
Get alerts when a certain number of timeframe levels (configurable) are showing critically low volatility (implying imminent move)
Get an alert when the current timeframe volatility level emerges from a critically low volatility zone (usually indicating the start of a significant move)
The bands on the map are 1x, 2x, 3x, 5x, 8x, 13x, 21x, and 34x the curent timeframe. The volatility measurements go (from lowest to highest): Lime, Blue, Dark Purple -> Light Purple (gradient), Magenta, Pink. If you see grey blocks/bands, these indicate that the instrument you are using does not have enough historical data to determine the volatility based on your timeframe and reference period. For example, if you are using a reference period of 100 and are on the daily view, to render the bottom-most band (x34) you would need around 3400 days of data (over 9 years).
You can use this indicator in multiple ways. My favorite way personally is to look for areas that have multiple consecutive timeframes showing low volatility warnings and then enter when the highest of those timeframes turns back to purple. Use other methods, analysis, or indicators to determine direction (or just straddle P.A. with market stops). If I am scalping, then I will generally mostly watch the "current timeframe" and get alerts when it emerges from low volatility.
Use the link below to watch a tutorial video, request a trial, or purchase for access.

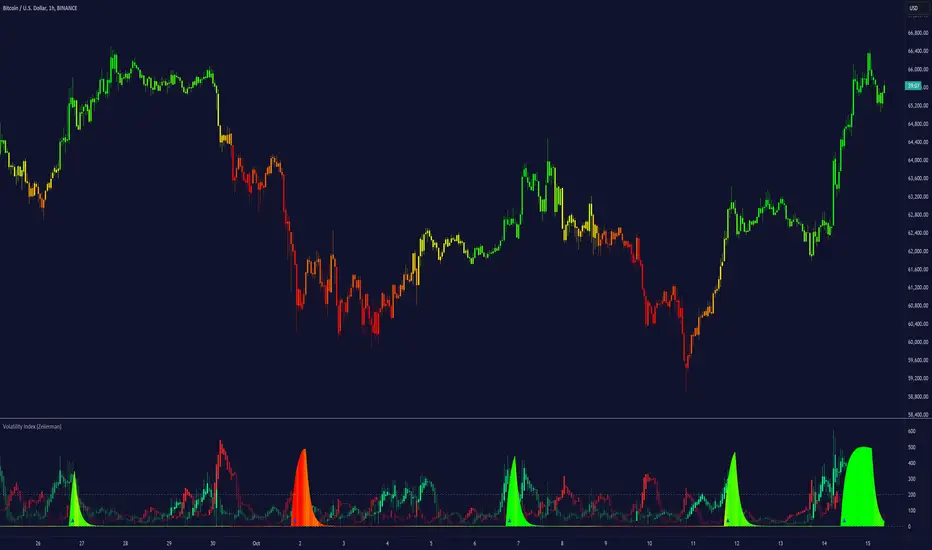
Volatility Index (Expo)Volatility Index (Expo)
DESCRIPTION
Volatility can be referred to many things, but a commonly accepted definition of volatility is that it’s a measure of the risk or uncertainty in the market. Higher volatility is equal to more risk in the market. A simple way of describing it is that when volatility is high, the value of the market can be spread out over a larger range of values. This means that the price of the market can change dramatically over a short time period in either direction. A lower volatility means that a market's value does not fluctuate dramatically, and tends to be steadier. However, how to calculate and to apply volatility has been widely debated and many different calculations have been used. Volatility Index is a must for a professional trader in today's volatile markets.
This Volatility Index is derived from research within Volatility.
HOW TO USE
1. Use the indicator to detect low- respectively high volatility.
2. Enter the market when the volatility is low, and exit the market when the volatility is high.
3. Use the indicator to identify when the volatility peaks. Can indicate that the market will shift or can be good areas to take profits.
Trend
When the market is in a positive trend, the volatility is low and stable. The opposite happens when the market is in a negative trend, the volatility is high and price moves boldly.
As a rule ,when volatility increases unusually(abnormal) in relation to previous periods something is happening in the market, then wait until the volatility peaks or when the indicator does not make any new highs (the indicator becomes flat), and in conjunction with that the trending price action doesn’t make any new lows or respectively highs. When this happens there is a high probability that the market will take a temporary turn.
Positive volatility refers to when the volatility index increases with green candlesticks this means that the buyers are more aggressive than sellers. (Can indicate a trend change)
Negative volatility refers to when the volatility index increases with red candlesticks this means that the sellers are more aggressive than buyers. (Can indicate a trend change)
INDICATOR IN ACTION
This indicator is best presented live, the graphs below gives a hint of how the Volatility Index works.
The indicator works on any market, security, currency, stock, etc. and on any timeframe.
BTCUSD
EURUSD
WALL STREET
I hope you find this indicator useful , and please comment or contact me if you like the script or have any questions/suggestions for future improvements. Thanks!
I will continue to work on this indicator, so please share your experience and feedback with me so that I can continuously improve it. Thanks to everyone that have contacted me regarding my scripts. Your feedback is valuable for future developments!
ACCESS THE INDICATOR
• Contact me on TradingView or use the links below
-----------------
Disclaimer
Copyright by Zeiierman.
The information contained in my scripts/indicators/ideas does not constitute financial advice or a solicitation to buy or sell any securities of any type. I will not accept liability for any loss or damage, including without limitation any loss of profit, which may arise directly or indirectly from use of or reliance on such information.
All investments involve risk, and the past performance of a security, industry, sector, market, financial product, trading strategy, or individual’s trading does not guarantee future results or returns. Investors are fully responsible for any investment decisions they make. Such decisions should be based solely on an evaluation of their financial circumstances, investment objectives, risk tolerance, and liquidity needs.
My scripts/indicators/ideas are only for educational purposes!
BTC Mining Cost - IndicatorBTC Mining Cost Indicator
- Adjust the Emission Rate after each halving, currently it's 12.5
- Current settings are for the Antminer S17 with an average cost of 12 cents per kWh
As you can see, a bounce usually follows when the price hits the cost of mining 1 BTC .
I would love to hear your feedback, and if you like it please gimme a thumbs up ❤️
Happy Trading!

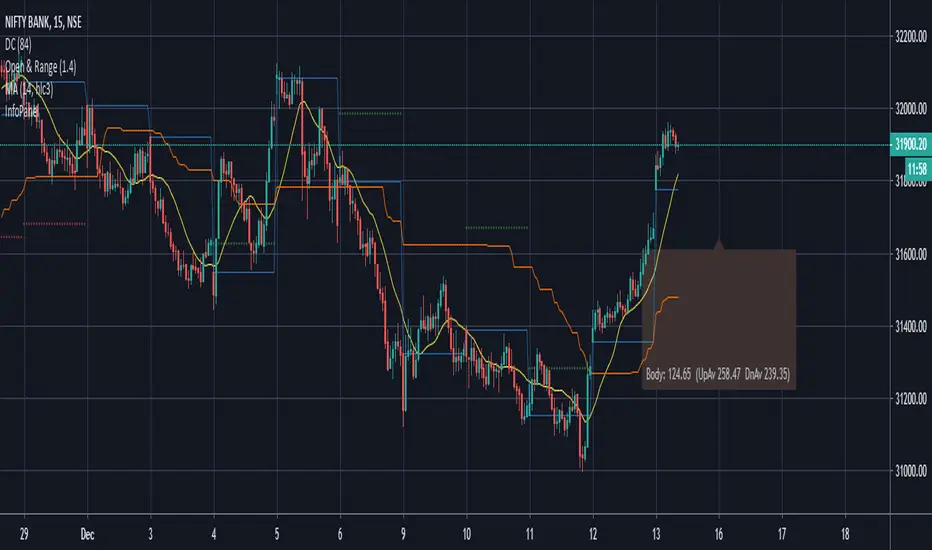
Normailzed CandleThis indicator normalizes Day's candle with Open. Idea is to see the daily movement in the context of the Open of the Day.
Larry Williams talks about Open being the most important price of the day. Hence, this indicator.
The Green line is average Open-to-High for occurrences of Red days. The Red line is average Open-to-Low for occurrences of Green days.
Average are not perfect calculations since occurrences(of Red or Green) will vary within the time-span used for averages.
These can used to gauge likelihood of the intra-day price reversal. If the price exceeds green/red line, there is higher likelihood of the price closing above/below open.
The blue lines are average Open-to-close for Green and Red occurrences.
Be careful on days where consecutive 3rd Highest High or Lowest Low day is made and also on the next day after such day. Prices may turn direction at least for a short while.
The precursor to this script of the Candle Infopanel script. That script was just numbers in panel and this is a graphical representation. I
Some of the calculations from original script are commented here because it would make visuals clutters (and probably the left-out calculation are not critical to making trade decisions!)

Candle Information Panel//This indicator shows Day's candle measurements with past averages. First column shows the candle details for the present day.
//"Open - Low", "High - Open", "Range(=High-low)", "Body(open-close)"
//Averages are calculated for occurences of Green and Red days. Up Averages are for Green days and Down Averages are for Red days.
//Average are not perfect calculations since occurences(of Red or Green) will vary within the timespan used for averages.
//This can used to guage general sense of probability of the price movement.
//e.g. if the Open to Low for a day exceeds UpAv value, then there is higher likelihood of day being Red.
//similarly, trade can be held in expectation of price reaching the DnAv and stop loss can be trailed accordingly.
//Not a perfect system. But something to work on further to increase price action understanding.
//Be careful on days where consecutive 3rd Highest High or Lowest Low day is made and also on the next day after such day. Prices may turn direction at least for a short while.
Complete Credit goes to @pinecoders who gave me the main script on tradingview chat room.
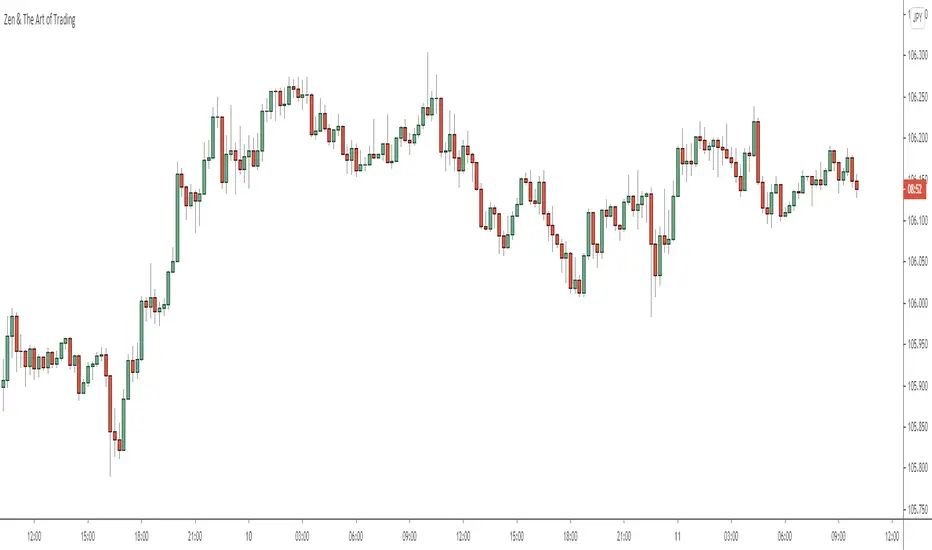
ATR (Average True Range) By TimeWhat is ATR By Time?
This premium indicator was inspired by my RVOL By Time indicator . It works on Stocks, Forex, Crypto and most Futures markets. Instead of calculating the ATR by recent price data, it calculates an ATR value for each candle based on that candle’s time of day.
For example, if you set the Lookback setting on this indicator to 14, then instead of calculating the ATR based on the past 14 candles, it will calculate an ATR value based on the past 14 trading sessions for each candle.
This is extremely useful for day traders in particular as it allows you to gauge the average range of candles during certain times of day instead of only by the most recent price action.
It also draws a regular ATR (optional) – so this is essentially an enhanced ATR script that gives you multiple readings on price volatility.
If you are interested, you can purchase access to the script or register for a free trial on my website: ATR By Time Feature Page .
Why Does It Cost Money?
The reason why this is a premium script that requires payment to access is because it took a lot of time, research and development in order to create. The other advantage of charging for it is that it retains exclusivity to only a select few dedicated traders.
By paying the yearly fee you get access to ALL of my premium indicators including lifetime updates and technical support.
If you don’t want to pay for this script then I completely understand and I have plenty of other free indicators and scripts that you might be interested in!
Free Trial
I am a trader myself and so I know how skeptical you might be that this indicator is worth your time and money. That is why I am offering a free trial of this indicator.
All you need to do to initiate your trial is Join My Mailing List/ on my website: zenandtheartoftrading.com
How It Works
This script uses a complex formula to calculate ATR values across distant historical bars.
Depending on the timeframe you select it will skip through historical bars to find previous bars from the same time of day. It collects these values then applies the traditional ATR formula to them.
The ATR value is determined by the maximum result of the following three calculations:
- Current high minus the current low
- The absolute value of the current high minus the previous close
- The absolute value of the current low minus the previous close
- Whichever of these three calculations comes out highest, that is your ATR for the given candle.
Once this value is calculated for historical bars the ATR indicator’s reading is typically determined by a 14-period moving average of these individual ATR values. So the ATR reading you see on your screen is an average of the past 14 ATR values.
This means that as markets expand and contract this volatility reading will adapt to the change in candle price ranges.
The difference with the ATR By Time indicator’s calculation formula is that rather than referencing recent bars it references bars based on their time of day.
For example, if you are on the 1-Hour chart and you check the ATR By Time value at 9:00AM with a Lookback period of 14, then the value you see will be the result of the ATR calculation of every 9:00AM 1-Hour candle over the past 14 trading sessions.
You can also choose to enable the ATR moving average in the settings menu if you wish. This will give you a smoothed ATR reading by averaging the current session’s ATR value with previous sessions.
This versatility gives you a sophisticated reading on price volatility which is particularly helpful for day trade setups based around market opens or market closes when volatility tends to spike.
The regular ATR indicator will not account for this on the lower timeframes, but this indicator will!
Examples
Stocks - Heatmap Scheme with regular ATR
Stocks - Price Scheme - No ATR
Stocks - Traffic Scheme - Session Average Line RMA
Stocks - Trigger Scheme - 10 sessions
Forex - RMA
Forex - No RMA
Forex - Normal ATR Stop
Forex - Session ATR Stop
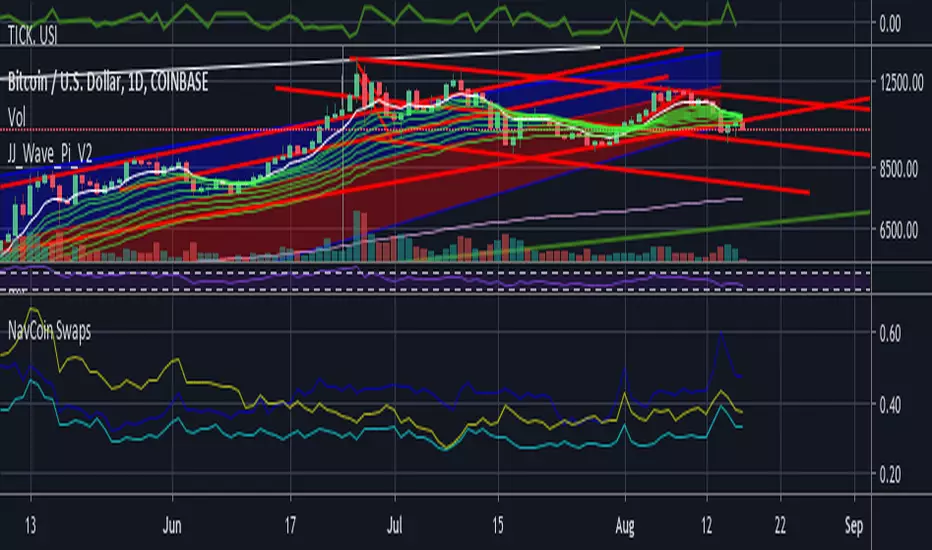
NavCoin SwapsSimple line chart showing the price of navcoin swaps against three other similarly 'small cap' cryptos that are competing in similar space. PIVX, MTL, and ARK. Double-click the line or click the settings icon to change colors etc.
All are Nav / Othercoin, so a line moving up means othercoin is losing value relative to Nav, and down means of course the other coin is now worth more Nav.
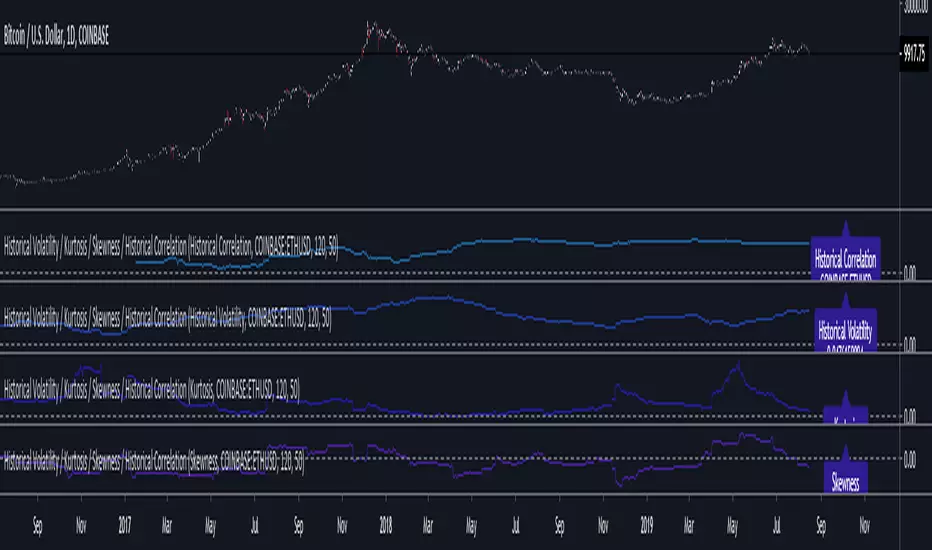
Volatility / Kurtosis / Skewness / CorrelationCalculations for Historical Volatility, Kurtosis, Skewness and Historical Correlation between two assets.
--------------------------------------
If you find it useful please consider a tip/donation :
BTC - 3BMEXEDyWJ58eXUEALYPadbn1wwWKmf6sA
--------------------------------------
US Treasury Yield CurveThis indicator plots the US treasury yield curve as maturity (x-axis/time) vs yield (y-axis/price)

VIX reversion-Buschi
English:
A significant intraday reversion (commonly used: 3 points) on a high (over 20 points) S&P 500 Volatility Index (VIX) can be a sign of a market bottom, because there is the assumption that some of the "big guys" liquidated their options / insurances because the worst is over.
This indicator shows these reversions (3 points as default) when the VIX was over 20 points. The character "R" is then shown directly over the daily column, the VIX need not to be loaded explicitly.
Deutsch:
Eine deutliche Intraday-Umkehr (3 Punkte im Normalfall) bei einem hohen (über 20 Punkte) S&P 500 Volatility Index (VIX) kann ein Zeichen für eine Bodenbildung im Markt sein, weil möglicherweise einige "große Jungs" ihre Optionen / Versicherungen auflösen, weil das schlimmste vorbei ist.
Dieser Indikator zeigt diese Umkehr (Standardwert: 3 Punkte), wenn der VIX vorher über 20 Punkte lag. Der Buchstabe "R" wird dabei direkt über dem Tagesbalken angezeigt, wobei der VIX nicht explizit geladen werden muss.

Realized VolatilityRealized / Historical Volatility
Calculates historical, i.e. realized volatility of any underlying. If frequency is not the daily, but for example 6h, 30min, weeks or months, it scales the initial setting to be suitable for the different time frame.
Examples with default settings (30 day volatility, 365 days per year):
A) Frequency = Daily:
Returns 30 day historical volatility, under the assumption that there are 365 trading days in a year.
B) Frequency = 6h:
Still returns 30 day historical volatility, under the assumption that there are 365 trading days in a year. However, since 6h granularity fits 4 times in 24 hours, it rescales the look back period to rather 30*4 = 120 units to still reflect 30 day historical volatility.

HV Curr/Min/MaxHistorical Volatility, Max Volatility (past 252 days), Min Volatility (past 252 days)


HVRHistorical Volatility Rank
Historical Volatility Percentile
Historical Volatility Current/High/Low

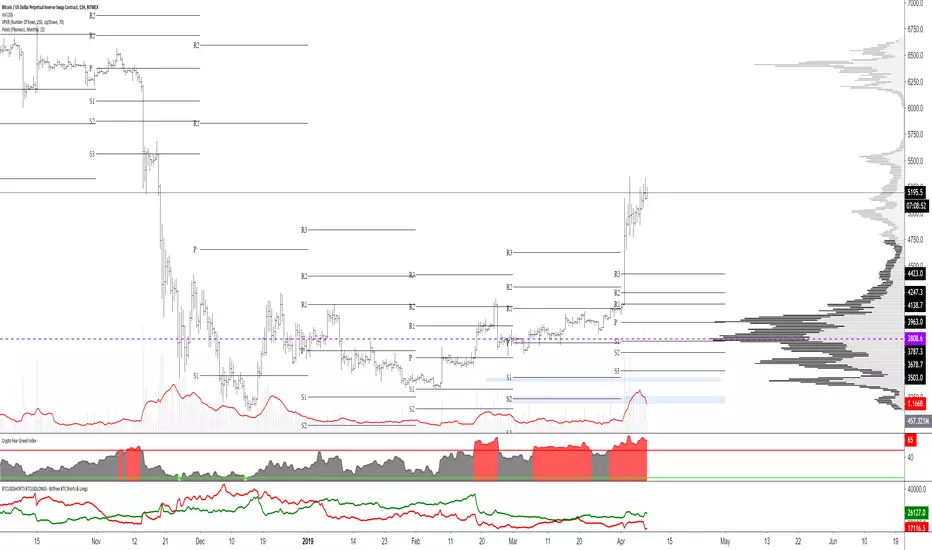
Implied Volatility Percentile (IV Percentile, HVP) [Improved]Indicator showing the Implied Volatility (IV) Percentile for any coin/security.
Areas of low volatility are clearly highlighted. As volatility increases, the IV line moves upwards and the script indicates if the move is Bullish or Bearish.
This script has been designed to be:
Simple - it removes noise and provides a clear visualization of volatility at a glance
Smart - you can define the 'low volatility' threshold and the time period to measure so it can adapt to highly volatile assets in all timeframes
Useful - increased volatility tells us nothing about direction. This script also provides a visual signal indicating if increased volatility corresponds with a bullish or bearish move
How it works:
The script compares the current volatility to the volatility of the last 365 periods. The IV is range-bound between 0% and 100% and so provides a clear view of current volatility relative to previous volatility.
Volatility is typically mean-reverting so the longer a period of low volatility, the more likely it is that an increase is upcoming. This knowledge can be used to place trades in advance of big moves.
Examples of how it can assist your trading:
Using the indicator before Bitcoin's 50% drop in November 2018:
Using the indicator before Cardano's (ADA) 60% rise in early 2019:
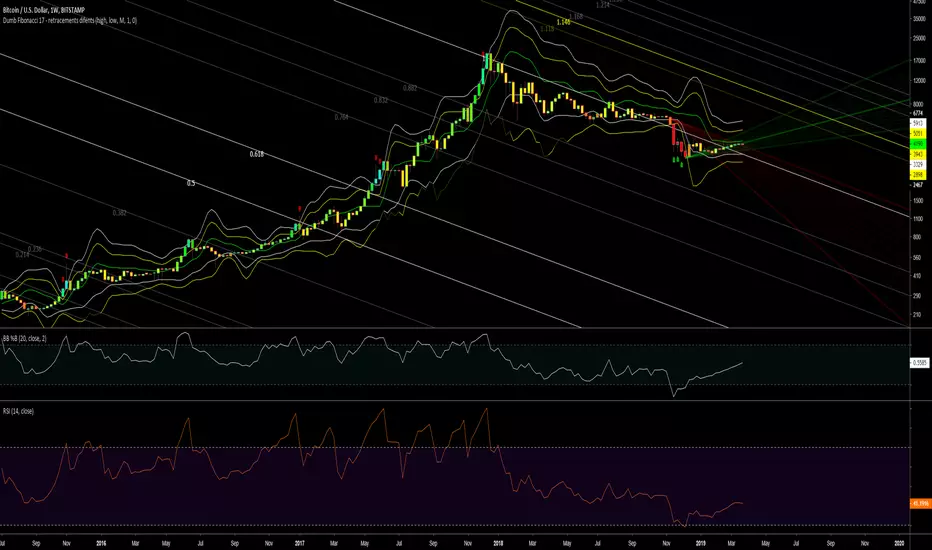
Dumb Indicator 17 - Retracement and market directionsThis indicator shows when the market is oversold or overbought changing the bar colors as the High+Low/2 going to extreme.
MoonLaunchr Key Fibonacci Levels// Script that will display the Key Fibonacci levels.
// There are 2 use cases:
// 1. The highest and lowest prices within view are used by default (pinned to left).
//
// 2. Affix the indicator to the same axis as the price instrument in order to view the long-term state of play (previous 20,000 candles).
//----Set different candle period lengths in order to increase or reduce the amount of time that the indicator will reference back to.


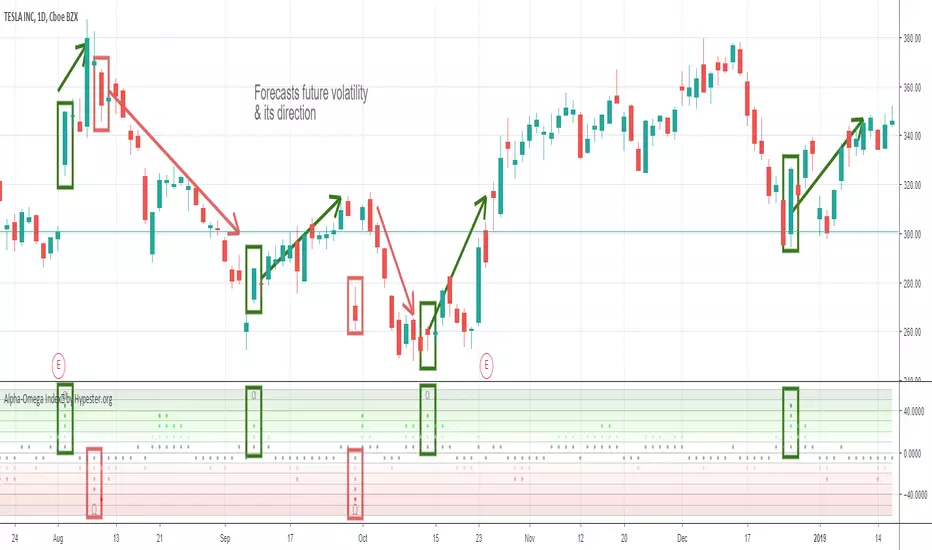
Specter Alpha-Omega Volatility Index™Meet the Alpha-Omega Volatility custom indicator by Specter
This premium volatility indicator uses a series of models to compare historical volatility, and by using a series of noise reduction techniques, it only gives you the very best signals. This indicator shows you aggressive reversals, which are often the most profitable.
The customization options already come with pre-sets, and it's as simple as one click. It comes with Aggressive, Moderate, Conservative and Ultra Conservative behaviors filters.
Also, it offers an interest zone indicator so you can start paying attention to the chart before it happens when trading extra volatile stocks timing is crucial and you want to be ready before the action begins.
The way you use it is pretty simple, you look for divergences. When you have a bullish movement, and you see high negative volatility appearing in the Alpha-Omega indicator, it means a strong reversal/spike is coming. The same goes for bearish reversals, just the opposite logic. You also get an extra layer of confirmation which is the Alpha/Omega characters; they only appear with the most robust volatility prediction. It's up to your trading strategy to decide how conservative you are and which signals you will follow.
It works on any market/security/asset/timeframe.
Ready to ride some spikes?