SMC + OB + FVG + Reversal + UT Bot + Hull Suite – by Fatich.id🎯 7 INTEGRATED SYSTEMS:
✓ Mxwll Suite (SMC + Auto Fibs + CHoCH/BOS)
✓ UT Bot (Trend Signals + Label Management)
✓ Hull Suite (Momentum Analysis)
✓ LuxAlgo FVG (Fair Value Gaps)
✓ LuxAlgo Order Blocks (Volume Pivots) ⭐ NEW
✓ Three Bar Reversal (Pattern Recognition)
✓ Reversal Signals (Momentum Count Style)
⚡ KEY FEATURES:
• Smart Money Structure (CHoCH/BOS/I-CHoCH/I-BoS)
• Auto Fibonacci (10 customizable levels)
• Order Block Detection (Auto mitigation)
• Fair Value Gap Tracking
• Session Highlights (NY/London/Asia)
• Volume Activity Dashboard
• Multi-Timeframe Support
• Clean Label Management
🎨 PERFECT FOR:
• Smart Money Concept Traders
• Order Flow & Liquidity Analysis
• Support/Resistance Trading
• Trend Following & Reversals
• Multi-Timeframe Analysis
💡 RECOMMENDED SETTINGS:
Clean Charts: OB Count 3, UT Signals 3, FVG 5
Detailed Analysis: OB Count 5-10, All Signals
Scalping: Low sensitivity, Hull 20-30
Swing Trading: High sensitivity, Hull 55-100
Hull

Keltner Hull Suite [QuantAlgo]🟢 Overview
The Keltner Hull Suite combines Hull Moving Average positioning with double-smoothed True Range banding to identify trend regimes and filter market noise. The indicator establishes upper and lower volatility bounds around the Hull MA, with the trend line conditionally updating only when price violates these boundaries. This mechanism distinguishes between genuine directional shifts and temporary price fluctuations, providing traders and investors with a systematic framework for trend identification that adapts to changing volatility conditions across multiple timeframes and asset classes.
🟢 How It Works
The calculation foundation begins with the Hull Moving Average, a weighted moving average designed to minimize lag while maintaining smoothness:
hullMA = ta.hma(priceSource, hullPeriod)
The indicator then calculates true range and applies dual exponential smoothing to create a volatility measure that responds more quickly to volatility changes than traditional ATR implementations while maintaining stability through the double-smoothing process:
tr = ta.tr(true)
smoothTR = ta.ema(tr, keltnerPeriod)
doubleSmooth = ta.ema(smoothTR, keltnerPeriod)
deviation = doubleSmooth * keltnerMultiplier
Dynamic support and resistance boundaries are constructed by applying the multiplier-scaled volatility deviation to the Hull MA, creating upper and lower bounds that expand during volatile periods and contract during consolidation:
upperBound = hullMA + deviation
lowerBound = hullMA - deviation
The trend line employs a conditional update mechanism that prevents premature trend reversals. The system maintains the current trend line until price action violates the respective boundary, at which point the trend line snaps to the violated bound:
if upperBound < trendLine
trendLine := upperBound
if lowerBound > trendLine
trendLine := lowerBound
Directional bias determination compares the current trend line value against its previous value, establishing bullish conditions when rising and bearish conditions when falling. Signal generation occurs on state transitions, triggering alerts when the trend state shifts from neutral or opposite direction:
trendUp = trendLine > trendLine
trendDown = trendLine < trendLine
longSignal = trendState == 1 and trendState != 1
shortSignal = trendState == -1 and trendState != -1
The visualization layer creates a trend band by plotting both the current trend line and a two-bar shifted version, with the area between them filled to create a visual channel that reinforces directional conviction.
🟢 How to Use This Indicator
▶ Long and Short Signals: The indicator generates long/buy signals when the trend state transitions to bullish (trend line begins rising) and short/sell signals when transitioning to bearish (trend line begins falling). These state changes represent structural shifts in momentum where price has broken through the adaptive volatility bands, confirming directional commitment.
▶ Trend Band Dynamics: The spacing between the main trend line and its shifted counterpart creates a visual band whose width reflects trend strength and momentum consistency. Expanding bands indicate accelerating directional movement and strong trend persistence, while contracting or flattening bands suggest decelerating momentum, potential trend exhaustion, or impending consolidation. Monitoring band width provides early warning of regime transitions from trending to range-bound conditions.
▶ Preconfigured Presets: Three optimized parameter sets accommodate different trading styles and timeframes. Default (14, 20, 2.0) provides balanced trend identification suitable for daily charts and swing trading, Fast Response (10, 14, 1.5) delivers aggressive signal generation optimized for intraday scalping and momentum trading on 1-15 minute timeframes, while Smooth Trend (18, 30, 2.5) offers conservative trend confirmation ideal for position trading on 4-hour to daily charts with enhanced noise filtration.
▶ Built-in Alerts: Three alert conditions enable automated monitoring - Bullish Trend Signal triggers on long setup confirmation, Bearish Trend Signal activates on short setup confirmation, and Trend Change alerts on any directional transition. These notifications allow you to respond to regime shifts without continuous chart monitoring.
▶ Color Customization: Five visual themes (Classic, Aqua, Cosmic, Ember, Neon, plus Custom) accommodate different chart backgrounds and display preferences, ensuring optimal contrast and visual clarity across trading environments.

Buy/Sell Hull Crossover Signals (Fast & Slow)This indicator generates buy and sell signals using fast- and slow-period Hull Moving Averages (HMAs). A bullish signal occurs when the fast HMA crosses above the slow HMA, while a bearish signal triggers when it crosses below. To reduce repainting, you can optionally require confirmation on bar close.
The script includes visual tools such as a color-shifting ribbon between HMAs, optional background shading to show market regime, and lightweight buy/sell labels for quick signal recognition. Alerts are built in so you can automate notifications when crossover conditions occur.
Designed to be simple, responsive, and easy to layer into existing strategies, this indicator helps traders spot momentum shifts and trend transitions with clarity.

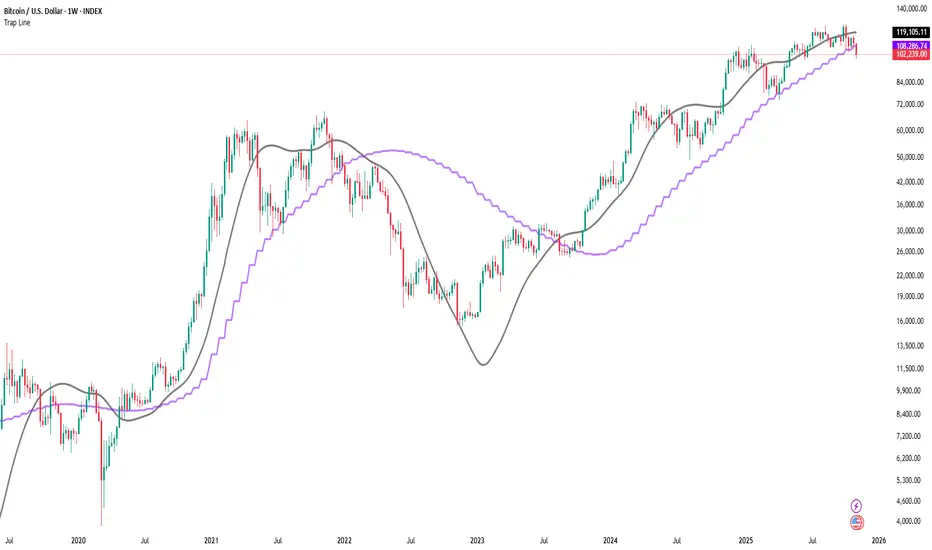
Trap LineOverview
Trap Line is a higher-timeframe trend framework designed to define market regimes using smoothed weekly (1W) and three-week (3W) baselines. Price trading above the line reflects a bullish regime; price below the line reflects a bearish one. The goal is regime discipline—stay aligned with the dominant higher-timeframe direction and avoid late, emotional entries. All parameters are fixed to ensure consistent behavior across symbols.
Core logic (concepts, not full code)
• Computes a Hull-type moving average on 1W and 3W closes (with optional linear-regression pre-filtering) and projects them onto lower timeframes via interpolation.
• Produces a smooth, lag-reduced structural baseline that tracks the weekly trend path.
• Observing price vs. the baseline highlights potential trap zones—temporary breaches that often fail without a confirmed weekly close.
• The 3-Week Trap Line adds a macro confirmation layer and is hidden by default in the Style tab to keep charts clean.
Inputs
• Parameters (length, smoothing type, regression toggle, interpolation mode) are fixed to prevent overfitting and preserve repeatability.
How to read it
• Above the line => bullish regime.
• Below the line => bearish regime.
• A confirmed weekly close through the line suggests a regime transition.
• A weekly close above the line with a green candle supports bullish continuation; a weekly close below the line with a red candle supports bearish continuation.
• Intraweek deviations near the line are often noise and may fade.
Practical use cases
• Weekly bias filter for swing/position frameworks.
• Regime confirmation across related assets or sectors.
• Portfolio overlay: favor long exposure in bullish regimes; reduce risk in bearish regimes.
• Combine with volume or ATR-based tools to assess trend quality.
Best practices
• Wait for the weekly close before declaring regime flips.
• Avoid overreacting to intraweek moves around the baseline.
• Combine with structure analysis (HH/HL vs. LH/LL) and higher-timeframe S/R.
• Use standard time-based candles; avoid interpreting signals on Heikin Ashi, Renko, Kagi, Point & Figure, or Range charts.
Technical notes
• Built on locked higher-timeframe data (1W and 3W).
• Interpolation is used to render HTF structure smoothly on lower charts.
• Non-repainting : values finalize when the higher timeframe closes; lower-TF plotting is interpolated, not forward-looking.
Who it is for
• Traders who want a consistent, rules-based higher-timeframe bias filter.
• Systematic users who prefer fixed-parameter baselines for regime context.
Limitations & disclosures
• Closed-source; educational and analytical use only.
• Not financial advice. Markets involve risk; past performance does not guarantee future results.
Release notes
• Includes the 3-Week Trap Line (3W). It is hidden by default in the Style tab; enable it if you want an additional macro confirmation layer.
• Fixed-parameter design (no user-tweakable inputs) for consistent behavior across symbols.
• Non-repainting values finalize on 1W/3W candle close.
Originality & why closed-source
This is not a reimplementation of public open-source scripts. Trap Line uses a specific combination of higher-timeframe Hull smoothing, optional linear-regression pre-filtering, and lower-timeframe interpolation designed to expose trap zones (temporary regime breaches that often fail without a confirmed weekly close). The integration and thresholds are proprietary and tuned to retain weekly structure with reduced lag. The source is closed to protect this implementation.
Integration, not a mashup
Trap Line is a single, self-contained framework. It does not merely merge other indicators; its components are integrated to produce a unified higher-timeframe baseline (1W/3W) with a defined reading protocol (above/below line, weekly-close confirmation, optional candle-color confirmation).
Indicator, not a strategy
This publication provides an indicator overlay , not a trading strategy. It includes no backtests, position logic, performance claims, or risk assumptions. Use it as an analytical bias filter within your own risk management.
Comparison to common tools
Compared to standard MAs or SuperTrend-style bands, Trap Line prioritizes (1) higher-timeframe structure fidelity, (2) reduced lag via HMA-type smoothing, and (3) explicit weekly-close confirmation to avoid premature regime flips. The optional 3-Week line acts as a macro confirmation layer and is hidden by default in the Style tab.
Intelligent Trading SuiteIntelligent Trading Suite
“One script to rule them all.”
Overview
The Intelligent Trading Suite is a professional-grade decision system built in Pine Script. It is a unified engine—not a bundle of indicators—that combines adaptive pattern recognition, historical memory, and multi-context intelligence into one framework. Using a deep historical pattern database and integrating session dynamics, market calendars, holiday effects, and economic events, it filters noise and adapts to conditions. Core emphasis: precise pattern detection with target-price projection that remains stable as new candles print (mitigates target drift) and early detection of forming geometric patterns and divergences/hidden divergences.
Core Features
All-Timeframe Operation: Works across every TradingView timeframe—from 1m to 1W—without performance drift.
Pattern Recognition with Targets: Detects triangles, wedges, cup & handle, flags, and H&S; projects targets and stabilizes them against common drift as price evolves.
Early Signal Engine: Flags forming patterns and divergences before completion and notifies when prerequisites align.
Historical Pattern Intelligence: Stores and compares thousands of prior states (Hull, VWAP, RSI, MACD, SMA, CVD) to weight current conditions and calibrate confidence.
Context & Regime Awareness: Adjusts for volatility regimes, liquidity sessions, day-of-week bias, holidays, and macro events.
Unified Signal & Confidence: Fuses all streams into a single Overall signal with calibrated confidence levels (Weak / Neutral / Strong).
Visualization & Alerts
Compact Ultimate Intelligence Table showing each analytical pillar, plus the Overall signal, and an option to show them on the chart as well.
Alerts on table for: new pattern detection, divergence events, volatility shifts, and trend reversals.
Important Notes
-Free plan runtime: TradingView Free accounts may hit platform limits.
Fix: Open settings → switch Mode from Paid to Free → runs within Free limits.
-Heavy computation: The script is calculation- and data-intensive; initial runs can take time.
If a rare runtime error occurs, simply reload the page and continue.
Attributions
Hull Moving Average (Alan Hull)
VWAP (Volume Weighted Average Price)
RSI (Relative Strength Index, J. Welles Wilder Jr.)
MACD (Moving Average Convergence Divergence, Gerald Appel)
Black Flag ATR bands (Jose Azcarate)
Proprietary enhancements, target-stabilization logic, and the nuclear intelligence architecture are original research for this suite.
Compliance
Educational and analytical use only
No financial advice
Ad-free; aligned with TradingView House Rules
Proper attribution included
Access
To get access, please read the Author’s instructions on the script’s page.

Adaptive Causal Wavelet Trend FilterThe Adaptive Causal Wavelet Trend Filter is a technical indicator implementing causal approximations of wavelet transform properties for better trend detection with adaptive volatility response.
The Adaptive Causal Wavelet Trend Filter (ACWTF) applies mathematical principles derived from wavelet analysis to financial time series, providing robust trend identification with minimal lag. Unlike conventional moving averages, it preserves significant price movements while filtering market noise through signal processing that i describe below.
I was inspired to build this indicator after reading " Wavelet-Based Trend Identification in Financial Time Series " by In, F., & Kim, S. 2013 and reading about Mexican Hat wavelet filters.
The ACWTF maintains optimal performance across varying market regimes without requiring parameter adjustments by adapting filter characteristics to current volatility conditions.
Mathematical Foundation
Inspired by the Mexican Hat wavelet (Ricker wavelet), this indicator implements causal approximations of wavelet filters optimized for real-time financial analysis. The multi-resolution approach identifies features at different scales and the adaptive component dynamically adjusts filtering characteristics based on local volatility measurements.
Key mathematical properties include:
Non-linear frequency response adaptation
Edge-preserving signal extraction
Scale-space analysis through dual filter implementation
Volatility-dependent coefficient adjustment, which I love
Filter Methods
Adaptive: Implements a volatility-weighted combination of multiple filter types to optimize the time-frequency resolution trade-off
Hull: Provides a causal approximation of wavelet edge detection properties with forward-projection characteristics
VWMA: Incorporates volume information into the filtering process for enhanced signal detection
EMA Cascade: Creates a multi-pole filter structure that approximates certain wavelet scaling properties
Suggestion: try all as they will provide slightly different signals. Try also different time-frames.
Practical Applications
Trend Direction Identification: Clear visual trend direction with reduced noise and lag
Regime Change Detection: Early identification of significant trend reversals
Market Condition Analysis: Integrated volatility metrics provide context for current market behavior
Multi-timeframe Confirmation: Alignment between primary and secondary filters offers additional confirmation
Entry/Exit Timing: Filter crossovers and trend changes provide potential trading signals
The comprehensive information panel provides:
Current filter method and trend state
Trend alignment between timeframes
Real-time volatility assessment
Price position relative to filter
Overall trading bias based on multiple factors
Implementation Notes
Log returns option provides improved statistical properties for financial time series
Primary and secondary filter lengths can be adjusted to optimize for specific instruments and timeframes
The indicator performs particularly well during trend transitions and regime changes
The indicator reduces the need for using additional indicators to check trend reversion

Triple HMA Colored [Chichomax]Triple HMA Colored Indicator Description
The Triple HMA Colored indicator is a sophisticated technical analysis tool designed to enhance trend identification by displaying three Hull Moving Averages (HMAs) on your chart, each with fully customizable periods and dynamic color settings. This indicator is built on the refined HMA calculation method, which leverages weighted moving averages (WMAs) to generate smooth and responsive trend lines with minimal lag.
Key Features:
- Triple HMA Setup:
Displays three HMAs, each computed with different, user-configurable periods, enabling multi-timeframe analysis in a single indicator.
- Dynamic Color Coding:
Each HMA line is color-coded based on its directional movement. When the current HMA value exceeds the previous value, the line is drawn in the designated "up" color, and when it falls below, it switches to the "down" color. This provides immediate visual cues for trend shifts.
- Customizable Inputs:
Users can adjust the period lengths for each of the three HMAs and select from six different color options (two for each HMA) directly from the indicator’s settings panel, ensuring that the tool can be tailored to match various trading strategies and visual preferences.
- Efficient Trend Detection:
By combining the speed of WMAs with the smoothness of the Hull Moving Average, this indicator offers a reliable method to detect market momentum changes, making it a valuable asset for both trend-following and counter-trend strategies.
Ideal for traders who demand flexibility and clarity in their chart analysis, the Triple HMA Colored indicator simplifies the process of tracking market trends across multiple timeframes while providing clear, visual signals for potential entry and exit points.

MTF EHMA & HMA Insights [FibonacciFlux]MTF EHMA & HMA Insights
Overview
The Multi-Timeframe EHMA, HMA, and Midline with Fill script is a powerful technical analysis tool designed for traders seeking to enhance their market insights and decision-making processes. By integrating two advanced moving averages—Exponential Hull Moving Average (EHMA) and Hull Moving Average (HMA)—along with a dynamic midline, this indicator provides a comprehensive view of market trends across multiple timeframes.
Key Features
1. Dual Moving Averages
- Exponential Hull Moving Average (EHMA) :
- Offers a rapid response to price changes, making it particularly useful for identifying short-term trends.
- Utilizes a unique calculation method that reduces lag, allowing traders to react quickly to market movements.
- Hull Moving Average (HMA) :
- Known for its smoothness and ability to filter out noise, the HMA presents a clear picture of the underlying trend.
- The HMA is specifically designed to achieve a balance between responsiveness and smoothness, enabling traders to make informed decisions.
2. Midline Calculation
- Dynamic Midline (m) :
- The midline is calculated as the average of EHMA and HMA, providing a neutral reference point for evaluating price movements.
- It visually represents market sentiment; a rising midline suggests bullish conditions, while a declining midline indicates bearish trends.
3. Visual Components
- Fill Areas :
- Color-coded fills between the EHMA and HMA enhance visual clarity by indicating the relative position of these moving averages.
- The fill color dynamically changes based on the relationship between the two averages (green for EHMA below HMA and red for EHMA above HMA), allowing traders to quickly assess market conditions.
4. Signal Generation and Alerts
- Buy/Sell Signals :
- The indicator generates buy signals when the midline crosses above its previous value, indicating a potential upward trend.
- Conversely, sell signals are triggered when the midline crosses below its previous value, suggesting a possible downward movement.
- Alert Conditions :
- Built-in alerts notify traders in real-time when significant changes occur, allowing them to act swiftly on potential trading opportunities.
- Customizable alert messages ensure traders receive relevant information tailored to their strategies.
Technical Details
Input Parameters
- Timeframe Settings :
- Traders can customize the timeframes for both EHMA and HMA, enabling them to adapt the indicator to different trading styles and market conditions.
- Length Settings :
- Adjustable lengths for both moving averages impact their sensitivity, allowing traders to optimize their performance based on volatility and market dynamics.
Plotting and Visualization
- Plotting :
- The script plots the EHMA, HMA, and midline directly on the chart for easy visualization.
- Signal labels (BUY and SELL) are displayed prominently, helping traders to identify potential entry and exit points without ambiguity.
Benefits
1. Clarity and Insight
- The combination of EHMA, HMA, and midline provides a clear and concise visual representation of market trends, aiding traders in making informed decisions.
2. Flexibility
- Customizable parameters allow traders to tailor the indicator to their specific needs, making it suitable for various market conditions and trading styles.
3. Efficiency
- Real-time alerts and visual signals minimize response times, enabling traders to capitalize on opportunities as they arise.
4. Enhanced Trading Conditions
- When utilizing the Fibonacci number 144 on a daily chart, the indicator facilitates optimal trading conditions:
- "The entry was made before the bubble began, using 144 as the Fibonacci variable."
- "The exit occurred right before the bubble burst, or alternatively, a short position was initiated."
- "When the next bubble started, a long entry was made again."
- "Despite some lag, the position was exited and a long entry was made."
- "The exit or short entry took place at the second double top peak."
- "A short position was already established before the double top formation occurred."
- On a 4-hour chart, traders can effectively set stop losses at HMA levels, achieving a risk-reward ratio between 4 and 8.
- Additionally, analyzing the 15-minute chart with a multi-timeframe approach allows for more precise entry points.
Conclusion
The Multi-Timeframe EHMA, HMA, and Midline with Fill script is a robust tool for traders looking to enhance their technical analysis capabilities. By combining multiple moving averages with a dynamic midline and alert system, this indicator offers a comprehensive approach to understanding market trends. Its flexibility, clarity, and efficiency make it an invaluable asset for both novice and experienced traders alike.
Important Note
As with any trading tool, it is crucial to conduct thorough analysis and risk management when using this indicator. Past performance does not guarantee future results, and traders should always be prepared for potential market fluctuations.

Versatile Moving Average StrategyVersatile Moving Average Strategy (VMAS)
Overview:
The Versatile Moving Average Strategy (VMAS) is designed to provide traders with a flexible approach to trend-following, utilizing multiple types of moving averages. This strategy allows for customization in choosing the moving average type and length, catering to various market conditions and trading styles.
Key Features:
- Multiple Moving Average Types: Choose from SMA, EMA, SMMA (RMA), WMA, VWMA, HULL, LSMA, and ALMA to best suit your trading needs.
- Customizable Inputs: Adjust the moving average length, source of price data, and stop-loss source to fine-tune the strategy.
- Target Percent: Set the percentage difference between successive profit targets to manage your risk and rewards effectively.
- Position Management: Enable or disable long and short positions, allowing for versatility in different market conditions.
- Commission and Slippage: The strategy includes realistic commission settings to ensure accurate backtesting results.
Strategy Logic:
1. Moving Average Calculation: The selected moving average is calculated based on user-defined parameters.
2. Entry Conditions:
- A long position is entered when the entry source crosses over the moving average, if long positions are enabled.
- A short position is entered when the entry source crosses under the moving average, if short positions are enabled.
3. Stop-Loss: Positions are closed if the stop-loss source crosses the moving average in the opposite direction.
4. Profit Targets: Multiple profit targets are defined, with each target set at an incremental percentage above (for long positions) or below (for short positions) the entry price.
Default Properties:
- Account Size: $10000
- Commission: 0.01% per trade
- Risk Management: Positions are sized to risk 80% of the equity per trade, because we get very tight stoploss when position is open.
- Sample Size: Backtesting has been conducted to ensure a sufficient sample size of trades, ideally more than 100 trades.
How to Use:
1. Configure Inputs: Set your preferred moving average type, length, and other input parameters.
2. Enable Positions: Choose whether to enable long, short, or both types of positions.
3. Backtest and Analyze: Run backtests with realistic settings and analyze the results to ensure the strategy aligns with your trading goals.
4. Deploy and Monitor: Once satisfied with the backtesting results, deploy the strategy in a live environment and monitor its performance.
This strategy is suitable for traders looking to leverage moving averages in a versatile and customizable manner. Adjust the parameters to match your trading style and market conditions for optimal results.
Note: Ensure the strategy settings used for publication are the same as those described here. Always conduct thorough backtesting before deploying any strategy in a live trading environment.

SuperTrend Fisher [AlgoAlpha]🚀🌟 Introducing the "Super Fisher" by AlgoAlpha, a sophisticated and versatile tool crafted for the discerning trader. This innovative indicator merges the precision of the Fisher Transform with the adaptability of the SuperTrend methodology, offering a fresh perspective on market analysis. 📈🔍
Key Features:
🔶 Customizable Settings: Tailor the indicator to your trading style with adjustable inputs like "Fair-value Period" and "EMA Length". Choose your preferred "Up Color" and "Down Color" for a personalized visual experience.
🔶 Advanced Fisher Transform: At the heart of this tool is the Fisher Transform, an algorithm renowned for pinpointing potential price reversals by normalizing asset prices.
🔶 Integrated SuperTrend Functionality: This feature adds a layer of trend analysis, using the refined Fisher Transform values to generate dynamic, trend-following signals.
🔶 Enhanced Visualization: Clearly distinguishable bullish and bearish market phases, thanks to the color-coded plots of Fisher Transform and SuperTrend values.
🔶 Overbought/Oversold Levels: Visual plots and fills for these levels provide additional insights into market extremities.
🔶 Configurable Alerts: Stay informed with alerts for critical market movements like crossing the zero line or the SuperTrend.
Logic:
The "Super Fisher" operates on a sophisticated algorithm:
1. Fisher Transform Calculation: It starts by calculating the Detrended Price Oscillator (DPO) and its standard deviation. These values are then transformed using the Fisher Transform formula, which is subsequently smoothed with a Hull Moving Average.
2. SuperTrend Integration: The SuperTrend function employs the Fisher Transform values to create a dynamic trend-following tool. It calculates upper and lower bands and determines which one to use for market direction based on whether the fisher is above or below the bands, offering an insightful view of the price trend.
3. Overbought/Oversold Identification: The tool plots specific levels to indicate overbought and oversold conditions, aiding in the identification of potential reversal points.
Here's a closer look at the core calculations:
Calculates the Fisher Transform:
value = 0.0
value := round_(.66 * ((src - low_) / (high_ - low_) - .5) + .67 * nz(value ))
fish1 = 0.0
fish1 := .5 * math.log((1 + value) / (1 - value)) + .5 * nz(fish1 )
fish1 := ta.hma(fish1, l)
Calculates the SuperTrend:
supertrend(factor, atrPeriod, srcc) =>
src = srcc
atr = atrr(srcc, atrPeriod)
upperBand = src + factor * atr
lowerBand = src - factor * atr
prevLowerBand = nz(lowerBand )
prevUpperBand = nz(upperBand )
lowerBand := lowerBand > prevLowerBand or srcc < prevLowerBand ? lowerBand : prevLowerBand
upperBand := upperBand < prevUpperBand or srcc > prevUpperBand ? upperBand : prevUpperBand
int direction = na
float superTrend = na
prevSuperTrend = superTrend
if na(atr )
direction := 1
else if prevSuperTrend == prevUpperBand
direction := srcc > upperBand ? -1 : 1
else
direction := srcc < lowerBand ? 1 : -1
superTrend := direction == -1 ? lowerBand : upperBand
How to Use:
📊 To maximize the potential of the "Super Fisher", follow these steps:
1. Customize Settings: Adjust the inputs to match your trading preferences. This includes setting the periods for the Fisher Transform and SuperTrend, as well as choosing colors for better visualization.
2. Analyze the Market: Observe the Fisher Transform and SuperTrend plots to gauge market direction. Pay special attention to color changes, as they indicate shifts in market sentiment.
3. Identify Extremes: Use the overbought and oversold plots to understand potential reversal points.
4. Set Alerts: Utilize the alert functionality to stay informed about significant market movements, ensuring you never miss an opportunity.
🔥 In summary the "Super Fisher" is a comprehensive market analysis tool designed to enhance your trading insights and decision-making process. 📉🌟🚨

[blackcat] L4 Adaptive Hull Suite 4HLevel: L4
Function Description:
The L4 Adaptive Hull Suite 4H aims to help traders identify trend reversals and trade signals using various moving averages and indicators. The script is designed to be adaptable and customizable, allowing traders to tweak the settings to suit their individual preferences and trading styles.
At its core, the script uses the hybrid Hull Moving Average (HHMA), a popular technical indicator that aims to reduce lag and noise while improving the accuracy of moving average signals. The HHMA is combined with a reverse chop indicator, which helps identify trend reversals by measuring the volatility of the market and comparing it to a set threshold.
In addition to the HHMA and reverse chop indicators, the script also includes customized open-close cross (OCC) conditions and a hybrid Hull Moving Average (Hybrid Hull MA). The OCC conditions allow traders to generate buy and sell signals based on the cross of the open and close prices, while the hybrid Hull MA combines the HHull MA with other moving averages to provide a more accurate and reliable trend-following signal.
Traders can adjust the settings of the script to suit their trading style and risk appetite. For instance, the chop length, ATR length, and reverse chop threshold can be customized to identify trend reversals more accurately, while the Hull MA length can be adjusted to provide a faster or slower response to price changes.
Overall, the L4 Adaptive Hull Suite 4H is a powerful and flexible Pine script that can help traders identify trend reversals and generate accurate buy and sell signals. With its customizable settings and reliable indicators, the script can be a valuable addition to any trader's toolkit.
About Time Frame:
The L4 Adaptive Hull Suite 4H is specifically designed for use on the 4-hour time frame and is particularly well-suited for trading the BTCUSDT.P trading pair. The script combines various technical indicators, including the Adaptive Hull Moving Average (AHMA) and the reverse chop indicator, to help identify trend reversals and generate accurate buy and sell signals.
Traders who are interested in using the L4 Adaptive Hull Suite 4H should be aware that it is optimized for use on the 4-hour time frame. While it may work on other time frames, the signals generated may not be as reliable as those generated on the 4-hour chart. Additionally, the script is specifically designed for use on the BTCUSDT.P trading pair, and may not be as effective on other trading pairs.
Overall, the L4 Adaptive Hull Suite 4H is a powerful and adaptable Pine script that can help traders identify trend reversals and generate accurate buy and sell signals. With its focus on the 4-hour time frame and the BTCUSDT.P trading pair, the script can be a valuable tool for traders who are looking to improve their trading results on this particular asset.
Choppiness Sensitive
The L4 Adaptive Hull Suite 4H includes a choppiness detection feature that helps traders identify whether the market is trending strongly or moving sideways. When the market is trending strongly, the background color of the chart will turn blue, indicating an active buy or sell signal. Conversely, when the market is moving sideways, the script will ignore any buy or sell signals generated by the OCC or Hull MA conditions.
The choppiness detection feature is based on the reverse chop indicator, which measures the volatility of the market and compares it to a set threshold. When the chop value is above the threshold, the market is considered to be in a sideways or choppy phase, and the script will not generate any buy or sell signals. However, when the chop value is below the threshold, the market is considered to be trending strongly, and the script will generate active buy or sell signals based on the OCC or Hull MA conditions.
Overall, the choppiness detection feature is a valuable addition to the L4 Adaptive Hull Suite 4H, as it helps traders identify the optimal times to enter and exit the market. By focusing on strong trends and ignoring sideways movement, traders can improve their trading results and minimize their risk of losses.
Divergence Detection and Alerts
The L4 Adaptive Hull Suite 4H is a powerful Pine script that can produce divergence labels and TradingView alerts using the built-in alert() function. This allows traders to receive real-time notifications when the script generates a buy or sell signal, making it easier to stay on top of market movements and take advantage of profitable trading opportunities.
To set up alerts, traders can simply add the alert() function to the script and specify the conditions that should trigger the alert. For instance, traders may want to receive an alert when the script generates a buy signal based on the OCC conditions, or when the Hull MA crosses above or below a certain level.
In addition to alerts, the script can also produce divergence labels, which can help traders identify potential trend reversals and generate more accurate buy and sell signals. Divergence labels are based on the difference between the script's indicators and the price action of the asset being traded, and can provide valuable insights into the underlying market dynamics.
Overall, the L4 Adaptive Hull Suite 4H is a versatile and customizable script that can help traders identify trend reversals and generate accurate buy and sell signals. With its ability to produce alerts and divergence labels, the script can be a valuable tool for traders who are looking to stay on top of market movements and take advantage of profitable trading opportunities.

Moving Averages SuiteThe Moving Averages Suite is a powerful technical analysis tool that provides traders with unparalleled control over five different moving averages and two special moving average indexes. This suite is designed to provide traders with a comprehensive understanding of market trends and help them make more informed trading decisions.
By default, the Moving Averages Suite displays two special moving average indexes that are made from the moving averages within the suite. These special moving average indexes are specially weighted indexes that are designed to provide a more accurate representation of market trends. The first index is the Moving Average Directional Index (MADI), which measures the strength of the trend in the market. The second index is the Moving Average Oscillator Index (MAOI), which measures the momentum of the trend in the market.
In addition to these special indexes, traders can enable five different moving averages within the suite. These moving averages include the TEMA, HMA, EMA, VWMA, and SMA. Each moving average has a specific purpose and is used to provide traders with a unique perspective on market trends.
The Triple Exponential Moving Average (TEMA) is designed to reduce the lag time associated with traditional moving averages. This moving average places more weight on recent price data, providing traders with a more accurate representation of current market trends.
The Hull Moving Average (HMA) is another moving average that is designed to reduce lag time. This moving average uses weighted averages to provide traders with a more accurate representation of market trends.
The Exponential Moving Average (EMA) is a popular moving average that is used to identify trends in the market. This moving average places more weight on recent price data, providing traders with a more accurate representation of current market trends.
The Volume Weighted Moving Average (VWMA) is another moving average that is used to identify trends in the market. This moving average places more weight on periods of high volume, providing traders with a more accurate representation of market trends during high volume periods.
The Simple Moving Average (SMA) is a widely used moving average that provides traders with a simple and easy-to-understand representation of market trends.
The Moving Averages Suite is a powerful technical analysis tool that provides traders with unparalleled control over five different moving averages and two special moving average indexes. Each moving average within the suite is designed to provide traders with a unique perspective on market trends, allowing them to make more informed trading decisions. Traders who are looking to gain a comprehensive understanding of market trends should consider using the Moving Averages Suite in their trading strategies.

Range Filter x Hull SuiteRange Filter x Hull Suite
This indicator is a hybrid of two popular indicators, with a twist; namely the Range Filter (Guikroth version) and the Hull Suite (by Insilico) .
Originally developed as a 1 minute trend following strategy and traded during the New York Session for it's typically high volume / likely trending nature, it provides entry signals based on the following logic:
For bullish entry signals:
The first bullish* candle (*defined by the Range Filter bar color logic, blue by default - which is not necessarily technically a bullish candle as defined by the OHLC values) which appears after the consolidation candles (also defined by the Range Filter bar color logic, orange by default), and where the Hull Suite moving average is also bullish.
For bearish entry signals:
The first bearish* candle (*defined by the Range Filter bar color logic, red by default - which is not necessarily technically a bearish candle as defined by the OHLC values) which appears after the consolidation candles (also defined by the Range Filter bar color logic, orange by default), and where the Hull Suite moving average is also bearish.
The indicator aims to filter out signals where possible consolidation is occurring and comes with styling options and alternative filter options such as a triple moving average trend detection method. Signals can also be filtered by a specific trading session. Standard options for the Range Filter and Hull Suite settings are also able to be customised within the settings menu.
Alerts
Various alerts are built-in, including the custom entry signals unique to this strategy.
Note : The above features listed above are accurate at the time of publishing, but may be altered in future.
Many thanks to guikroth & Insilico for sharing their open source indicators, and also to the original developer of the strategy itself for sharing it.

Rainbow Collection - VioletMoving averages come in all shapes and types. The most basic type is the simple moving average which is simply the sum divided by the quantity. Therefore, the simple moving average is the sum of the values divided by their number.
In technical analysis, you generally use moving averages to understand the underlying trend and to find trading signals. In the case of the Violet indicator, we are using a Hull moving average which is a special variation based on different weights to minimize lag.
The Violet indicator is therefore used as follows:
* A bullish signal is generated whenever the close price surpasses the 20-period Hull moving average while the previous close prices from periods were all below their respective Hull moving average of the period.
*A bearish signal is generated whenever the close price breaks the 20-period Hull moving average while the previous close prices from periods were all above their respective Hull moving average of the period.
The aim of the Violet indicator is to capture reversals as early as possible through a combination of lagged conditions based on the Fibonacci sequence.

Smart QQE ModSmart QQE - Chart Overlay
Smart QQE shows QQE Trend and RSI plot on chart to determine the trend direction and eliminate false signals.
QQE is obtained from original code by Glaz and rescaled to fit on chart. RSI 50 level acts as Zero which is plotted as a Bollinger on chart.
This is not a Bollinger band . its an RSI channel with levels 0-100 plotted around the mid band. The RSI Mid Band is calculated based on RSI value.
Trend:
Price above RSI Mid band is uptrend
Price below RSI Mid band is Down Trend
The Green line - Discount Zone - 0-RSI level - Oversold Zone
The Red Line - Premium Zone - 100 - RSI level - Overbought Zone
Buy / Sell signals
QQE Buy and Sell signals are plotted based on crossovers of RSI and Fast RSI crossovers.
QQE trend is colored based on the crossover.
Candle color:
candle color determines the Original QQE Trend.
Blue - QQE line above Threshold level in Buy Zone
Pink - QQE line below Threshold level in Sell Zone
Entries are to be made with proper confirmation.
HULL MA is provided as a MA Ribbon for additional confirmation. This MA can be changed to various forms Like EMA , SMA , WMA , HMA , RMA the open and close of the MA are plotted so it determines the exact Trend reversal of the price.
Credits to @Glaz QQE Threshold

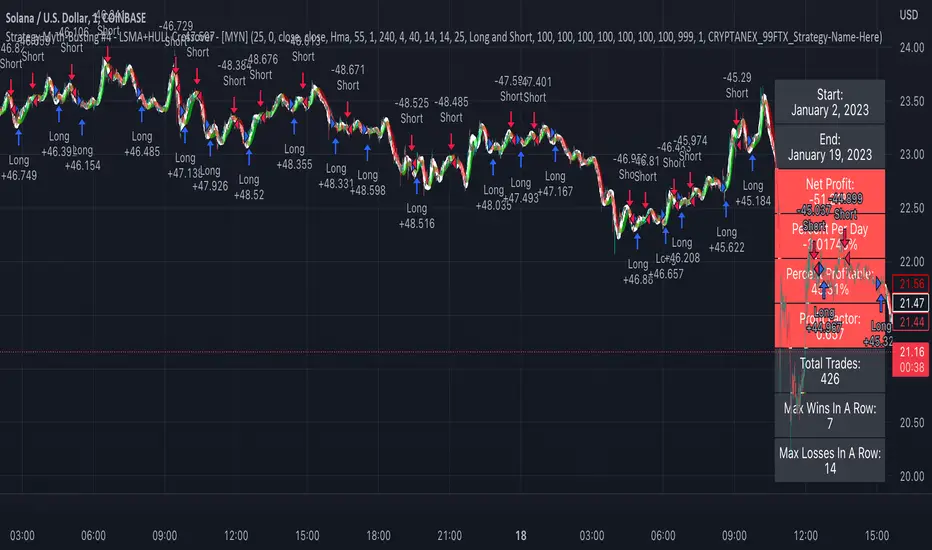
Strategy Myth-Busting #4 - LSMA+HULL Crossover - [MYN]This is part of a new series we are calling "Strategy Myth-Busting" where we take open public manual trading strategies and automate them. The goal is to not only validate the authenticity of the claims but to provide an automated version for traders who wish to trade autonomously.
Our fourth one we are automating is one of the strategies from "I Found The Best 1 Minute Scalping Strategy That Actually Works! ( Beginner Friendly )" from "Trade Domination" who claims to have made 366% profit on the 1 min chart of Solona despite having a 31% win rate in just a few weeks. As you can see from the backtest results below, I was unable to substantiate anything close to that that claim on the same symbol ( SOLUSD ), timeframe (1m) with identical instrument settings that "Trade Domination" was demonstrating with. Strategy Busted.
If you know of or have a strategy you want to see myth-busted or just have an idea for one, please feel free to message me.
This strategy uses a combination of 2 open-source public indicators:
LSMA
Hull Suite by InSilico
Trading Rules
1 min candles
Stop Loss on recent swing High/Low
1:5 Risk Ratio
Enter Long
LSMA cross above Red Hull Suite line
Price has to be above Hull Suite Line
Enter Short
LSMA crosses under green Hull Suite Line
Price has to be below Hull Suite Line
Strategy Myth-Busting #20 - HalfTrend+HullButterfly - [MYN]#20 on the Myth-Busting bench, we are automating the " I Found Super Easy 1 Minute Scalping System And Backtest It 100 Times " strategy from " Jessy Trading " who claims 30.58% net profit over 100 trades in a couple of weeks with a 51% win rate and profit factor of 1.56 on EURUSD .
This one surprised us quite a bit. Despite the title of this strategy indicating this is on the 1 min timeframe, the author demonstrates the backtesting manually on the 5 minute timeframe. Given the simplicity of this strategy only incorporating a couple of indicators, it's robustness being able to be profitable in both low and high timeframes and on multiple symbols was quite refreshing.
The 3 settings which we need to pay most attention to here is the Hull Butterfly length, HalfTrend amplitude and the Max Number Of Bars Between Hull and HalfTrend Trigger. Depending on the timeframe and symbol, these settings greatly impact the performance outcomes of the strategy. I've listed a couple of these below.
And as always, If you know of or have a strategy you want to see myth-busted or just have an idea for one, please feel free to message me.
This strategy uses a combination of 3 open-source public indicators:
Hull Butterfly Oscillator by LuxAlgo
HalfTrend by Everget
Trading Rules
5 min candles but higher / lower candles work too.
Stop loss at swing high/low
Take Profit 1.5x the risk
Long
Hull Butterfly gives us green column, Wait for HalfTrend to present an up arrow and enter trade.
Short
Hull Butterfly gives us a red column , Wait for HalfTrend to present a down arrow and enter trade.
Alternative Trading Settings for different time frames
1 Minute Timeframe
Move the Hull Butterfly length from the default 11 to 9
Move the HalfTrend Amplitude from the default 2 to 1
Enabling ADX Filter with a 25 threshold
2 Hour Timeframe
Move the HalfTrend Amplitude from the default 2 to 1
Laddered Take Profits from 14.5% to 19% with an 8% SL

HMA Slope OscillatorA Hull Moving Average (HMA) slope oscillator. It uses a HMA slope to identify up/down trends. Usage is simple: adjust the HMA and signal length according to your needs. Long orders start when the bar changes from under (the zero line) to over the zero line. You can also spot "early" long entries when the bar moves close to the zero line. Short orders should be placed when a red bar appears after blue bars (top of the mountain).
"Play" with the length to find the best settings for your trading strategy.
** I have not added alerts. If you need alerts just let me know and I will be happy to update this indicator.

LowLag Channel StochThis study is an experiment utilizing the Hull Filter technique applied to an exponential moving average that has a relatively low lag to analyze trend activity. The Hull method is adjusted by the length.
A modified stochastic is used to help confirm buy/sell opportunities. The stochastic limits of 0.2 and 0.8 may be adjusted.
The up/down arrows indicate buy/sell opportunities. At the color change a buy/sell condition is indicated. Confirmation is by the stochastic passing through the appropriate limits. A third confirmation should be considered.
The initial signals are occasionally repeated because of the wait for 2 time instants. This is included because some buy/sell opportunities were missed without the wait.

Hull Butterfly Oscillator [LuxAlgo]The Hull Butterfly Oscillator (HBO) is an oscillator constructed from the difference between a regular Hull Moving Average (HMA) and another with coefficients flipped horizontally.
Levels are obtained from cumulative means of the absolute value of the oscillator. These are used to return dots indicating potential reversal points.
Settings
Length: Number of past price inputs processed by the oscillator.
Levels Multiplier: Determine how far the levels are from 0.
Src: Input source of the indicator.
Usage
The oscillator can be used like most available oscillators. The sign of the HBO allows determining the current trend direction, while divergences with price might indicate potential reversals.
The displayed levels can additionally indicate whether the market is overbought or oversold. When the direction of the oscillator changes while being above the upper or lower level a red dot (if above upper level) or green dot (if under lower level) will be displayed, indicating a potential reversal.
Details
The name of the indicator is directly derived behind the coefficients used for its calculation. Displaying regular Hull coefficients alongside those flipped horizontally slightly resemble a butterfly, the difference between these sets of coefficients allows obtaining the HBO.
This operation allows to obtain a more structured impulse response, potentially giving less undesired performances on the frequency domain compared to simpler operation involving subtracting the HMA to a SMA, EMA or WMA.

RSI + MA, LinReg, ZZ (HH HL LH LL), Div, Ichi, MACD and TSI HistRelative Strength Index with Moving Average, Linear Regression, Zig Zag (Highs and Lows), Divergence, Ichimoku Cloud, Moving Average Convergence Divergence and True Strength Index Histogram
This script is based on zdmre's RSI script, I revamped a lot of things and added a few indicators from ParkF's RSI script.
Disable Labels in the Style tab and the histogram if you don't enlarge the indicator and it seems too small.
Look to buy in the oversold area and bounce of the support of the linear regression.
Look to sell in the overbought area and bounce of the resistance of the linear regression.
Look for retracement to the moving average or horizontal lines, and divergences for potential reversal.
RSI
The Relative Strength Index (RSI) is a well versed momentum based oscillator which is used to measure the speed (velocity) as well as the change (magnitude) of directional price movements.
Moving Average
Moving Average (MA) is a good way to gauge momentum as well as to confirm trends, and define areas of support and resistance.
Linear Regression
The Linear Regression indicator visualizes the general price trend of a specific part of the chart based on the Linear Regression calculation.
Zig Zag (Highs and Lows)
The Zig Zag indicator is used to identify price trends, and in doing so plots points on the chart to mark whenever prices reverse by a larger percentage point than a predetermined variable or marker.
Divergence
The divergence indicator warns traders and technical analysts of changes in a price trend, oftentimes that it is weakening or changing direction.
Ichimoku Cloud
The Ichimoku Cloud is a package of multiple technical indicators that signal support, resistance, market trend, and market momentum.
MACD and TSI Histogram
MACD can be used to identify aspects of a security's overall trend.
The True Strength Index indicator is a momentum oscillator designed to detect, confirm or visualize the strength of a trend.

RSI TrendRSI Hull Trend is a hybrid indicator with RSI of HULL Signal. The Hull MA is combined with RSI to see if the Hull MA Buy/Sell Signal is in overbought or oversold condition. Buy Sell Signals are plotted based on settings of OB/OS or RSI. This indicator is very useful to see if the Trend is in Exhaustion or Beginning of a Trend. Entry and Exit conditions can be more precise based on OB/OS condition of price action. In addition normal RSI trend is plotted with trend color from Hull MA. Best Performance with Heiken Ashi Candles.
OB/OS Settings provided
Hull Buy/Sell Signals plotted
Double RSI FAST and DEFAULT signal with crossover
Bar Color applied based on Hull RSI Trend
Hull Trend + RSI + Price Action

MTF EMA Ribbon & Bands + BBMulti Timeframe Exponential Moving Average Ribbon & Bands + Boillinger Bands
I used the script "EMA Ribbon - low clutter, configurable " by adam24x, I made some color change and I added a few indicators (Boillinger Bands, EMA on multi timeframe and EMA bands from "34 EMA Bands " by VishvaP).
The script can display various EMA from the chart's timeframe but also EMA from other timeframes.
Bollinger Bands and EMA bands can also be added to the chart.
