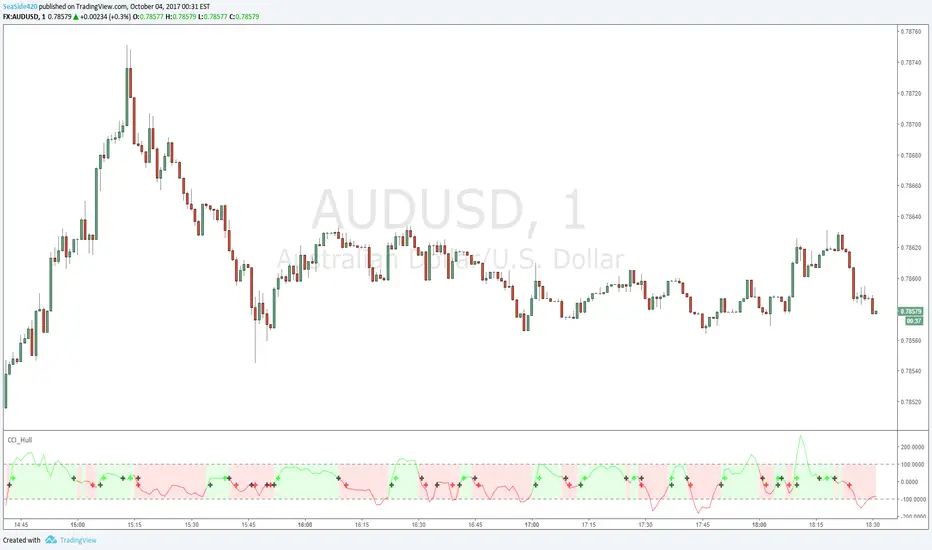
Hull Moving Average + Bollinger BandsThis study make use of Hull Moving Average and Bollinger Bands.
The crosses give signal about HMA and BB crossovers, they are a bit lagging, if you stare well you will spot them a little earlier. It look like a good idea to buy and sell when HMA is near or on the outside of the outer bands.
By default the Bollinger Bands uses Simple Moving Average with 21 periodes, and Hull Moving Average use 9 periodes. You can alter the settings in the format dialog.
Please use as pleased, and if you do something clever with it I'll be happy to know :D
Hull


Double HULL Moving AverageTHIS IS A COMBINATION OF TWO HULL MOVING AVERAGE LINES
-ONE WITH LONGER PERIOD
-OTHER WITH SHORTER PERIOD TO INDICATE BUY/SELL SIGNALS
AS THE KNOWN GENERAL RULE;
IT WOULD BE A BUY SIGNAL WHEN SHORTER(BLUE LINE) HULL CROSSES ABOVE LONGER (RED LINE) ONE
AND CONVERSELY A SELL SIGNAL WHEN LONGER HULL CROSSES ABOVE SHORTER ONE
THIS STUFF IS USEFUL FOR USERS COMPLAINING ABOUTREACHING THE MAXIMUM NUMBER OF INDICATORS :)
KıvanÇ
@fr3762 on twitter (only tweeting in TURKISH)
fr3762 on youtube for indicator explanations in TURKISH)
TURKISH EXPLANATION:
2 HULL hareketli ortalaması aynı grafikte:
Kısa periyotlu (mavi) olan uzunu yukarı kestiğinde AL
Uzun periyotlu (kırmızı) olan kısayı yukarı kestiğinde SAT sinyalleri üretir
Varsayılan periyotlar, birer Fibonacci sayıları olan 8 ve 21 olarak belirlenmiştir, değiştirilebilir.
İndikatör sayısı sınırlamasının önüne geçmek amacıyla geliştirilmiştir.

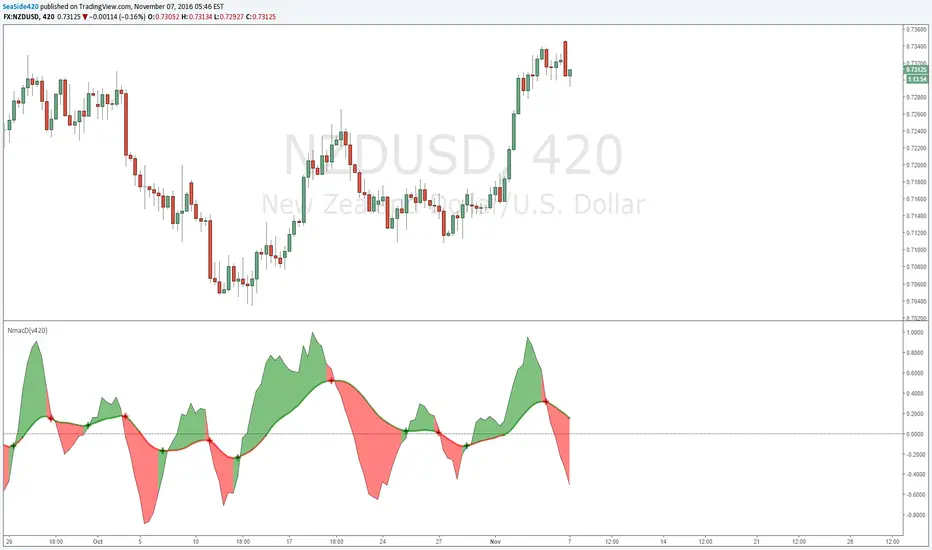
Hull MACD with Force Index Backcolorswww.tradingview.com
Like many other indicators this tells the past and it will dutifully follow the future price changes whatever they will be.
This is an upgrade of the "Hull Moving Average Convergence/Divergence" low lag indicator in my scripts. Added Elder Force Index (background colors) to include effects of Volume.
When EFI goes positive the background goes green, when it slopes up (more positive than previous bar) it is darker green. Negative red and slope down darker red.
I find it useful in all time frames but I use mostly hour and day. The direction color combined with price action and macd tell whether the volume supports the price movement and the shading (darker green for increasing up volume and darker red for increasing down volume) tells of the degree of support.
Since when the EFI is positive and dropping, for example, the price can be dropping with opposite for negative.
Dark shading tells where the EFI and possibly the price is headed (at the moment).
Light shading says to check more on other indications for likely direction.
Changed also the histogram color so it stands out of background and added hlines to make relative volatility and peak height easier to see.
Anyway help yourself if any of this code is useful to you, enjoy, happy trading and Keep Smiling!


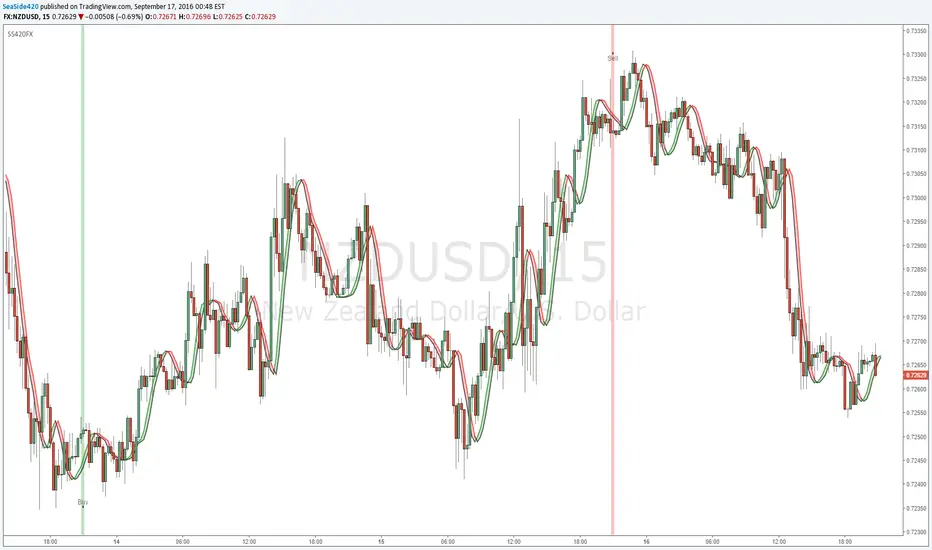
SS420FXTwo Moving_Average cross's & Daily_Candle cross
Based on Hull_MA
Developed by Alan Hull, it is an indicator, that solves the problem with making a moving average more reactive to current price activity. The Hull Moving Average almost eliminates lag and manages to improve smoothing.
The HMA manages to stick to rapid changes in price activity, as it has superior smoothing over a Simple Moving Average of the same period. The HMA employs Weighted Moving Averages (WMA) and dampens the smoothing effect. It can be calculated as follows:
HMA(n) = WMA(2*WMA(n/2) – WMA(n)), sqrt(n))
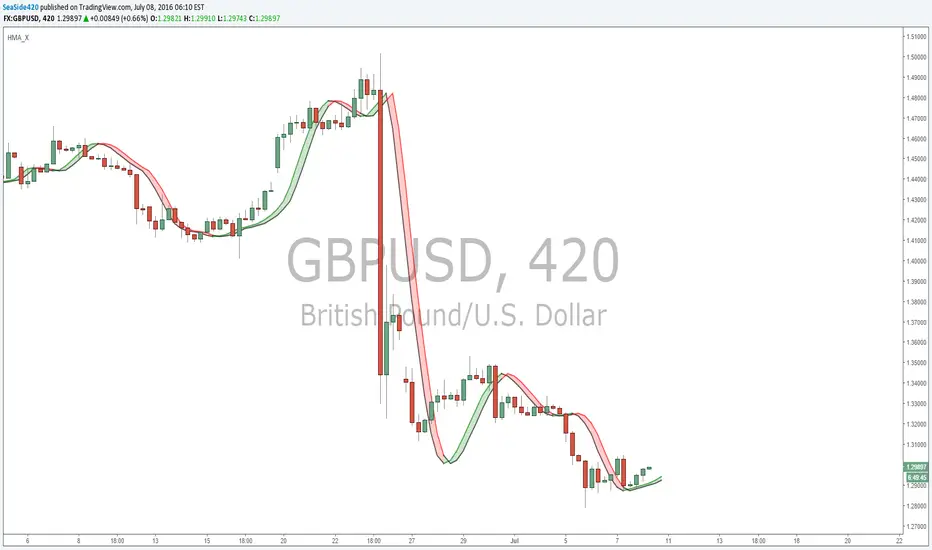

Indicator420double hull moving average crossover
hull moving average / volume weighted moving average crossover
Red dot = SELL
Green dot = BUY
or
Longest MA color change to green = BUY
Longest MA color change to red = SELL
by SeaSide420

Double HullMA CrossThe Hull Moving Average (HMA), developed by Alan Hull, is an extremely fast and smooth moving average. In fact, the HMA almost eliminates lag altogether and manages to improve smoothing at the same time. The Hull Moving Average solves the dilemma of making a moving average more responsive to current price activity whilst maintaining curve smoothness. (hoping in less false signals).
indicator doubles the input value to make the second HullMA value, then marks the crossover


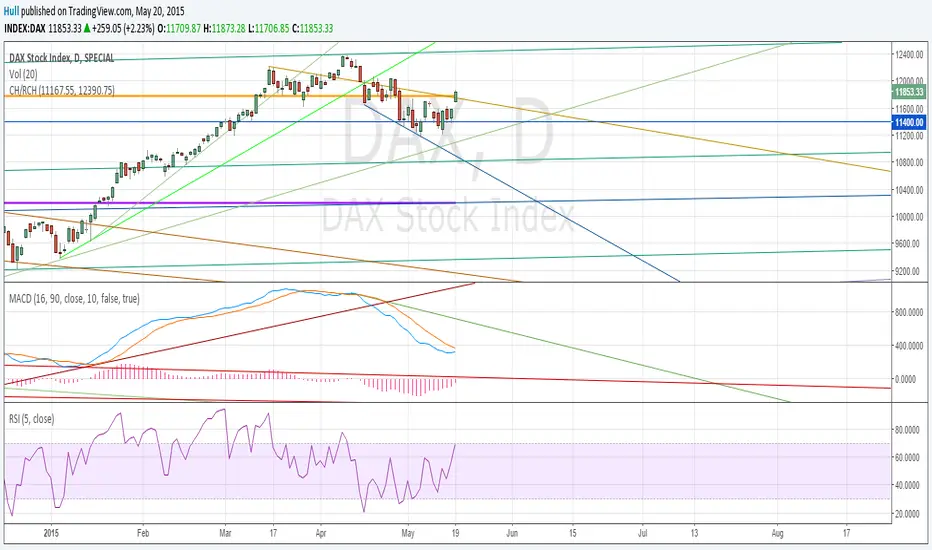
Code for Cup With Handle calculations (using Pine)Cup with Handle formation calculations using Pine.
First of all, ignore all other lines in the example chart except the two FAT lines. The two fat lines are the ones that define the Cup With handle or in the example chart: a Reversed Cup With Handle.
Note: Handle does not always develop and sometimes the final target price is reached without forming any handle.
This script can calculate both Cup With Handle ( CH ) and Reversed Cup With Handle ( RCH ). Just order the input values accordingly.
For more information about Cup With Handle, use google:
www.google.se
The script need two input parameters : The highest price in the Cup formation and the lowest price in the cup formation or vice versa for the Reversed Cup formation.
Best regards,
/Hull, 2015.05.20.16:31
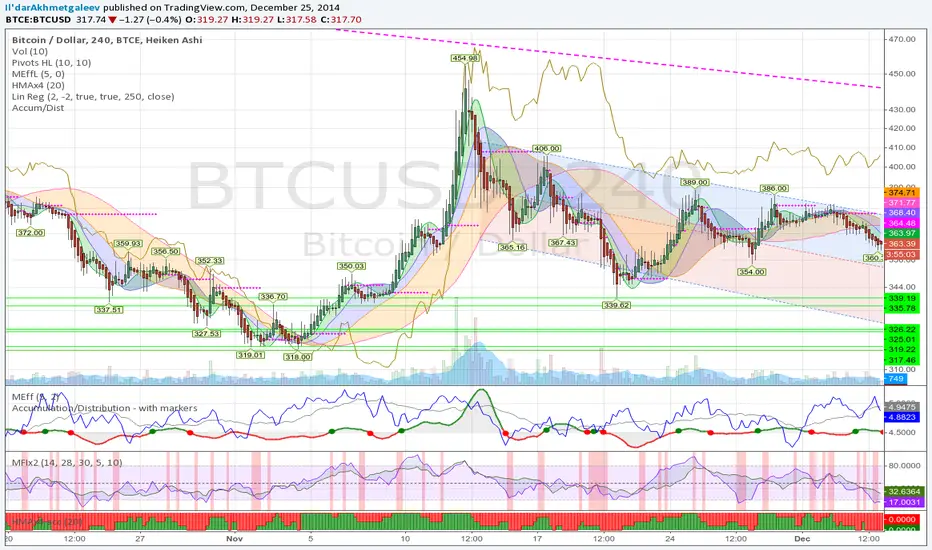
Hull MA x4 accbuy when bars turns from red to middle green and sale when values become middle red
do not wrok on side move