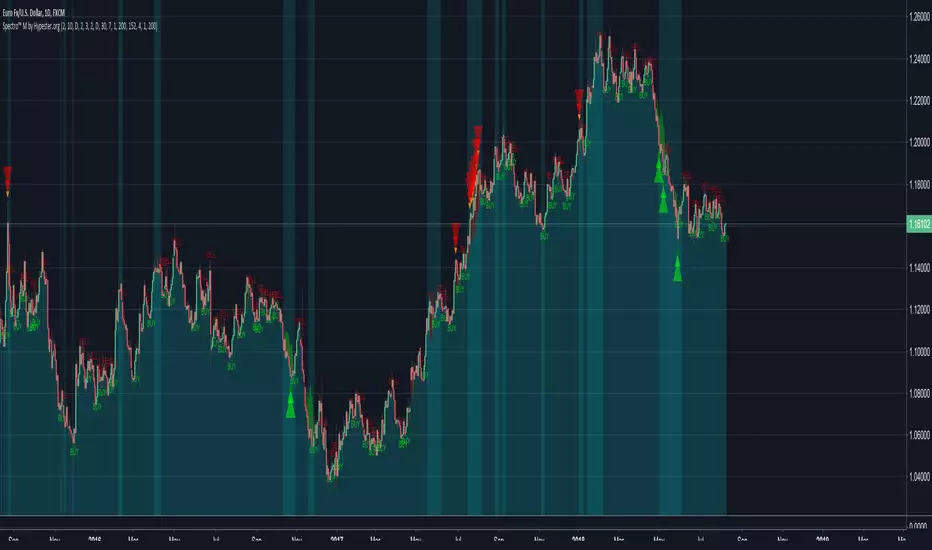
Spectro™ ScreenerNow Spectro™ technology helps you find and trade several assets with one look.
08/08/18 - Beta test v1 is published
Indicators
KenjiKenji
Class : average analysis
Trading type : intraday
Time frame : 4H
Purpose : work in trend
Level of aggressiveness : standard
Indicator «Kenji» is a brand new look on the average analysis. The main problem of most of the trading strategies and indicators based on average analysis is a number of false signals in case of flat (for example frequent crossing of the averages, frequent changes of the average direction etc). As the result average analysis can’t show its real power and effectiveness.
Indicator «Kenji» using a unique algorithm allows avoiding the most common traps of the average analysis and significantly increasing the quality of the signals.
It generates signals for the comfort trading in local trend. Indicator provides information both on timing of the position entry and timing on profit fixation. Also it helps to determine the level of aggressiveness of the concrete signal. This makes «Kenji» indicator a very useful tool for amateur and experienced traders.
Structure of the indicator
Indicator consists of colored zones and level lines:
- colored zones (marked blue, red or green) – used for color identification of the trading possibilities and to detect the entry points;
- level lines (marked red and blue depending on current price direction) – used for color identification of the fact that current price direction is up/down.
To ease the trading process indicator displays on the chart “buy” and “sell” signals. These signals are divided into 2 groups: standard (trading with basic lot size) and aggressive (trading with double basic lot size). Take-profit zones are also displayed on the chart. They are represented with the blue/red x-crosses. Red x-crosses show zones where profits on “sell” positions should be taken. Blue x-crosses show zones where profits on “buy” positions should be taken.
Input parameters of the indicator
To set up the indicator a number of input parameters are used:
- Slow Average Period – period of the slow average. The bigger the period is the more conservative reaction of the average for the price changes are.
- Fast Average Period - period of the fast average. The bigger the period is the more conservative reaction of the average for the price changes are.
- Correlation Period – period used in correlation analysis to calculate the level of interconnection between the averages.
Rules of trading
When signal “buy”/”sell” is appeared on the chart corresponding trade should be opened.
Profit for “sell” position should be fixed when the red x-cross appears on the chart. Profit for “buy” position should be fixed when the blue x-cross appears on the chart.

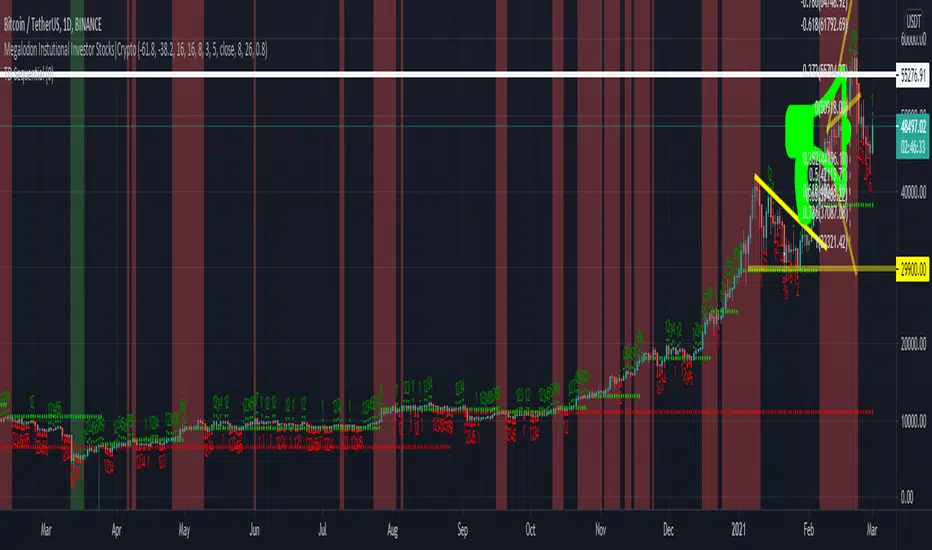
iPyra◬_theMegalodonTHEMEGALODON
theMegalodon looks for the institutional finger prints, the whales or the big boys.
theMegalodon is really simple to use.
theMegalodon combines the 8 different unique indicators, that each have almost perfect success rate.
theMegalodon works with any kind of market state, any kind of trading, and any kind of asset.
theMegalodon has more features than any other indicator in the market: Out of 9 working indicators, we have 3 momentum, 3 price and 3 volume indicators showing you the best signals.
--------------------------------------
theMegalodon is designed for us, the small fishes in the ocean, the millennials, the college students. This will basically makes us the new Megalodons(whale hunters).
All you have to do is:
1- Look for green or red arrows.
2- Look for orange or red candles.
3- Repeat
--------------------------------------
TECHNICAL DETAILS
Some boring info that you don't necessarily need to know.
1- Draws fibonacci retracement (s)' levels depending on your preferred look back period (Default: 365 and 120)
i) Can draw 2 fibs on the same chart. Can reverse the fib levels. Even, add an additional fib level to look for.
ii) Automatic fill function for a Reload Zone inside of a Reload Zone. *61.8% levels to 100% levels or 0% levels
2- Changes the color of the candle when strong buy(orange) or strong sell(red). Draws arrows on the chart for long and short positions.
i) Analyses and Combines
a) Price
b) Momentum
c) Volume
3- Prints out the indicators that are either giving Short or Long signs on the right corner.
4- The closer the unclebo indicator(click enable UncleBo) gets to the All time high, the better buy it is.
i) Same with the other way around. The closer it gets to the 0, the better sell it is.
5- Draws Bollinger Bands on the chart and shows where to buy or sell
6-The indicator is designed to be used in Daily time frame for the best calls to short or long.
--------------------------------------------------
iPyra◬
Enlighten others
DepthHouse Relative Momentum Range OscillatorDepthHouse Relative Momentum Range Oscillator uses several calculations between the relative momentum and range to help determine trend direction and strength.
Breakouts above the adjustable horizontal zone often serve as a bullish confirmation, while breakout below the horizontal zone often serve as a bearish confirmation.
Crosses of gold and yellow signal line represent trend consolidation and/or possible reversal zones.
How to get:
As you can see this is an invite only script. In the coming month this indicator, along with many others will become pay to use only. (website on my profile page)
However all my indicators will be FREE until May 1, 2018 . So please try them out!
To take advantage of this FREE trial :
1. Leave comment on this indicator post! Maybe even give me a follow :D
2. Check out and take advantage of all my other indicators!
I hope you all enjoy!
Notes:
Signals Beta:
Both functions give possible buy and sell signals shown by the circles in the middle. The strength of the signal is shown by the circle size. The larger the circle, the stronger the signal.
This feature is in beta testing is not advised to trade off of.
Altering the Multi-Factor will adjust the dotted signals at the bottom.
This is a heavily modified version of my DepthHouse Envelope Oscillator


4 EMA's in oneAnother useful script I've been experimenting with. 4 EMA's in one!
Red = 200
Orange = 100
Yellow = 50
Blue = 25
Color coded in order of their respective frequencies.
Right now it's as plain and simple as you can get. Only inputs you can change are the average values.
Will update upon request and popularity.
Happy new year and God bless!

PRO Sinewave - BETAThis is a BETA version. Which means that there might be unstability, errors...
I just decided to create this separate version of the indicator in order to let people test & give reviews before pushing the actual release to the public version.
This versions will be more "advanced" but can be less reliable.. Choose wisely !
THIS SCRIPT ACCESS WILL ONLY BE GRANTED TO SUBSCRIBED USERS... (infos on the public release) So please don't post comments to ask for unlocking !
LINK TO THE PUBLIC RELEASE
Don't forget to hit the like/follow button if you feel like my work deserves it ;)
You can check my other indicators via my TradingView's Profile : @PRO_Indicators
Bests,
Phil

DepthHouse-MaxADXDepthHouse's MaxADX is 1 of 3 indicators that will be available for purchase via subscription come Jan 2018.
This indicator combines the use of directional information and smoothed moving averages to help traders indicate trend reversals and strengthening trends. As you can see in the chart above this indicator makes it very easy to spot trend reversals in trending markets.
Where this indicator falls short unfortunately, is its use in ranging markets.
This is a great indicator for all beginners and professionals who prefer to trade in volatile markets such as cryptocurrencies.
This indicator package will come with 3 indicators:
MaxADX
Premium oscillator to help spot forming trends and reversals.
MaxADX Signals
Taking MaxADX a step farther by creating an overlay that show possible trend strengthening and reversals via bar colors and shapes.
ATRBands
Like Bollinger Bands, this indicator is uses to help spot breakouts, and overbought/sold areas.
How to get:
To qualify for the trial period which ends January, 1st 2018, please go to the link in my bio and click subscribe!
You will then be sent directions for your account to be added to the whitelist.

Crypto-Adjusted Relative Strength Index (CARSI)This RSI can be applied to any Crypto-currency and ANY time-frame!
Great for use on alt coins to identify moons.
Request use in the comments :)
This RSI is adjusted to give weight to the performance of the 6 largest Cryptocurrencies by market-cap.
This is the Crypto-Index that affects the moving average.
Bitcoin
Ethereum
Bitcoin Cash
Ripple
Litecoin
Nem Coin.
The use of this indicator is to observe divergence between the price of the underlying asset that is the basis of your chart, and the rest of the Crypto-currency market.
The black line is the Relative Strength Index performance of the Crypto-Index, and the red and blue clouds, show how far the Crypto-Index sits away from the Relative Strength Index of the observed chart.
If more Crypto-currencies go down while your observed currency goes up, the CARSI will sit lower and a blue pool will become visible showing that that the chart is performing better than the Crypto-Index listed above. If more Crypto-currencies go up while your observed currency goes down, the CARSI will sit higher and a red cloud will form, showing that the chart is performing worse than the Crypto-weighted Index.
The indicator uses only one variable that can be changed.
"RSI_Length" = This is the length of the RSI and is set to 15 by default.


Simpler Trading 10x BarsKnow whether to look for explosive buy setups, implosion sell setups, or to stay out of ‘fake out’ congestion zones.
Plus, know when volume is at least 50% above average to identify moves with home run potential. Currently this indicator is compatible with Think or Swim and TradeStation.

Mongerskit Trading System v2.3 lower time frame FIXI had numerous requests and complains on why signals are only generated on larger time frames. (rarely 4hr and mostly daily and weekly time frames)
Now the sensitivity of signals generated can be manually adjusted to work on all time frames.
It is advisable to play around with the sensitivity on your favorite time frame to get a combination that works for you.
Currently we see GBPUSD on hourly time frame at 55 sensitivity which shows a profitable system.
here is a image of a lower sensitivity on 15min TF
(USABILITY)
- Use this system in conjunction to your technical analysis to achieve optimal performance.
- Best time frame is 4 hours and 12 hours on default settings, for 1 hour time frame, sensitivity of 55 has been tested to work, feel free to change sensitivity to something that works for you.
- DO NOT use the system with pairs that are consolidating.
(CHANGES)
v2.3
- Added sensitivity input, users can configure sensitivity to get buy/sell signals on lower time frames.
v2.2
- final tweaks are done to this revision
- few appearance changes
- minor reported bug fixes
v2.1
- changed the sensitivity a little more.
- fixed all the reported bugs and issues
- fixed a problem with chart scaling down when using the indicator
- fixed some typo with signal text
v2.0
- changed the sensitivity and few settings, signals are much more accurate.
- made a few appearance changes.
- Signals may appear less then before but they are much more accurate, use 4 hour and 12 hours together to determine best entry.
- this is the Dark theme, I will release the Light theme too for the ones using lighter background colors.
v1.1
- fixed the amount of times the signals are shown
- fixed some color issues
v1.0
- First free version open to public
This Indicator is not a free indicator, you can request to try the indicator in the comment section below and I will selectively give users access temporarily to try the indicator.
Feel free to message me about any questions related to the indicator.
www.uidubai.net

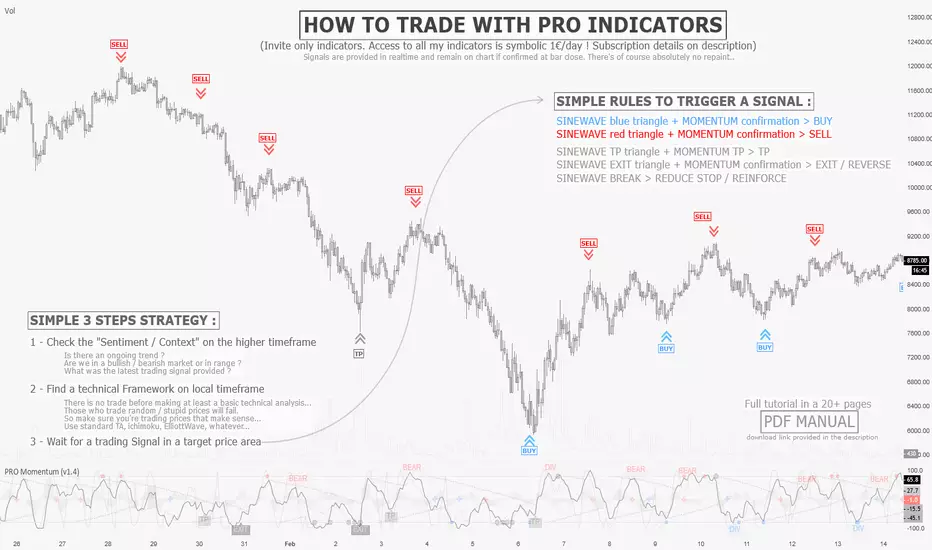
PRO MomentumINVITE ONLY SCRIPT:
FEATURES:
As its name suggests, PRO Momentum provides non-subjective momentum analysis to traders through automatic pattern detections, covering a wide range of statistically relevant structures in both ranging and trending contexts. Our goal was to provide a professional grade risk management tool capable of providing various signals, which guide the trader in its decision to engage or not in a certain price area filtered by Framework. Nevertheless, both indicators are complex tools requiring extensive learning. To support students in their journey, there is a wide open online community of users in our Discord channel, providing peer-to-peer assistance to progress with the strategy as well as tutored courses.
OUTPUTS:
To share a brief description of the PRO Momentum functioning, we will scroll through the major set of outputs that are presented to the user. Please note that the indicator is meant to assist from Junior to Senior expertise, to achieve this we have set different base templates right into the indicators. To keep this description simple, we will present the outputs you’ll see with the beginner setup:
Momentum Signals: As shown on the chart, there are multiple types of output signals, each corresponding to different momentum patterns. Detailed documentation is available on our website for those seeking in-depth information. Here's a high-level overview: The patterns are divided into three categories, each represented by different colors. Blue and Red signals are used in trending contexts, Gray signals are for ranging contexts, and dark-colored signals are exclusive to reversal contexts, suitable for more experienced traders. Momentum signals are binary outputs, making it easy for users to set alerts. The indicator includes built-in alerts for these groups to streamline the process. However, it’s crucial to remember that momentum signals are not standalone trading signals. The Framework indicator must first filter interesting prices and identify the context. Only then should traders use momentum signals to adjust risk.
Sinewave Oscillators: Cyclical analysis is a critical aspect of professional risk management. Markets naturally oscillate, and significant statistical probabilities can be derived from cycle studies. We use a custom-modified version of Ehlers’ sinewave methodology. Cyclical analysis, while somewhat predictive, scans past prices to predict probable future states. Since markets are inherently unpredictable, cycle analysis is used as a confirmation signal in our strategy. Essentially, we filter out all momentum signals that occur outside favorable cyclical conditions. Bearish signals are only exploited if the sinewave is in the top area of the oscillator, and vice-versa for bullish signals.
GENERAL STRATEGY:
Overall, the PRO Strategy combines two “core” indicators, Framework and Momentum. Framework is plotted on the main chart section as an overlay, it is definitely the most important as it guides the user through the hard process of filtering prices and timeframes that are suitable for technical analysis. On the other hand, PRO Momentum is on a separate oscillator tab under the chart section, it will study the momentum and cyclical structure, also offering automated pattern detection. Ultimately, our strategy is based on collecting and processing non-subjective rules, emanating from the indicators outputs. Essentially, this means that the indicator actually takes care of producing all the necessary binary outputs, leaving you with the remaining task of combining them correctly following the strategy’s patterns.
RISK LIMITATION:
Even if we provide automated momentum signal detection, there is no “one-click” or "easy-win” solution, the user still needs to carefully review the elements. When applicable pattern rules are confirmed, the user will gather risk-limitation information from both indicators (breakout targets, price confirmations, momentum and cyclical coordination) and decide whether or not to trade according to its own risk profile. If so, the position sizing, stop-loss positioning, risk management and profit targets will all be defined according to the same indicator’s outputs. This effectively suppresses most behavioral and personal biases the trader could introduce, creating a stable and statistical risk management structure aiming for a durable profitability.

Volume Conversion IndicatorVolume Conversion Indicator
The volume conversion indicator is much like the in-built volume indicator. This particular volume indicator allows you to find out how much of something has been traded in a given timeframe.
This is done by multiplying volume by the average price at that point.
What does this mean?
Well, say, for example, you were watching DGB/BTC (DigiByte/Bitcoin). Instead of the volume being displayed in the amount of DGB traded, the amount of BTC traded is displayed instead.
Feel free to comment... Hope this helps :D

Pullback Trading Tool R5-65 by JustUncleLBy request this is an updated version of the "PullBack Trading Tool": removes experimental "OCC" channel, added option to display ribbons or just single moving average lines, added alert arrows for "PB" exits, added alertcondition for TV alarm subsystem, added some extract options for Pivot points and general cleanup of code.
Description:
This project incorporates the majority of the indicators needed to analyse and trade Trends for Pullbacks, swings and reversals.
Incorporated within this tool are the following indicators:
1. Major industry (Banks) recognised important EMAs in an EMA Ribbon:
Lime = EMA5 (Optional Display)
DodgerBlue = EMA12 (Optional Display)
Red = EMA36 (Optional display)
Green = EMA89
Blue = EMA200
Black = EMA633
2. The 5 EMA (default) High/Low/Close Price Action Channel (PAC), the PAC channel display is disabled by default.
3. Optionally display Fractals and optional Fractal levels
4. Optional HH, LH, LL, HL finder.
5. Optional Buy/Sell "PB" exit Alerts with Optional 200EMA filter.
6. Coloured coded Bar high lighting based on the PAC:
blue = bar closed above PAC
red = bar closed below PAC
gray = bar closed inside PAC
7. Alert condition sent to TradingView's Alarm subsystem for PB exits.
8. Pivot points with optional labels.
9. EMA5-12 Ribbon is displayed by default.
10.EMA12-36 Ribbon is displayed by default
Set up and hints:
I am unable to provide a full description here, as Pullback Trading incorporates a full trading Methodology, there are a number of articles and books written on the subject.
Set the chart to Heikin Ashi Candles (optional).
I also add a "Sweetspot Gold R3" indicator to the chart as well to help with support and resistance finding and shows where the important "00" lines are.
First on a weekly basis say Sunday night or Monday morning, analyse the Daily and Weekly charts to establish overall trends, and support/resistant levels. Draw significant mini trend lines (2/3 TL), vertical trend lines (VTL) and S/R levels. Can use the Pivots points to guide VTL drawing and Fractals to help guide 2/3 TL drawing.
Once the trend direction and any potential major reversals highlighted, drop down to lower timeframe chart and draw appropriate mini Trend line (2/3 TL) matching the established momentum direction. Take note of potential pull backs from and of the EMAs, in particular the EMA5-12 ribbon, EMA12-36 Ribbon and the 200EMA. Can use the Pivots and/or Fractals points to guide your 2/3 TL drawing.
Set a TradingView alarm on the "PBTOOL alert", with the default settings this normally occurs before or during the Break of the manually drawn TL lines.
Once alerted check to see if the TL is broken and is returning to trend away from the EMA lines, this is indicated by bar colour change to trend directional colour.
You can trade that alert or drop down to even lower time frames and perform the same TL analysis there to find trades at the lower TF. Trading at lower TF you will allow tighter Stop loss settings.
Other than the "SweetSpot Gold R3" indicator, you should not need any other indicator to successfully trade trends for Pullbacks and reversals. If you really want another indicator I suggest a momentum one for example: AO ( Awesome Oscillator ), MACD or Squeeze Momentum.


Currency Relative Strengths V.2 [GM]Version 2 Updates
Speed has been increased by ~7X
Highest and lowest pairs now highlighted using brighter colors
Re-ordered pairs from highest to lowest 'flight to risk' rating
I created this tool for the purpose of determining strongest and weakest currencies over different periods of time. Each major currency is compared to the field of other majors and its average change is measured over a predetermined period of time. The result is displayed as a percentage. I use it for trend following but it can also be used to fade exhaustion.
Instructions
Add indicator to chart
Select a time frame under settings
Place cursor over period of interest
Click "Data Window" on right hand side bar
View % change avg values for each currency

Currency Relative Strengths [GM] - Data IndicatorI created this tool for the purpose of determining strongest and weakest currencies over different periods of time. Each major currency is compared to the field of other majors and its average change is measured over a predetermined period of time. The result is displayed as a percentage. I use it for trend following but it can also be used to fade exhaustion.
Instructions
Add indicator to chart
Select a time frame under settings
Place cursor over period of interest
Click "Data Window" on right hand side bar
View % change avg values for each currency

Scalping PullBack Tool R1 by JustUncleLDescription
This study project is a Scalping Pullback trading Tool that incorporates the majority of the indicators needed to analyse and scalp Trends for Pull Backs and reversals on 1min, 5min or 15min charts. The set up utilies Heikin Ashi candle charts. Incorporated within this tool are the following indicators:
1. Major industry (Banks) recognised important EMAs in an EMA Ribbon:
Green = EMA89
Blue = EMA200
Black = EMA633
2. The 36EMA (default) High/Low+Close Price Action Channel (PAC).
3. Fractals
4. HH, LH, LL, HL finder to help with drawing Trend lines and mini Trend Lines.
5. Coloured coded Bar high lighting based on the PAC:
blue = bar closed above PAC
red = bar closed below PAC
gray = bar closed inside PAC
red line = EMA36 of bar close
Setup and hints:
Set the chart to Heikin Ashi Candles.
Add "Sweetspot Gold10" indicator to the chart as well to help with support and resistance finding and shows where the important "00" and "0" lines are.
When price is above the PAC(blue bars) we are only looking to buy as price comes back to the PAC
When price is below the PAC(red bars), we are only looking to sell when price comes back to the PAC
What we’re looking for when price comes back into the PAC we draw mini Trendlines utilising the Fractals and HH/LL points to guide your TL drawing.
Now look for the trend to pull back and break the drawn TL. That's is when we place the scalp trade.
So we are looking for continuation signals in terms of a strong, momentum driven pullbacks (normally short term 10-20 pips) of the EMA36.
The other EMAs are there to check for other Pullbacks when EMA36 is broken.
Other than the SweetSpot Gold10 indicator, you should not need any other indicator to scalp the pullbacks.
References:
Fractals V8 by RicardoSantos
Price Action Trading System v0.3 by JustUncleL
SweetSpot Gold10 R1 by JustUncleL
www.swing-trade-stocks.com
www.forexstrategiesresources.com

reallifetrading.com DeanMA + vwap w/ 50+200 smaThis script functions in 2 modes, "intraday" & daily/weekly/monthly.
By changing your chart to any "intraday" timeframe, this mode will automatically switch based on which timeframe you are view on your TradingView charts.
INTRADAY: the script will show the "Dean Moving Average" (10ema on 15/min). NOTE: This 10ema on 15/min will calculate correctly even if using a 5 min chart.
DAILY/WEEKLY/MONTHLY: the script will show the 50 sma in green and 200 sma in purple. If you are viewing a daily chart, it will show the 50-daily sma, if you are viewing a weekly chart, it will show the 50-week sma, etc.
Any questions: DM me

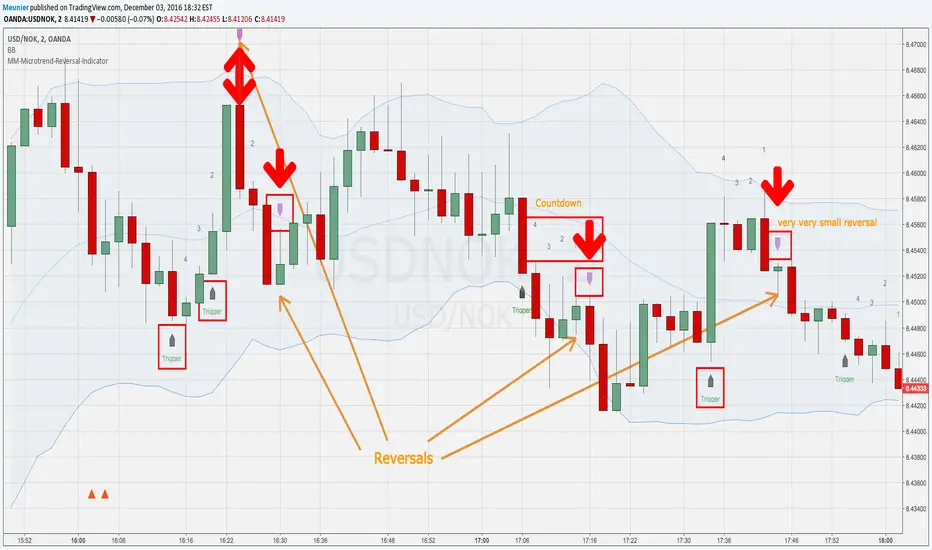
MM-Microtrend-Reversal-IndicatorThis indicator detects microtrend reversals based on crossings of the DMI+ and DMI- signals
It indicates the trigger event on the chart as well as the reversal candle
In addition to that it shows a countdown above the bars
This is helping when multiple reversals occur.
Important: when the Bollinger Bands are crossed in the previous bars it's possible that the prognosted reversal will NOT show up
Recommended timeframes are M1 and M2
Avoid trading sideway trends, the reversals are low and reversal triggers and assumed reversal candles could get chaotic sometimes