Modern Economic Eras DashboardOverview
This script provides a historical macroeconomic visualization of U.S. markets, highlighting long-term structural "eras" such as the Bretton Woods period, the inflationary 1970s, and the post-2020 "Age of Disorder." It overlays key economic indicators sourced from FRED (Federal Reserve Economic Data) and displays notable market crashes, all in a clean and rescaled format for easy comparison.
Data Sources & Indicators
All data is loaded monthly from official FRED series and rescaled to improve readability:
🔵 Real GDP (FRED:GDP): Total output of the U.S. economy.
🔴 Inflation Index (FRED:CPIAUCSL): Consumer price index as a proxy for inflation.
⚪ Debt to GDP (FRED:GFDGDPA188S): Federal debt as % of GDP.
🟣 Labor Force Participation (FRED:CIVPART): % of population in the labor force.
🟠 Oil Prices (FRED:DCOILWTICO): Monthly WTI crude oil prices.
🟡 10Y Real Yield (FRED:DFII10): Inflation-adjusted yield on 10-year Treasuries.
🔵 Symbol Price: Optionally overlays the charted asset’s price, rescaled.
Historical Crashes
The dashboard highlights 10 major U.S. market crashes, including 1929, 2000, and 2008, with labeled time spans for quick context.
Era Classification
Six macroeconomic eras based on Deutsche Bank’s Long-Term Asset Return Study (2020) are shaded with background color. Each era reflects dominant economic regimes—globalization, wars, monetary systems, inflationary cycles, and current geopolitical disorder.
Best Use Cases
✅ Long-term macro investors studying structural market behavior
✅ Educators and analysts explaining economic transitions
✅ Portfolio managers aligning strategy with macroeconomic phases
✅ Traders using history for cycle timing and risk assessment
Technical Notes
Designed for monthly timeframe, though it works on weekly.
Uses close price and standard request.security calls for consistency.
Max labels/lines configured for broader history (from 1860s to present).
All plotted series are rescaled manually for better visibility.
Originality
This indicator is original and not derived from built-in or boilerplate code. It combines multiple economic dimensions and market history into one interactive chart, helping users frame today's markets in a broader structural context.
Inflation

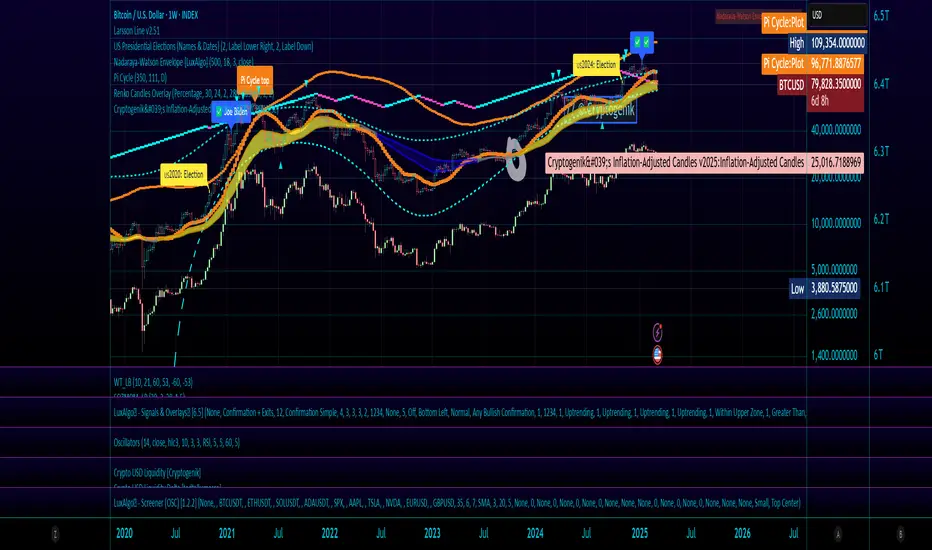
Cryptogenik's Inflation-Adjusted Candles v2025Inflation-Adjusted Price Indicator by Cryptogenik
This indicator adjusts price data for inflation, allowing you to visualize how stock/asset prices would look with constant purchasing power. By using Consumer Price Index (CPI) data from FRED, it transforms nominal prices into inflation-adjusted values that reflect real-world purchasing power.
What This Indicator Does
The Inflation-Adjusted Price indicator converts traditional price charts to show what prices would be if the purchasing power of currency remained constant. This is essential for long-term analysis, as it removes the distortion caused by inflation when comparing prices across different time periods.
Key Features
Displays inflation-adjusted price candles alongside original prices
Uses official CPI data from the Federal Reserve (FRED:CPIAUCSL)
Allows easy comparison between nominal and real prices
Helps identify true price movements by filtering out the effects of inflation
Perfect for long-term investors and macroeconomic analysis
How To Use It
Apply the indicator to any chart
Green/red candles show the inflation-adjusted prices
Gray line shows the original unadjusted price
The information label displays the current CPI value
This indicator is particularly valuable for analyzing stocks, commodities, and other assets over periods of 5+ years, where inflation effects become significant. It helps answer the question: "Has this asset truly increased in value, or is the price increase just reflecting inflation?"
Technical Details
The indicator calculates adjusted prices using the formula: (price / CPI) * 100, which effectively shows prices as a percentage of current purchasing power. This approach normalizes all prices to a consistent standard, making historical comparisons more meaningful.
Cryptogenik's Inflation-Adjusted Candles v2025
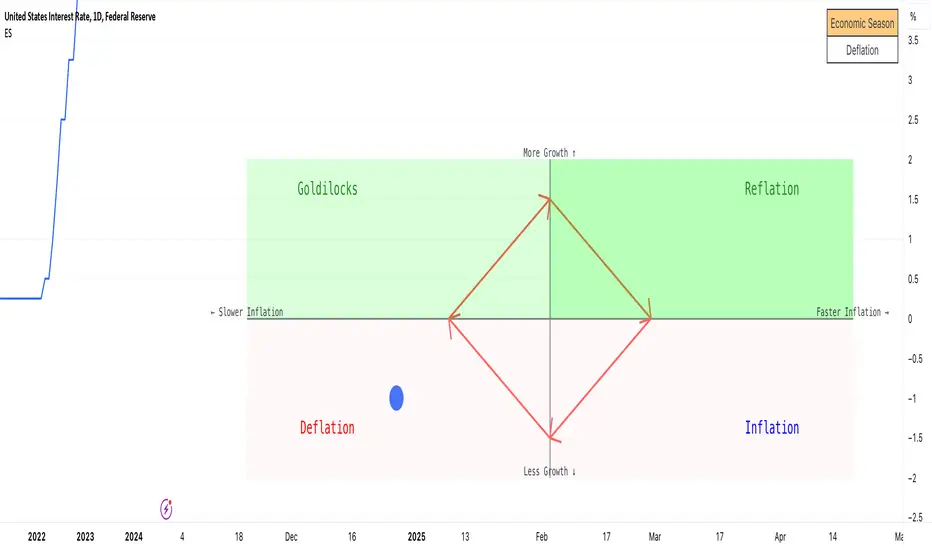
Economic Seasons [Daveatt]Ever wondered what season your economy is in?
Just like Mother Nature has her four seasons, the economy cycles through its own seasons! This indicator helps you visualize where we are in the economic cycle by tracking two key metrics:
📊 What We're Tracking:
1. Interest Rates (USIRYY) - The yearly change in interest rates
2. Inflation Rate (USINTR) - The rate at which prices are rising
The magic happens when we normalize these values (fancy math that makes the numbers play nice together) and compare them to their recent averages. We use a lookback period to calculate the standard deviation and determine if we're seeing higher or lower than normal readings.
🔄 The Four Economic Seasons & Investment Strategy:
1. 🌸 Goldilocks (↑Growth, ↓Inflation)
"Not too hot, not too cold" - The economy is growing steadily without overheating.
BEST TIME TO: Buy growth stocks, technology, consumer discretionary
WHY: Companies can grow earnings in this ideal environment of low rates and stable prices
2. 🌞 Reflation (↑Growth, ↑Inflation)
"Party time... but watch your wallet!" - The economy is heating up.
BEST TIME TO: Buy commodities, banking stocks, real estate
WHY: These sectors thrive when inflation rises alongside growth
3. 🌡️ Inflation (↓Growth, ↑Inflation)
"Ouch, my purchasing power!" - Growth slows while prices keep rising.
BEST TIME TO: Rotate into value stocks, consumer staples, healthcare
WHY: These defensive sectors maintain pricing power during inflationary periods
4. ❄️ Deflation (↓Growth, ↓Inflation)
"Winter is here" - Both growth and inflation are falling.
BEST TIME TO: Focus on quality bonds, cash positions, and dividend aristocrats
WHY: Capital preservation becomes key; high-quality fixed income provides safety
🎯 Strategic Trading Points:
- BUY AGGRESSIVELY: During late Deflation/early Goldilocks (the spring thaw)
- HOLD & ACCUMULATE: Throughout Goldilocks and early Reflation
- START TAKING PROFITS: During late Reflation/early Inflation
- DEFENSIVE POSITIONING: Throughout Inflation and Deflation
⚠️ Warning Signs to Watch:
- Goldilocks → Reflation: Time to reduce growth stock exposure
- Reflation → Inflation: Begin rotating into defensive sectors
- Inflation → Deflation: Quality becomes crucial
- Deflation → Goldilocks: Start building new positions
The blue dot shows you where we are right now in this cycle.
The red arrows in the middle remind us that this is a continuous cycle - one season flows into the next, just like in nature!
💡 Pro Tip: The transitions between seasons often provide the best opportunities - but also the highest risks. Use additional indicators and fundamental analysis to confirm these shifts.
Remember: Just like you wouldn't wear a winter coat in summer, you shouldn't use a Goldilocks strategy during Inflation! Time your trades with the seasons. 🎯
Happy Trading! 📈
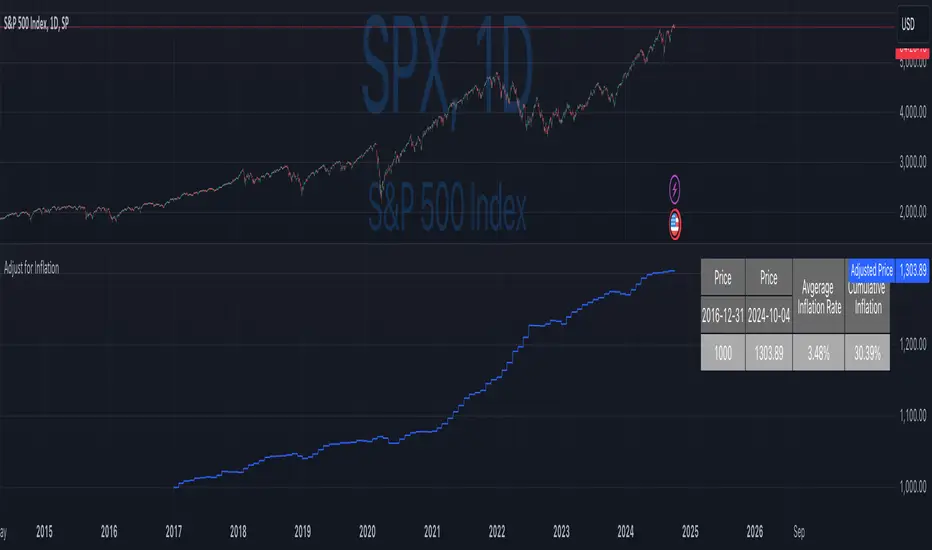
Inflation-Adjusted Price IndicatorThis indicator allows traders to adjust historical prices for inflation using customizable CPI data. The script computes the adjusted price by selecting a reference date, the original price, and the CPI source (US CPI or custom input) and plots it as a line on the chart. Additionally, a table summarizes the adjusted price values and average and total inflation rates.
While the indicator serves as a standalone tool to understand inflation's impact on prices, it is a supportive element in more advanced trading strategies requiring accurate analysis of inflation-adjusted data.
Disclaimer
Please remember that past performance may not be indicative of future results.
Due to various factors, including changing market conditions, the strategy may no longer perform as well as in historical backtesting.
This post and the script don’t provide any financial advice.
US Market Real Value Adjusted for CPI and Dollar IndexUS Market Real Value Adjusted for CPI and Dollar Index
Provides quick access to this formula: (SP:SPX+NASDAQ_DLY:IXIC+TVC:DJI+CAPITALCOM:RTY)/4/(ECONOMICS:USCPI*TVC:DXY*100)
Overview:
This indicator provides a dynamic view of the US stock market's real value, adjusted for inflation and currency strength. It combines major stock indices including the S&P 500, NASDAQ, Dow Jones, and Russell 2000, and adjusts the composite index using the US Consumer Price Index (CPI) and the US Dollar Index (DXY). This adjustment helps to reveal the true market performance, stripped of inflationary effects and currency valuation changes.
Key Features:
Composite Index Calculation: Averages the prices of SPX, IXIC, DJI, and RTY to create a broad market overview.
Inflation Adjustment: Uses the CPI to adjust for the effects of inflation, ensuring that the real value changes in the stock market are highlighted.
Currency Strength Adjustment: Applies the DXY to account for fluctuations in the strength of the US dollar, providing insights into how currency variations impact market valuation.
Dynamic Base Calculation: Utilizes a rolling window to dynamically update base values, allowing for continuous reassessment of the market’s adjusted value as new data becomes available.
This indicator provides:
Real Value Insights: By adjusting for both inflation and currency strength, this indicator offers a more accurate measure of the underlying market conditions.
Dynamic Updates: With a rolling window approach, the indicator continually adapts, providing up-to-date information.
Strategic Decisions: Helps in identifying true market growth or decline periods, aiding in strategic investment planning.
Usage:
To use this indicator, simply add it to your chart, and it will automatically display the adjusted composite index. This index can be particularly useful for investors looking to understand underlying market trends beyond nominal price movements, helping in making more informed investment decisions when comparing certain tickers to an average of the major US stock market indexes, adjusted for inflation and the strength of the US dollar.
Example Use Case:
A typical use case might involve comparing periods of high inflation to see how the overall US stock market performed in real terms, not just nominal terms. This can indicate whether the market growth was genuine or merely a reflection of inflation. By comparing this result to an average of these major indexes without adjusting for inflation or currency strength changes, you can see how significantly these forces can impact real gains or losses.

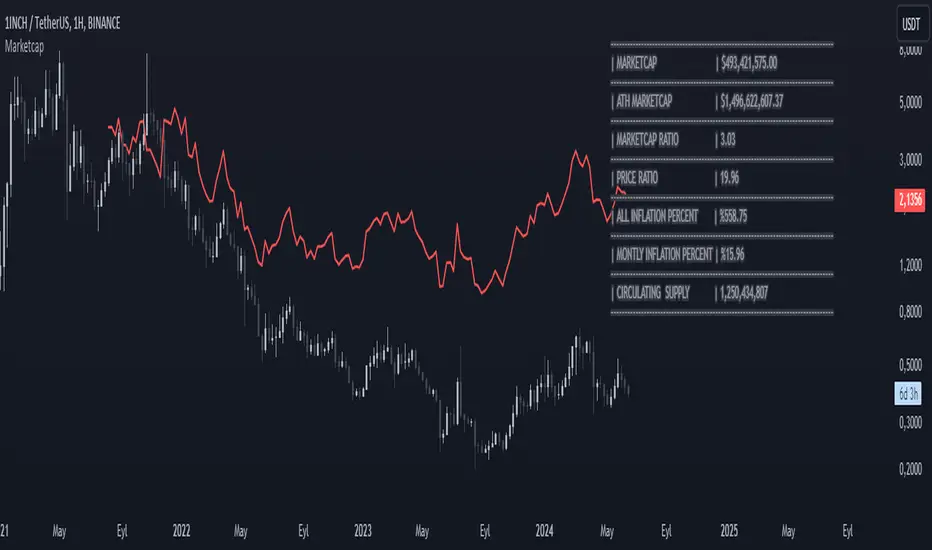
MarketcapDefinition
This indicator was designed to reveal the relationship between the price of the product and its market value. The red average marketcap line that appears on the chart is the line. And the further up this line moves from the chart, the more it shows that there is a mismatch between the price and the market value. So what does this incompatibility mean? There are purchases of the product, but since the supply of the product into circulation is constantly increasing, it means that these purchases are not reflected in the price, which means there is inflation.
The main purpose of our indicator is to calculate inflation of the product. It is the understanding of whether or not the amount of supply put into circulation in response to the investment is reflected in the product price while increasing the market value.
Attention: Transactions are made based on the data received via CRYPTOCAP. In cases where this data cannot be received, the "UNSUPPORTED SOURCE" warning is displayed. You can use Settings to change the source from which data can be retrieved.
Labels
The labels are explained one by one below.
MARKETCAP: Shows the current market value.
ATH MARKETCAP: Shows the highest market value of all time.
MARKETCAP RATIO: It gives the ratio between the highest level and the lowest level of the market value.
PRICE RATIO: Gives the ratio between the highest level and the lowest level of the crypto price.
ALL INFLATION PERCENT: It refers to the percentage of all inflation that has developed so far. It is also the percentage difference between market value and price.
MONTHLY INFLATION PERCENT: It refers to the monthly estimated inflation percentage.
CIRCULATING SUPPLY: It refers to the estimated circulation supply of the product.
Best Use
It should bring to mind the idea that the further the indicator curve moves away from the price, the higher the inflation will be. In order for a product to reach its previous peak, its market value must normally increase by the "MARKETCAP RATIO" value and the "PRICE RATIO" value. This should make you think that this product needs more investment to reach its former peak. And it is necessary to be careful when purchasing such products.
Disclaimer
This indicator is for informational purposes only and should be used for educational purposes only. You may lose money if you rely on this to trade without additional information. Use at your own risk.
Version
v1.0
Retail Sales v Inflation YoYAre high retail sales increases really positive if the inflation rate is higher?
This year over year indicator of retail sales versus inflation levels can be placed in concert with any security to determine how symbols trade when inflation or retail sales are higher. A green histogram is when retail sales are higher than the inflation rate on a year over year basis. Red indicates inflation is higher rate.
The indicator can work with any symbols to see divergences. Feel free to change the positive and negative symbols to run other comparisons.

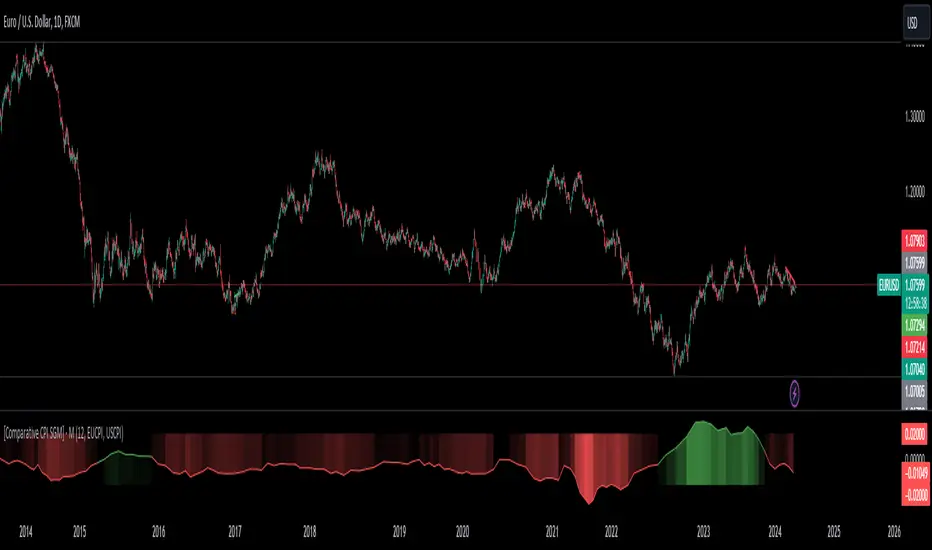
[Comparative CPI SGM]Code Explanation
User Inputs:
len: Defines the period over which CPI changes are calculated, with selectable options of 12, 6, and 3 months.
CP1 and CP2: These are the economic zones whose CPI data are being compared. The options include CPI from various regions like the EU, USA, UK, etc.
Calculating and Comparing Changes:
Calculates the annual change for each CPI and then computes the difference between these two changes.
Trading Utility
In trading, CPI variations are key indicators of inflation within different economic regions. Monetary policy decisions by central banks, heavily influenced by these data, significantly impact financial markets, especially in forex and bond markets.
Monetary Policy Forecasting:
If inflation in one region is significantly higher than in another, the central bank might raise interest rates, potentially strengthening that region's currency.
Currency Trading Strategy:
Traders might use this indicator to speculate on currency pair movements. For example, if US CPI is rising faster than the EU CPI, this might suggest a potential appreciation of the USD against the EUR.
Macroeconomic Analysis:
Understanding where inflation pressures are strongest can guide longer-term investment decisions, such as choosing between emerging and developed markets.
[BT] NedDavis Series: CPI Minus 5-Year Moving Average🟧 GENERAL
The script works on the Monthly Timeframe and has 2 main settings (explained in FEATURES ). It uses the US CPI data, reported by the Bureau of Labour Statistics.
🔹Functionality 1: The main idea is to plot the distance between the CPI line and the 5 year moving average of the CPI line. This technique in mathematics is called "deviation from the moving average". This technique is used to analyse how has CPI previously acted and can give clues at what it might do in the future. Economic historians use such analysis, together with specific period analysis to predict potential risks in the future (see an example of such analysis in HOW TO USE section. The mathematical technique is a simple subtraction between 2 points (CPI - 5yr SMA of CPI).
▶︎Interpretation for deviation from a moving average:
Positive Deviation: When the line is above its moving average, it indicates that the current value is higher than the average, suggesting potential strength or bullish sentiment.
Negative Deviation: Conversely, when the line falls below its moving average, it suggests weakness or bearish sentiment as the current value is lower than the average.
▶︎Applications:
Trend Identification: Deviations from moving averages can help identify trends, with sustained deviations indicating strong trends.
Reversal Signals: Significant deviations from moving averages may signal potential trend reversals, especially when combined with other technical indicators.
Volatility Measurement: Monitoring the magnitude of deviations can provide insights into market volatility and price movements.
Remember the indicator is applying this only for the US CPI - not the ticker you apply the indicator on!
🔹Functionality 2: It plots on a new pane below information about the Consumer Price Index. You can also find the information by plotting the ticker symbol USACPIALLMINMEI on TradingView, which is a Monthly economic data by the OECD for the CPI in the US. The only addition you would get from the indicator is the plot of the 5 year Simple Moving Average.
🔹What is the US Consumer Price Index?
Measures the change in the price of goods and services purchased by consumers;
Traders care about the CPI because consumer prices account for a majority of overall inflation. Inflation is important to currency valuation because rising prices lead the central bank to raise interest rates out of respect for their inflation containment mandate;
It is measured as the average price of various goods and services are sampled and then compared to the previous sampling.
Source: Bureau of Labor Statistics;
FEATURES OF INDICATOR
1) The US Consumer Price Index Minus the Five Year Moving Average of the same.
As shown on the picture above and explained in previous section. Here a more detailed view.
2) The actual US Consumer Price Index (Annual Rate of change) and the Five year average of the US Consumer Price Index. Explained above and shown below:
To activate 2) go into settings and toggle the check box.
HOW TO USE
It can be used for a fundamental analysis on the relationship between the stock market, the economy and the Feds decisions to hike or cut rates, whose main mandate is to control inflation over time.
I have created this indicator to show my analysis in this idea:
What does a First Fed Rate cut really mean?
CREDITS
I have seen such idea in the past posted by the institutional grade research of NedDavis and have recreated it for the TradingView platform, open-source for the community.

US CPIIntroducing "US CPI" Indicator
The "US CPI" indicator, based on the Consumer Price Index (CPI) of the United States, is a valuable tool for analyzing inflation trends in the U.S. economy. This indicator is derived from official data provided by the U.S. Bureau of Labor Statistics (BLS) and is widely recognized as a key measure of inflationary pressures.
What is CPI?
The Consumer Price Index (CPI) is a measure that examines the average change in prices paid by consumers for a basket of goods and services over time. It is an essential economic indicator used to gauge inflationary trends and assess changes in the cost of living.
How is "US CPI" Calculated?
The "US CPI" indicator in this script retrieves CPI data from the Federal Reserve Economic Data (FRED) using the FRED:CPIAUCSL symbol. It calculates the rate of change in CPI over a specified period (typically 12 months) and applies technical analysis tools like moving averages (SMA and EMA) for trend analysis and smoothing.
Why Use "US CPI" Indicator?
1. Inflation Analysis: Monitoring CPI trends provides insights into the rate of inflation, which is crucial for understanding the overall economic health and potential impact on monetary policy.
2. Policy Implications: Changes in CPI influence decisions by policymakers, central banks, and investors regarding interest rates, fiscal policies, and asset allocation.
3. Market Sentiment: CPI data often impacts market sentiment, influencing trading strategies across various asset classes including currencies, bonds, and equities.
Key Features:
1. Customizable Smoothing: The indicator allows users to apply exponential moving average (EMA) smoothing to CPI data for clearer trend identification.
2. Visual Representation: The plotted line visually represents the inflation rate based on CPI data, helping traders and analysts assess inflationary pressures at a glance.
Sources and Data Integrity:
The CPI data used in this indicator is sourced directly from FRED, ensuring reliability and accuracy. The script incorporates robust security protocols to handle data requests and maintain data integrity in a trading environment.
In conclusion, the "US CPI" indicator offers a comprehensive view of inflation dynamics in the U.S. economy, providing traders, economists, and policymakers with valuable insights for informed decision-making and risk management.
Disclaimer: This indicator and accompanying analysis are for informational purposes only and should not be construed as financial advice. Users are encouraged to conduct their own research and consult with professional advisors before making investment decisions.

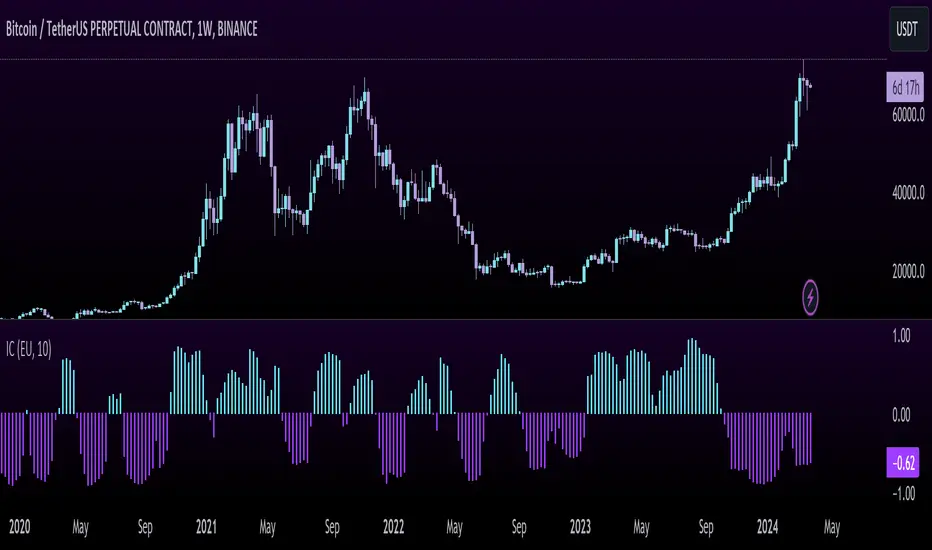
Inflation CorrelationHeyo fellas,
In today’s dynamic economic landscape, understanding the relationship of market prices to other economical factors like inflation rate is crucial. The Inflation Correlation Indicator is designed to provide traders with a clear visualization of this relationship. By correlating average inflation rates from selected countries with market closing prices, this indicator offers a unique perspective on potential market movements influenced by inflationary trends.
Features:
Country Selection: Choose from the European Union (EU), Germany (DE), or the United States (US) to tailor the correlation analysis to your specific market interest.
Correlation Length Customization: Adjust the correlation length to refine the sensitivity of the indicator to recent inflation data.
Visual Clarity: The correlation histogram changes color based on the direction of the correlation, providing an intuitive understanding of the inflation correlation.
Whether you’re a fundamental analyst seeking to incorporate macroeconomic indicators into your strategy or a trader looking for an edge in inflation-sensitive markets, the Inflation Correlation Indicator is an indispensable tool in your TradingView arsenal.
Thanks for checking this out!
Best regards,
simwai
Temporal Value Tracker: Inception-to-Present Inflation Lens!What we're looking at here is a chart that does more than just display the price of gold. It offers us a time-traveling perspective on value. The blue line, that's our nominal price—it's the straightforward market price of gold over time. But it's the red line that takes us on a deeper journey. This line adjusts the nominal price for inflation, showing us the real purchasing power of gold.
Now, when we talk about 'real value,' we're not just philosophizing. We're anchoring our prices to a point in time when the journey began—let's say when gold trading started on the markets, or any inception point we choose. By 'shadowing' certain years—say, from the 1970s when the gold standard was abandoned—we can adjust this chart to reflect what the inflation-adjusted price means since that key moment in history.
By doing so, we're effectively isolating our view to start from that pivotal year, giving us insight into how gold, or indeed any asset, has held up against the backdrop of economic changes, policy shifts, and the inevitable rise in the cost of living. If you're analyzing a stock index like the S&P 500, you might begin your inflation-adjusted view from the index's inception date, which allows you to measure the true growth of the market basket from the moment it started.
This adjustment isn't just academic. It influences how we perceive value and growth. Consider a period where the nominal price skyrockets. We might toast to our brilliance in investment! But if the inflation-adjusted line lags, what we're seeing is nominal growth without real gains. On the other hand, if our red line outpaces the blue even during stagnant market periods, we're witnessing real growth—our asset is outperforming the eroding effects of inflation.
Every asset class can be evaluated this way. Stocks, bonds, real estate—they all have their historical narratives, and inflation adjustment tells us if these stories are tales of genuine growth or illusions masked by inflation.
So, as informed traders and investors, we need to keep our eyes on this inflation-adjusted line. It's our measure against the silent thief that is inflation. It ensures we're not just keeping up with the Joneses of the market, but actually outpacing them, building real wealth over time

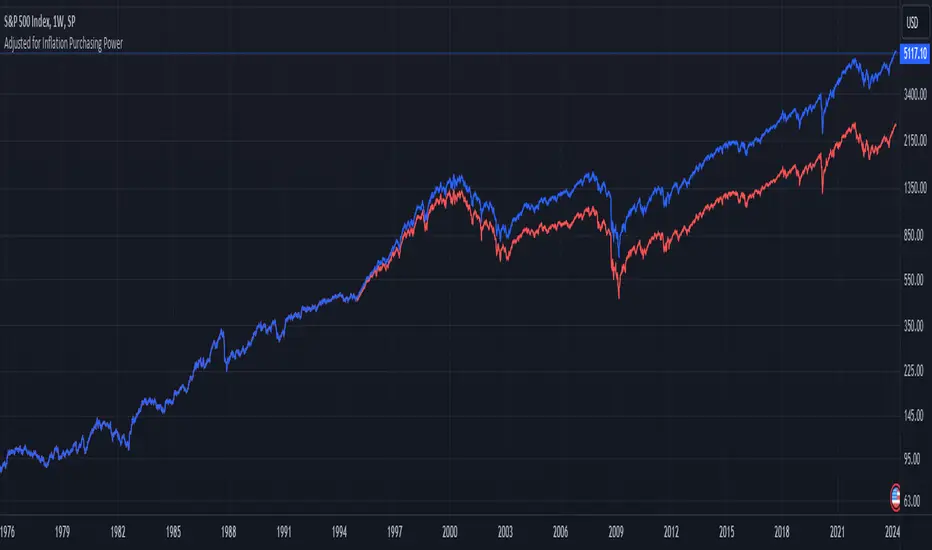
1995-Present - Inflation and Purchasing PowerGood day, everyone! Today, we're going to look at a chart that's a bit different from the usual price charts we analyse. This isn't just any chart; it's a lens into the past, adjusted for the reality of inflation—a concept we often hear about but seldom see directly applied to our trading charts.
What we have here is an 'Inflation Adjusted Price' indicator on TradingView, and it's doing something quite special. It's showing us the price of our asset, let's say the S&P 500, not just in today's dollars, but in the dollars of 1995. Why 1995, you ask? Well, it's the starting point we've chosen to measure how much actual buying power has changed since then.
So, every point on this red line we see represents what the S&P 500's value would be if we stripped away the effects of inflation. This is the price in terms of what your money could actually buy you back in 1995.
As traders and investors, we're always looking at prices going up and thinking, 'Great! My investment is growing!' But the real question we should ask is, 'Is my money growing in real terms? Can it buy me more than it did last year, or five, ten, or twenty-five years ago?'
This chart tells us exactly that. If the red line is above the actual price, it means that the S&P 500 has not just grown in nominal terms, but it has actually outpaced inflation. Your investment has grown in real terms; it can buy you more now than it could back in 1995.
On the flip side, if the red line is below the actual price, that's a sign that while the nominal price might be up, the real value, the purchasing power, hasn't grown as much or could even have fallen.
This view is crucial, especially for the long-term investors among us. It gives us a reality check on our investments and savings. Are we truly growing our wealth, or are we just keeping up with the cost of living? This indicator answers that.
Remember, the true measure of financial growth is not just the numbers on a chart. It's what you can do with those numbers—how much bread, or eggs, or yes, even houses, you can buy with your hard-earned money
BTC Purchasing Power 2009-20XX! Hello, today I'm going to show you something that shifts our perspective on Bitcoin's value, not just in nominal terms, but adjusted for the real buying power over the years. This Pine Script TAS developed for TradingView does exactly that by taking into account inflation rates from 2009 to the present.
As you know, inflation erodes the purchasing power of money. That $100 in 2009 does not buy you the same amount in goods or services today. The same concept applies to Bitcoin. While we often look at its price in terms of dollars, pounds, or euros, it's crucial to understand what that price really means in terms of purchasing power.
What this script does is adjust the price of Bitcoin for cumulative inflation since 2009, allowing us to see not just how the nominal price has changed, but how its value as a means of purchasing goods and services has evolved.
For example, if we see Bitcoin's price at $60,000 today, that number might seem high compared to its early years. However, when we adjust this price for inflation, we might find that in terms of 2009's purchasing power, the effective price might be somewhat lower. This adjusted price gives us a more accurate reflection of Bitcoin's true value over time.
This script plots two lines on the chart:
The Original BTC Price: This is the unadjusted price of Bitcoin as we typically see it.
BTC Purchasing Power: This line shows Bitcoin's price adjusted for inflation, reflecting how many goods or services Bitcoin could buy at that point in time compared to 2009.
By comparing these lines, we can observe periods where Bitcoin's purchasing power significantly increased, even if the nominal price was not at its peak. This can help us identify moments when Bitcoin was undervalued or overvalued in real terms.
This analysis is crucial for long-term investors and traders who want to understand Bitcoin's value beyond the surface-level price movements. It helps us appreciate Bitcoin's potential as a store of value, especially in contexts where traditional currencies are losing purchasing power due to inflation.
Remember, investing is not just about riding price waves; it's about understanding the underlying value. And that's precisely what this script helps us to uncover

Debasement Adjusted CAGREquity growth may appear less significant when juxtaposed with the expansion of the money supply. This is because markets tend to adjust prices to reflect changes in money supply almost immediately.
Our indicator offers a unique perspective by adjusting the current ticker price for the M2 money supply and normalizing this data to show the percentage appreciation since the first visible bar on the chart. Users can also select alternative money supply measures, such as the EU-M2, via the indicator's settings.
This approach essentially redefines the price as the "growth of the relative share of the total money supply," providing a novel lens through which to view equity performance.
Additionally, the indicator computes both the Compound Annual Growth Rate (CAGR) and the total growth observed from this adjusted standpoint. These metrics are calculated within the context of the selected time range, adding depth to the analysis.
Although this indicator is compatible with all timeframes, it is primarily designed as a macroeconomic tool. It yields the most meaningful insights when applied to longer-term perspectives, such as weekly or monthly timeframes.
This tool builds upon the foundational work presented in the "Inflation Adjusted Performance Ticker," accessible at Inflation Adjusted Performance Ticker , enhancing its application by normalizing the results and computing CAGR and total growth.

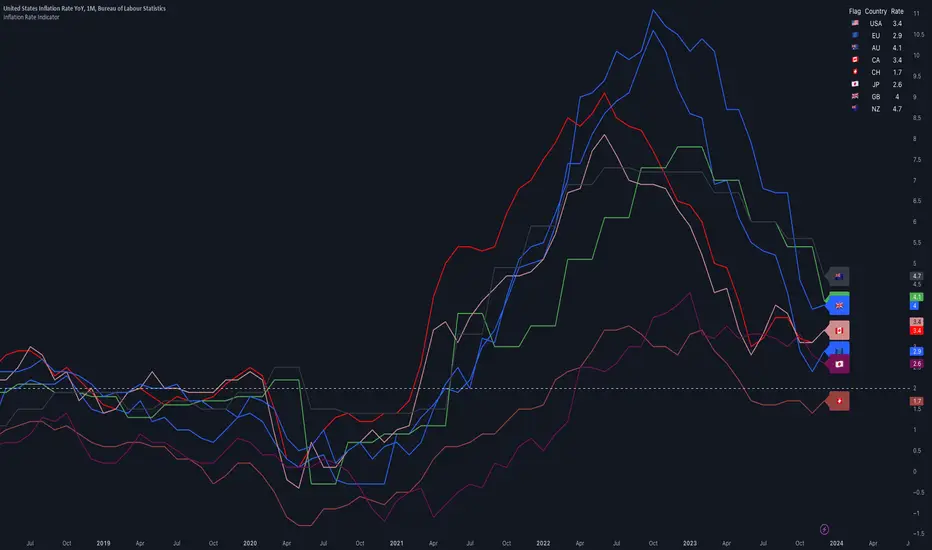
Inflation IndicatorThis script provides a great view of Year-over-Year (YoY) inflation rates for key countries.
The inflation data used per default are TradingView Tickers, but you can change them to anything you want from the settings.
There is no calculation in this script, all it does is providing a overview of inflation rates in a single indicator.
Inflation data for the USA, European Union, Australia, Canada, Switzerland, Japan, United Kingdom, and New Zealand (Inflation Symbols editable in the settings)
Customizable static line to indicate a specific threshold value (default: 2.0).
Table displaying country flags, names, and the latest inflation rates.
Country-representative colors for easy identification.
Market Health MonitorThe Market Health Monitor is a comprehensive tool designed to assess and visualize the economic health of a market, providing traders with vital insights into both current and future market conditions. This script integrates a range of critical economic indicators, including unemployment rates, inflation, Federal Reserve funds rates, consumer confidence, and housing market indices, to form a robust understanding of the overall economic landscape.
Drawing on a variety of data sources, the Market Health Monitor employs moving averages over periods of 3, 12, 36, and 120 months, corresponding to quarterly, annual, three-year, and ten-year economic cycles. This selection of timeframes is specifically chosen to capture the nuances of economic movements across different phases, providing a balanced view that is sensitive to both immediate changes and long-term trends.
Key Features:
Economic Indicators Integration: The script synthesizes crucial economic data such as unemployment rates, inflation levels, and housing market trends, offering a multi-dimensional perspective on market health.
Adaptability to Market Conditions: The inclusion of both short-term and long-term moving averages allows the Market Health Monitor to adapt to varying market conditions, making it a versatile tool for different trading strategies.
Oscillator Thresholds for Recession and Growth: The script sets specific thresholds that, when crossed, indicate either potential economic downturns (recessions) or periods of growth (expansions), allowing traders to anticipate and react to changing market conditions proactively.
Color-Coded Visualization: The Market Health Monitor employs a color-coding system for ease of interpretation:
-- A red background signals unhealthy economic conditions, cautioning traders about potential risks.
-- A bright red background indicates a confirmed recession, as declared by the NBER, signaling a critical time for traders to reassess risk exposure.
-- A green background suggests a healthy market with expected economic expansion, pointing towards growth-oriented opportunities.
Comprehensive Market Analysis: By combining various economic indicators, the script offers a holistic view of the market, enabling traders to make well-informed decisions based on a thorough understanding of the economic environment.
Key Criteria and Parameters:
Economic Indicators:
Labor Market: The unemployment rate is a critical indicator of economic health.
High or rising unemployment indicates reduced consumer spending and economic stress.
Inflation: Key for understanding monetary policy and consumer purchasing power.
Persistent high inflation can lead to economic instability, while deflation can signal weak
demand.
Monetary Policy: Reflected by the Federal Reserve funds rate.
Changes in the rate can influence economic activity, borrowing costs, and investor
sentiment.
Consumer Confidence: A predictor of consumer spending and economic activity.
Reflects the public’s perception of the economy
Housing Market: The housing market often leads the economy into recession and recovery.
Weakness here can signal broader economic problems.
Market Data:
Stock Market Indices: Reflect overall investor sentiment and economic
expectations. No gains in a stock market could potentially indicate that economy is
slowing down.
Credit Conditions: Indicated by the tightness of bank lending, signaling risk
perception.
Commodity Insight:
Crude Oil Prices: A proxy for global economic activity.
Indicator Timeframe:
A default monthly timeframe is chosen to align with the release frequency of many economic indicators, offering a balanced view between timely data and avoiding too much noise from short-term fluctuations. Surely, it can be chosen by trader / analyst.
The Market Health Monitor is more than just a trading tool—it's a comprehensive economic guide. It's designed for traders who value an in-depth understanding of the economic climate. By offering insights into both current conditions and future trends, it encourages traders to navigate the markets with confidence, whether through turbulent times or in periods of growth. This tool doesn't just help you follow the market—it helps you understand it.

Treasury Yields Heatmap [By MUQWISHI]▋ INTRODUCTION :
The “Treasury Yields Heatmap” generates a dynamic heat map table, showing treasury yield bond values corresponding with dates. In the last column, it presents the status of the yield curve, discerning whether it’s in a normal, flat, or inverted configuration, which determined by using Pearson's linear regression coefficient. This tool is built to offer traders essential insights for effectively tracking bond values and monitoring yield curve status, featuring the flexibility to input a starting period, timeframe, and select from a range of major countries' bond data.
_______________________
▋ OVERVIEW:
______________________
▋ YIELD CURVE:
It is determined through Pearson's linear regression coefficient and considered…
R ≥ 0.7 → Normal
0.7 > R ≥ 0.35 → Slight Normal
0.35 > R > -0.35 → Flat
-0.35 ≥ R > -0.7 → Slight Inverted
-0.7 ≥ R → Inverted
_______________________
▋ INDICATOR SETTINGS:
#Section One: Table Setting
#Section Two: Technical Setting
(1) Country: Select country’s treasury yields data
(2) Timeframe: Time interval.
(3) Fetch By:
(3A) Date: Retrieve data by beginning of date.
(3B) Period: Retrieve data by specifying the number of time series back.
Enjoy. Please let me know if you have any questions.
Thank you.

CE - 42MACRO Equity Factor Table This is Part 1 of 2 from the 42MACRO Recreation Series
The CE - 42MACRO Equity Factor Table is a whole toolbox packaged in a single indicator.
It aims to provide a probabilistic insight into the market realized GRID Macro Regime, use a multiplex of important Assets and Indices to form a high probability Implied Correlation expectation and allows to derive extra market insights by showing the most important aggregates and their performance over multiple timeframes... and what that might mean for the whole market direction, as well as the underlying asset.
WARNING
By the nature of the macro regimes, the outcomes are more accurate over longer Chart Timeframes (Week to Months).
However, it is also a valuable tool to form a proper,
market realized, short to medium term bias.
NOTE
This Indicator is intended to be used alongside the 2nd part "CE - 42MACRO Yield and Macro"
for a more wholistic approach and higher accuracy.
Due to coding limitations they can not be merged into one Indicator.
Methodology:
The Equity Factor Table tracks specifically chosen Assets to identify their performance and add the combined performances together to visualize 42MACRO's GRID Equity Model.
For this it uses the below Assets, with more to come:
Dividend Compounders ( AMEX:SPHD )
Mid Caps ( AMEX:VO )
Emerging Markets ( AMEX:EEM )
Small Caps ( AMEX:IWM )
Mega Cap Growth ( NASDAQ:QQQ )
Brazil ( AMEX:EWZ )
United Kingdom ( AMEX:EWU )
Growth ( AMEX:IWF )
United States ( AMEX:SPY )
Japan ( AMEX:DXJ )
Momentum ( AMEX:MTUM )
China ( AMEX:FXI )
Low Beta ( AMEX:SPLV )
International ex-US ( NASDAQ:ACWX )
India ( AMEX:INDA )
Eurozone ( AMEX:EZU )
Quality ( AMEX:QUAL )
Size ( AMEX:OEF )
Functionalities:
1. Correlations
Takes a measure of Cross Market Correlations
2. Implied Trend
Calculates the trend for each Asset and uses the Correlation to obtain the Implied Trend for the underlying Asset
There are multiple functionalities to enhance Signal Speed and precision...
Reading a signal only over a certain threshold, otherwise being colored in gray to signal noise or unclear market behavior
Normalization of Signal
Double Normalization of Signal for more Speed... ideal for the Crypto Market
Using an additional Hull Moving Average to enhance Signal Speed
Additional simple Background coloring to get a Signal from the HMA
Barcoloring based on the Implied Correlation
3. Equity Factor Table
Shows market realized Asset performance
Provides the approximate realized GRID market regimes
Informs about "Risk ON" and "Risk OFF" market states
Now into the juicy stuff...
Visuals:
There is a variety of options to change visual settings of what is plotted and where
+ additional considerations.
Everything that is relevant in the underlying logic which can improve comprehension can be visualized with these options.
More to come
Market Correlation:
The Market Correlation Table takes the Correlation of all the Assets to the Asset on the Chart,
it furthermore uses the Normalized KAMA Oscillator by IkkeOmar to analyse the current trend of every single Asset.
(To enhance the Signal you can apply the mentioned Indicator on the relevant Assets to find your target Asset movements that you intend to capture...
and then change the length of the Indicator in here)
It then Implies a Correlation based on the Trend and the Correlation to give a probabilistically adjusted expectation for the future Chart Asset Movement.
This is strengthened by taking the average of all Implied Trends.
Thus the Correlation Table provides valuable insights about probabilistically likely Movement of the Asset over the defined time duration,
providing alpha for Traders and Investors alike.
Equity Factors:
The table provides valuable information about the current market environment (whether it's risk on or risk off),
the rough GRID models from 42MACRO and the actual market performance.
This allows you to obtain a deeper understanding of how the market works and makes it simple to identify the actual market direction,
makes it possible to derive overall market Health and shows market strength or weakness.
Utility:
The Equity Factor Table is divided in 4 Sections which are the GRID regimes:
Economic Growth:
Goldilocks
Reflation
Economic Contraction:
Inflation
Deflation
Top 5 Equity Factors:
Are the values green for a specific Column?
If so then the market reflects the corresponding GRID behavior.
Bottom 5 Equity Factors:
Are the values red for a specific Column?
If so then the market reflects the corresponding GRID behavior.
So if we have Goldilocks as current regime we would see green values in the Top 5 Goldilocks Cells and red values in the Bottom 5 Goldilocks Cells.
You will find that Reflation will look similar, as it is also a sign of Economic Growth.
Same is the case for the two Contraction regimes.
This whole Indicator, as well as the second part, is based to a majority on 42MACRO's models.
I only brought them into TV and added things on top of it.
If you have questions or need a more in-depth guide DM me.
Will make a guide to all functionalities if necessity becomes apparent.
GM

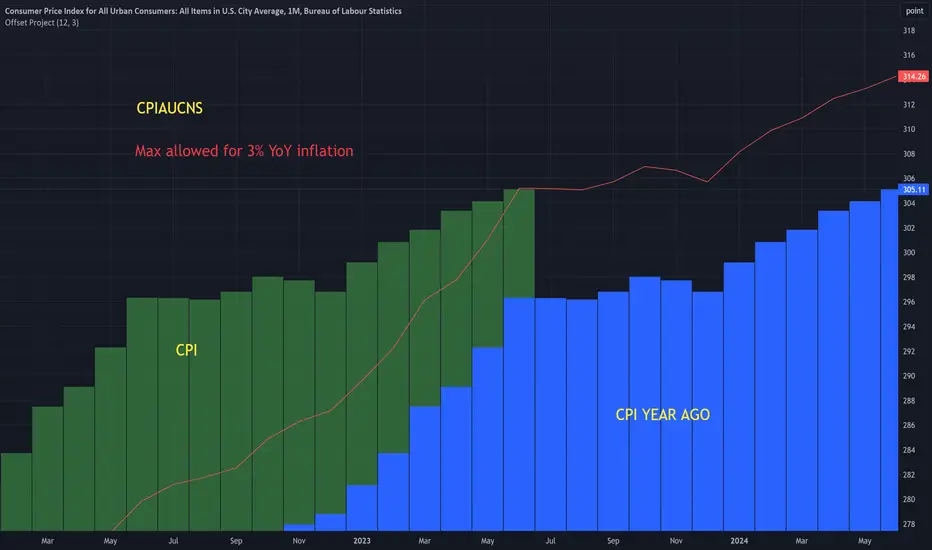
Offset ProjectIntended for use with CPI symbols like:
CPIAUCNS (all items)
CPILFENS (core)
Shows the CPI values from a year ago, next to the current values. This makes it easier to visualize the base effects .
Has a ' max inflation rate ' parameter. This is shown as a red line. So for example, if it's set to 3, then CPI must stay below the red line in in order for the inflation rate to stay below 3.
Rule Of 20 - Fair Value Estimation by Inflation & Earnings (TG)The Rule Of 20 is a heuristic calculation to find the fair value of an asset or market given its earnings and current inflation.
Its calculation is straightforward: the fair multiple of the price or price-to-earnings ratio of a stock should be 20 minus the rate of inflation.
In math terms: fair_price-to-earnings_ratio = (20 - inflation) ; fair_value = current_price * fair_price-to-earnings_ratio / real_price-to-earnings_ratio
For example, if a stock or index was trading on 11 times earnings and inflation was 2%, then the theory would be that the fair price-to-earnings ratio would be 20-2 = 18, which is much higher than the real price-to-earnings ratio of 11, and hence the asset would be undervalued.
Conversely, a market or company that was trading on 18 times price-to-earnings ration when inflation was 8% was seen as overvalued, because of the fair price-to-earnings ratio being 20-8=12, hence much lower than the real price-to-earnings ratio of 18.
We can then project the delta between the fair PE and real PE onto the asset's value to obtain the projected fair value, which may be a target of future value the asset may reach or hover around.
For example, as of 1st November 2022, SPX stood at 3871.97, with a PE ratio of 20.14 and an inflation in the US of 7.70. Using the Rule Of 20, we find that the fair PE ratio is 20-7.7=12.3, which is much lower than the current PE ratio of 20.14 by 39%! This may indicate a future possibility of a further downside risk by 39% from current valuation levels.
The origins of this rule are unknown, although the legendary US fund manager Peter Lynch is said to have been an active proponent when he was directing the Fidelity’s Magellan fund from 1977 to 1990.
For more infos about the Rule Of 20, reading this article is recommended: www.sharesmagazine.co.uk
This indicator implements the Rule Of 20 on any asset where the Financials are availble to TradingView, and also for the entire SP:SPX index as a way to assess the wider US stock market. Technically, the calculation is a bit different for the latter, as we cannot access earnings of SPX through Financials on TradingView, so we access it using the QUANDL:MULTPL/SP500_PE_RATIO_MONTH ticker instead.
By default are displayed:
current asset value in red
fair asset value according to the Rule Of 20 in white for SPX, or different shades of purple/maroon for other assets. Note that for SPX there is only one calculation, whereas for other assets there are multiple different ways to calculate earnings, so different fair values can be computed.
fair price-to-earnings ratio (PE ratio) in light grey.
real price-to-earnings ratio in darker grey.
This indicator can be used on SP:SPX ticker, and on most NASDAQ:* tickers, since they have Financials integrated in TradingView. Stocks tickers from other exchanges may not provide Financials data, so this indicator won't work then. If this happens, try to find the same ticker on NASDAQ instead.
Note that by default, only the US stock market is considered. If you want to consider stocks or assets in other regions of the world, please change the inflation ticker to a ticker that reflect the target region's inflation.
Also adding a table to ease interpretation was considered, but then the Timeframe MTF parameter would not work, and since the big advantage of this indicator is to allow for historical comparisons, the table was dropped.
Enjoy, and keep in mind that all models are wrong, but some are useful.
Trade safely!
TG

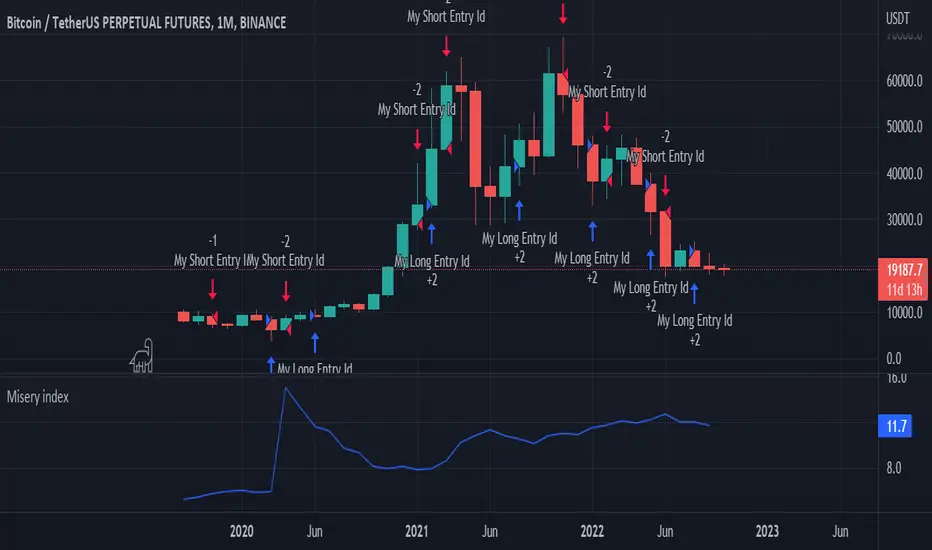
Misery index strategyHi all,
It's bear market so let's have a look at the misery index.
Misery index = inflation(%) + unemployment (%)
It's only possible to use this chart on the monthly (as misery index is updated monthly), but just for fun I added a strategy to it. If misery index increases you short and you go long when MI decreases.
Enjoy
p.s. the band is pretty cool too
Annualizer: New Indicator + CPI AnalysisThis indicator calculates the annualized month-over-month percent change of a cumulative index and plots it alongside the year-over-year percent change for comparison. It was developed for the purpose of analyzing the inflation rate of CPI indexes such as “CPIAUCSL.” It can also be used on M2 money supply and pretty much any cumulative index. It will not produce useful outputs on percent change indexes such as “USCCPI” because it performs percent change calculations which are already applied to those indexes.
This indicator takes data from the monthly chart, regardless of how often the data is reported or what the timeframe of the current chart is. Doing so allows it to work on all timeframes while displaying only monthly data outputs but limits it from recognizing data which might be released more often than once per month. This limitation should be suitable for macroeconomic data such as CPI and M2 money supply which are usually analyzed on a month-to-month basis.
If the ticker symbol is "M2SL" which is M2 money supply, annualized percent change is plotted in green, otherwise, it’s plotted in blue.
CPI analysis:
Upon deploying this indicator, it was observed that the year-over-year (YoY) inflation rate (red) is a lagging indicator of the annualized month-over-month (MoM) inflation rate (blue) and that it appears to almost be a moving average of it. A moving average plot was temporarily added for comparison to the YoY and it was found that the difference between the two plots is negligible and that for the purposes of high-level analysis of inflation, the two plots can be considered to be no different from one another. Below is a screenshot for demonstration. Notice how closely the white 12-month SMA of the annualized rate tracks the YoY rate.
For other indexes which may see more dramatic changes month-over-month such as M2 money supply, the difference between the two signals becomes more pronounced but they are still comparable. The conclusion is that the YoY inflation rate can be considered to be a 12-month simple moving average of the annualized MoM rate.
12-month SMA:
It’s easy to see and stands to reason that if the annualized MoM inflation rate (blue) remains where it has been for the previous 2 months YoY inflation (red) will begin falling and eventually reach similar levels due to its moving-average-like behavior. This will bring us back to the 2% YoY inflation target of the Fed within no more than 10 months. There may be a perception that deflation is required to bring prices back down to the purple channel of CPI to make prices pre-Covid "normal" again. We were headed in that direction in July with a slightly negative MoM CPI read. What may have freaked investors out about the August report (most recent as of this writing) is that the inflation rate, rather than continuing into negative deflationary territory, has bounced back into positive territory.
M2 money supply isn’t an integral part of this analysis, but it helps demonstrate the indicator. It can be observed that CPI growth lags M2 money supply growth which seems to have leveled off.
I’m not a macroeconomist so I’m probably missing some things, but I do not see a lagging indicator such as YoY inflation being at 8.25% while annualized MoM inflation is at 1.42% as something to freak out about as investors have seemingly done. I’m a stock market bear as of last week, but I do not feel this CPI analysis strongly supports a bearish thesis, nor is it bullish. Next month’s annualized MoM % change may begin to sway me one way or the other depending on what this chart looks like when it’s updated.
