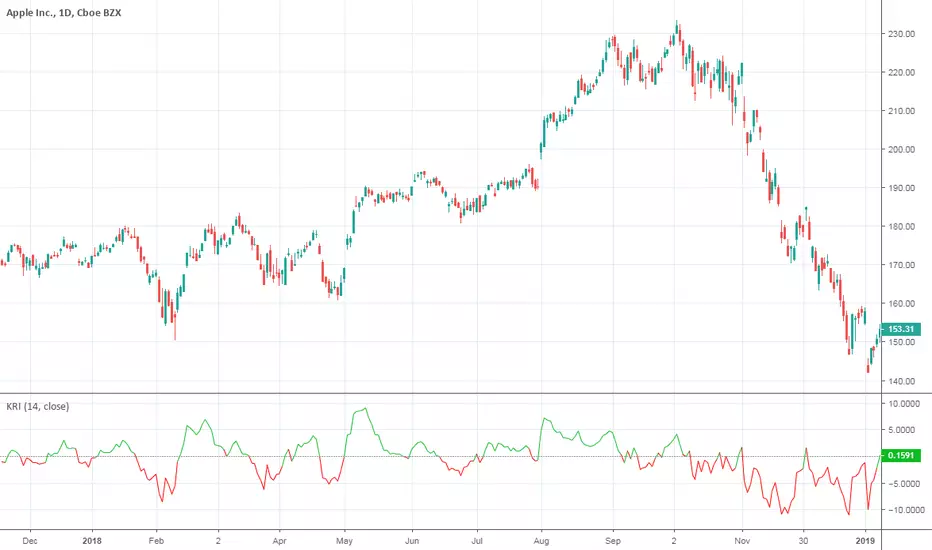
Kairi Relative Index Leading IndicatorHere is a leading indicator based on the relatively obscure Kairi Relative Index. The Kairi comes from Japan and is similar to the popular RSI, although it is believed that it predates the RSI significantly.
The Kairi measures the difference between the current price and its SMA as a percentage of the moving average.
We made a few modifications to the Kairi to improve its timing and balance its sensitivity. First, we calculated a 'fast' and 'slow' Kairi Relative Index. To do this, it calculates the difference between the current price and a SMA with a length of 7 periods for the fast Kairi. Then, the difference between the current price and an SMA of length 24 is calculated for the slow Kairi.
The big modification is using a 25 period SMA of slow Kairi Relative Index values as the threshold for buy and sell signals. When the fast Kairi line crosses above the white line(the threshold) it is considered a bullish signal, while a bearish signal comes when it crosses back below the same white line. This solved the issue with the Kairi having slower reaction time than the RSI. As the chart shows, this setup allowed it to catch not only major trends but also predict unexpected price spikes.
Users can adjust all 3 lengths, as well as adjust the option to have the slow Kairi displayed on the chart(shown in second pane).
Leading

⚛WPO - Wave Period Oscillator by Cryptorhythms⚛WPO - Wave Period Oscillator by Cryptorhythms
Intro
The indicator is based on Akram El Sherbini's article "Time Cycle Oscillators" published in IFTA journal 2018. The third in a series of 4 time cycle indicators I will be publishing.
The WPO is a short-term oscillator that measures the buying and selling period of price cycles over a certain time interval. The leading oscillator indicates a rise in buying period when it moves above the zero line and a rise in selling period when it moves below the zero line.
Description
Centerline Crossover: A bullish centerline crossover occurs when the WPO line moves above the zero level to turn positive. A bearish centerline crossover occurs when the WPO line moves below the zero level to turn negative. When bulls are in control, the price rally begins and the average of the bull’s period T increases to drive the WPO line above the centerline. A buy signal is subsequently triggered. When the bulls start to loose power, prices move sideways and the average period decreases. In this case, the WPO line may flutter near the centerline and cause false signals, whipsaws. To avoid the whipsaws occurring on the centerline, the following trading tactics are proposed.
TL:DR
Bullish signals are generated when WPO crosses over 0
Bearish signals are generated when WPO crosses under 0
OverBought level is 2
OverSold level is -2
ExtremeOB level is 2.7
ExtremeOS level is -2.7
👍 Enjoying this indicator or find it useful? Please give me a like and follow! I post crypto analysis, price action strategies and free indicators regularly.
💬 Questions? Comments? Want to get access to an entire suite of proven trading indicators? Come visit us on telegram and chat, or just soak up some knowledge. We make timely posts about the market, news, and strategy everyday. Our community isn't open only to subscribers - everyone is welcome to join.
For Trialers & Chat: t.me

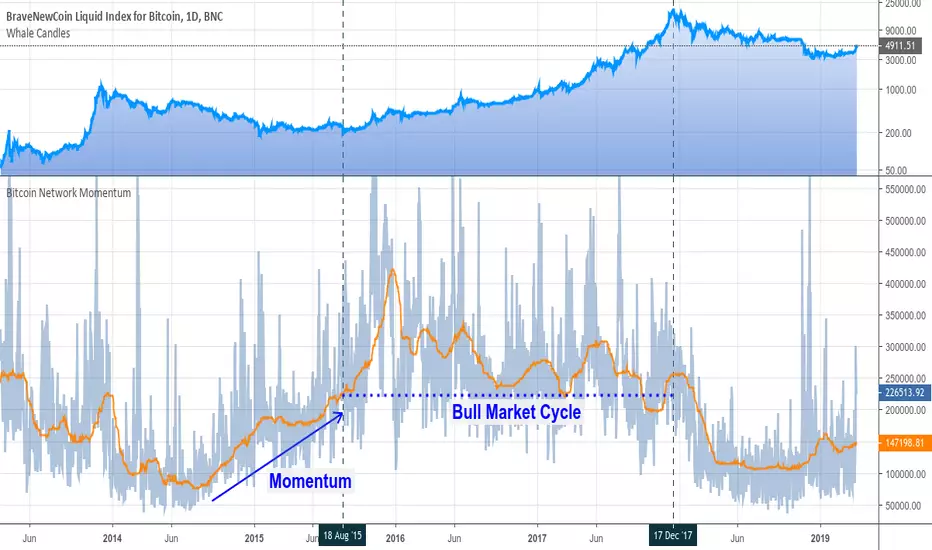
Bitcoin Network MomentumBitcoin Network Momentum is a leading indicator that relates On-Chain Transactional Volume (measured in BTC)with the evolution of the Bitcoin Price.
Further resources:
Woobull charts
Medium article
Credits: PositiveCrypto
Momentum Oscillator Momentum Oscillator
Concept for this leading indicator presented in IFTA by By M.Fawzy.
Volume Zone OscillatorOscillator is build on Walid Khalil's and David Steckler's concept for leading volume oscillator
All indicators core's dynamics is fully explained it two articles bellow , written by concepts fathers
Stocks & Commodities V. 29:5 (16-23, 28): In The Volume Zone by Walid Khalil and David Steckler
edmond.mires.co/GES816/14-In%20The%20Volume%20Zone.pdf
2008-IFTA journal-Volume Zone Oscillator (VZO) ~by Waleed Aly Khalil
capitalsynergy.com/resources/IFTA09VZO.pdf
//
Extreme conditions are visually intuitive
Momentum shift alerts
Candle printer for H/R Divergence pockets and confirmed divergences
Ehlers white noise indicator "branch" have wonderful confluences with VZO so its included as optional feature, its toggle button and settings are market with ⚠️to remind that its still heavily experimental
Every visual object group in script can be turned off separately from each other for customization freedom
V0.5

Stochastic RSI Momentum TranformThis is my version of Stochastic RSI, but not the stochastic RSI alone, hell no, it's a lagging indicator, I don't like lagging indicators.
This is a leading indicator that has momentum calculations in it and not only that, it has a momentum shifting calculation based on modified ehler's transformation !
Simple for user, a hell to program !
Price and how to get access to ? contact me in PM !

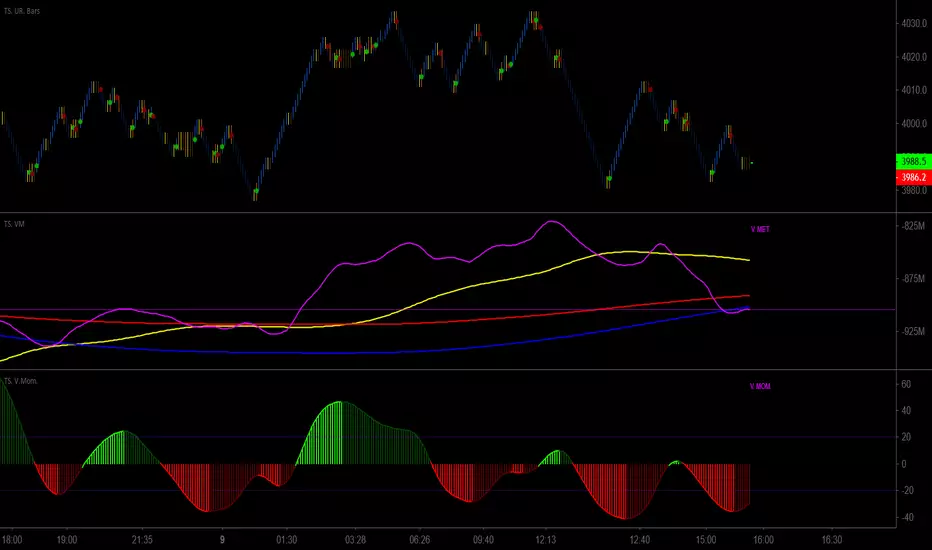
Trader Set - Volume MomentumThis is a Momentum indicator but on "Volume" The formula is heavily tweaked version of TSI with chance of using different averaging types, the period numbers are fixed and user don't need to type anything for them!
Please don't contact me for getting access, these tools are available for my students only. These are part of my "methodology" that I teach. The English version of the website and learning material is under development and I will announce it under each related script when they are ready so that those who are interested can participate in the course.
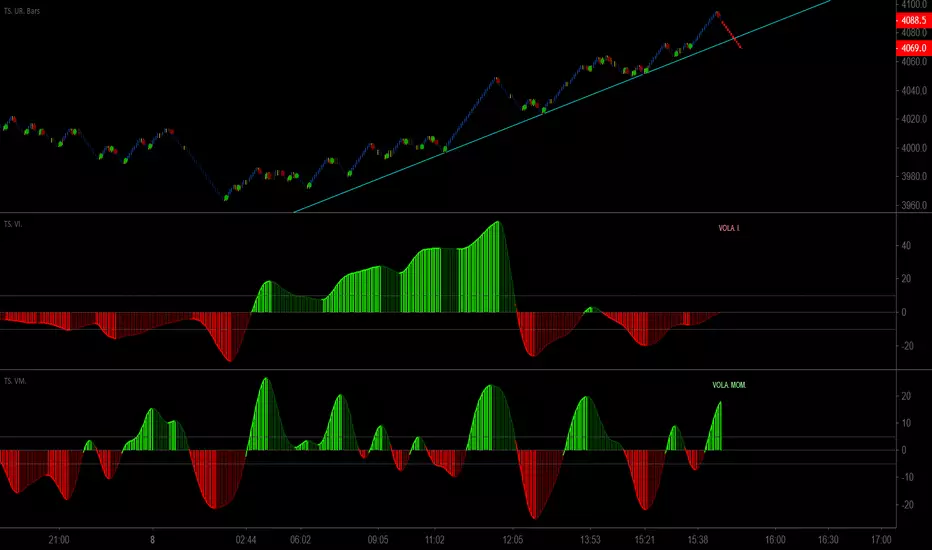
Trader Set - Volatility IndexOne of the last tools I forgot to publish till today. This is a Volatility Index Oscillator that uses a custom and original formula. This tool will be used hand in hand with's momentum one to easily identify the trend reversal points before it actually happens !
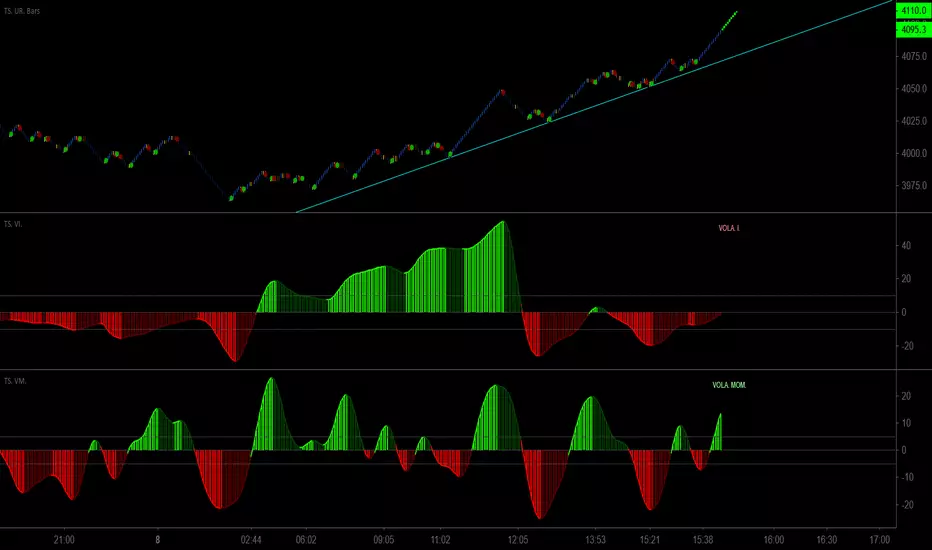
Trader Set - Volatility MomentumThis another one of the tools I missed publishing till today, this is a momentum indicator of volatility index (original formula), it will work hand in hand with volatility index oscillator (will publish right after this one) to easily identify divergences just before the market's direction change !
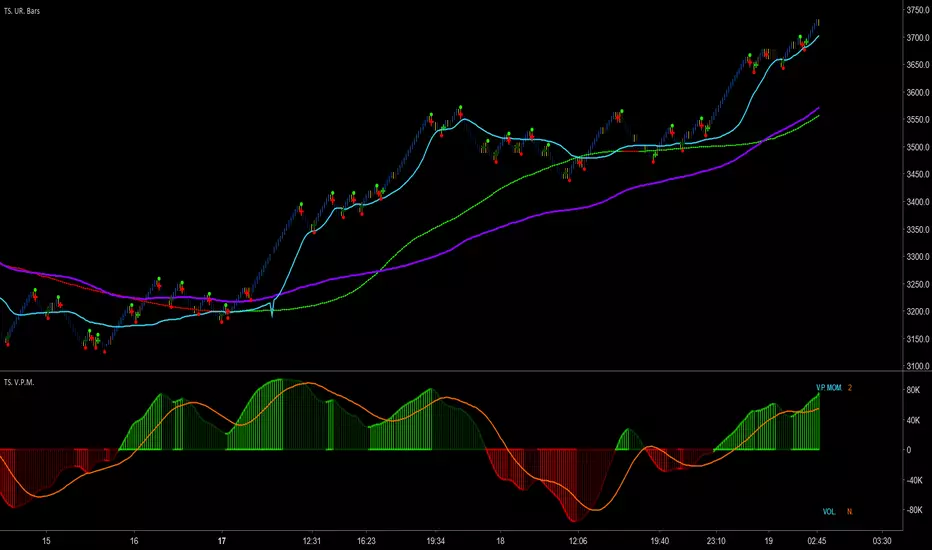
Trader Set - Volume Price MomentumThis is the latest tool in my methodology, a momentum indicator that combines PRICE and VOLUME.
There are two modes that you can use this : Normal, and Power Of Two. In the picture, the top one is set to normal, as you can see, it goes in the negative zone on each retrace, on the bottom one, we set it to the power of two mode, it still shows the same divergence in momentum vs price move but there is no negative section, instead, it only shows the POWER of the momentum without any direction indication.
Please don't contact me for getting access to these tools, they are only available to my students. Right now, the English version of the website and learning material is under development. The moment they are ready, I will announce it under every related script in the comment section.
Trader Set - Buy Sell PowerThis is an original oscillator I Developed for my methodology, the Idea and base thought of formula came from MACD, we all know that momentum, if being set correctly, is a leading indicator and actually, it's one of few real leading indicators, keeping that in mind a heavy R&D was done and the result is a formula that can show the momentum of buyers or sellers in the market, for buying momentum, the formula is totally different than selling momentum, but knowing that the correlation is there, I added both formulas into one oscillator that would be easy to understand and use in my methodology.
Please don't contact me for the access, access is given only to my students, the English version of the website and learning material is under development. As soon as they are ready, I will announce it under every related script in comment section.

B3 Least Squares Regression - "Price Leading MovAvg"B3 Least Squares Regression or "LSR" is very similar to the mid-line at the end of a linear regression channel, except that in a linear regression you cannot see the history of the regression well. There is also the linear regression and least squares curves in some platforms, and this would also be a similar indicator. The smoothness of my indicator and the back-to-basics approach to the mathematics sets it apart from the others. The look of this MA on a chart speaks for itself.
Some people like the flow of this indicator, as it will actually shoot out ahead of price. Most moving averages trail the price action; this one doesn't do that for long before it catches price or begins to lead price. It isn't necessarily a future price predictor; think of it as a slope stylist. The slope of this indicator determines all painting and signals for the strategy. There are two available versions: with or without order placement.

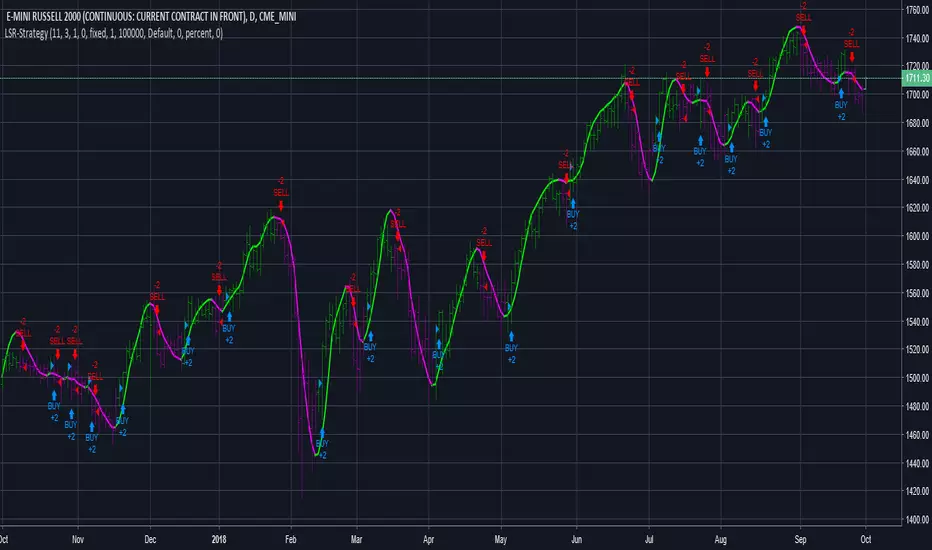
B3 LSR Strategy- "Price Leading MovAvg"B3 Least Squares Regression or "LSR" is very similar to the mid-line at the end of a linear regression channel, except that in a linear regression you cannot see the history of the regression well. There is also the linear regression and least squares curves in some platforms, and this would also be a similar indicator. The smoothness of my indicator and the back-to-basics approach to the mathematics sets it apart from the others. The look of this MA on a chart speaks for itself.
Some people like the flow of this indicator, as it will actually shoot out ahead of price. Most moving averages trail the price action; this one doesn't do that for long before it catches the price or begins to lead price. It isn't necessarily a future price predictor; think of it as a slope stylist. The slope of this indicator determines all painting and signals for the strategy. There are two available versions: with or without order placement.
Kairi Relative IndexKairi Relative Index indicator script. The Kairi Relative index is an old Japanese metric with unknown origins.
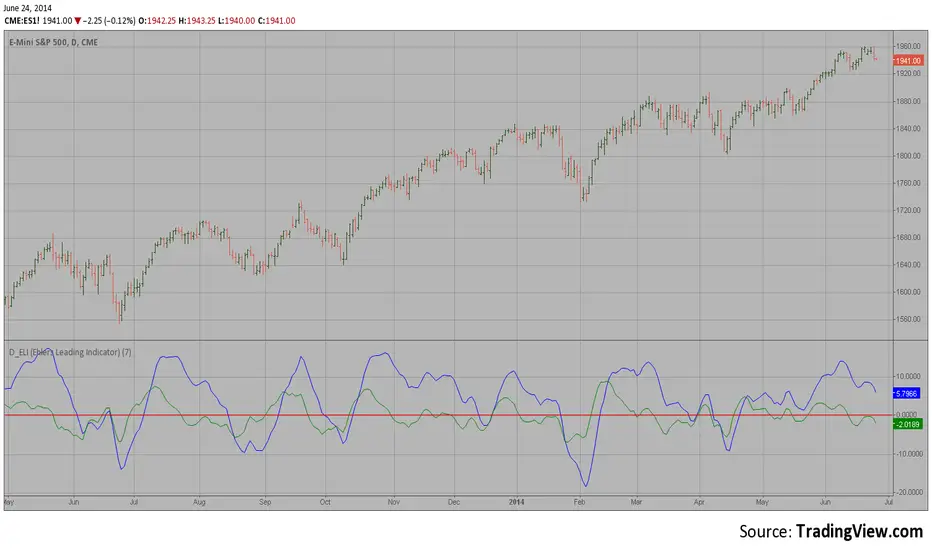
D_ELI (Ehlers Leading Indicator) This Indicator plots a single
Daily DSP (Detrended Synthetic Price) and a Daily ELI (Ehlers Leading
Indicator) using intraday data.
Detrended Synthetic Price is a function that is in phase with the dominant
cycle of real price data. This one is computed by subtracting a 3 pole Butterworth
filter from a 2 Pole Butterworth filter. Ehlers Leading Indicator gives an advanced
indication of a cyclic turning point. It is computed by subtracting the simple
moving average of the detrended synthetic price from the detrended synthetic price.
Buy and Sell signals arise when the ELI indicator crosses over or under the detrended
synthetic price.
See "MESA and Trading Market Cycles" by John Ehlers pages 64 - 70.