Synapse Level IndexSynapse Level Index Indicator
This indicator simply allows the user to set their desired "Lookback Period",
and "Lookahead Period" in the Bars Back and Bars Ahead, Pivot Settings. Once
selected, the indicator tracks the highest high from X Bars Ahead, and the
lowest low, from Y Bars Back. Then, the indicator calculates the Mean Value.
Then, the indicator proceeds to draw the High to Low range by Eighths.
Fear and Greed increase at these levels psychologically. Volatility Ensues.
Enjoy,
Mr. Storm
Levels

Key Levels by myooThis indicator plots key levels on the chart and can put a label on the price scale.
These levels can act as important support and resistance and cause big reactions.
• Open, High, Low, and EQ for the current day, previous day, current week, previous week, current month, previous month and current year.
•To show the levels on the price scale, you need to right click on the price scale, select "Labels" and turn on "Indicator and financial name labels" and "Indicator and financial value labels".
•In the settings under "Style", disable the "Labels" for a clean look.
In the settings window you can change the way the lines are drawn:
•Minimal: Lines are being drawn to the right for a clean chart.
•Standard: Lines are being drawn from the open bar of said period.
•Additionally, if you do not like to have the labels on the price scale, you can turn them of in the settings under the "Style Tab" by deactivating "Labels on price scale".
In this case, you can use the labels from the indicator itself, that are being drawn above the price line on the chart. Use the "Offset" setting to dial in the position to your preference.
Enjoy trading!

Range SlicerThis is a tool I quickly put together to work along side of my round number and Quarter Theory Scripts. This script allows you to set a price range between to values and slice them up into equal price zones. Happy Trading!
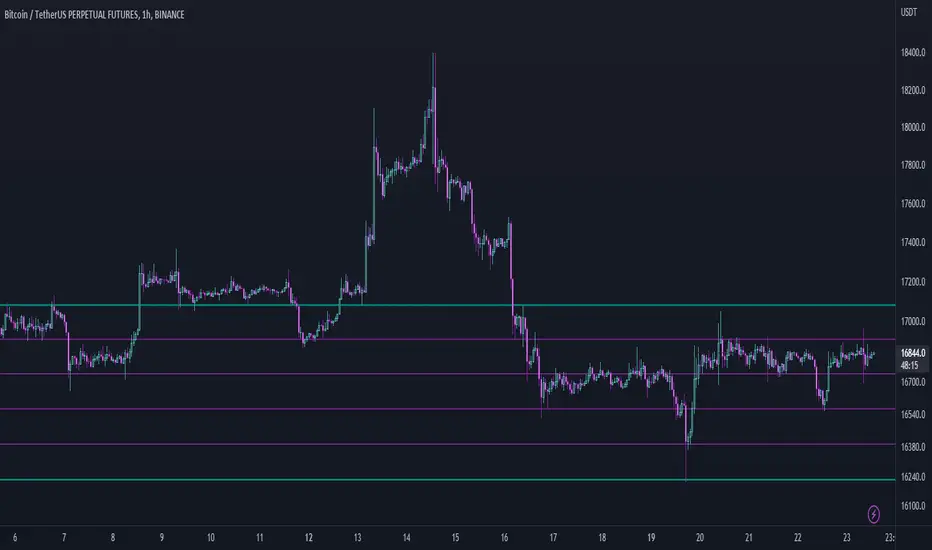
Support and Resistance Intensity ZonesSupport and resistance are often drawn using lines. This is too simple and doesn't give a clear idea of the market sentiment at these particular levels. What is strong support and resistance? What is weak support and resistance. How can either be defined by a single price point?
Using a simple, clean and configurable solution, this indicator not only shows these support and resistance levels as zones, it also gives them a colour gradient based on their intensity.
It does this by letting you choose the pivot highs and lows within a chosen range back. Then you choose one of two options to display how these multiple pivots at the same levels look. You can either group these pivots together into 'zones', where grouped pivots are all separated by a chosen price percentage, choosing how many zones to display, the most grouped pivots being the most intense colour.
Alternatively you display the pivots by 'gradient', where the closer the pivots are together in price the more intense the colour. As pivots diverge apart, the colour weakens.
Both of these options have to be seen to realise how much more there is to support and resistance than a single line.
Convert ETF to Futures/IndexThis indicator is used to automatically map an ETF's VWAP and 10 levels above and below the strike of your choice, to the futures or index instrument currently being viewed/traded. This works very well when using both SPY to ES/MES/SPX or QQQ to NQ/MNQ/NDX to plot the ETF strikes and can lead to some incredible trades, especially when trading level to level. Since SPY, QQQ, IWM, and DIA have the same price action as their futures iteration, there seems to be a direct correlation between their levels and VWAP . This indicator is made to easily map these key levels to the appropriate futures instrument. If you have a way to measure GEX centered around a certain level, I recommend color coding the lines to help indicate whether the level will have strong positive or negative gamma hedging associated with it.

Quarter Theory LevelsQuarter Theory Levels is a script that will create level lines based on major round numbers and spilt those levels into half and quarter ranges. This tool is intended to help traders see major levels that price will likely react to in the future.
The Script is inspired by Quarters Theory.

Round Number LevelsQuick Script to mark out round number levels. These levels often become reversal points or where the next price range will develop. This script is intended to be a tool to aid along with additional trading strategies.

[co.n.g.] ADR 5/10/14/20Average Daily Range (ADR) over 5/10/14/20 Days
What it is
One of the oldest measurements of price volatility that is being used in technical and statistical trading is the range of a specific period of past days to estimate probability of chances, risk and price movements, as seen f.e. in
Molodovsky, N. (1967). Building a Stock Market Measure—A Case Study. Financial Analysts Journal, 23:3, 43-46 , DOI: 10.2469/faj.v23.n3.43.
Problem
After having tried all available community scripts I've encountered various indifferences, especially since Pine v5.
First, the anchor period changed, when I've switched between regular and extended trading hours.
- This meant, that the anchor switched between the official open of the day and the first bar of a new day beginnig at 00:00 UTC (or the corresponding timezone).
Second, thus in some scripts also changed the calculated average range, including or excluding pre market and after hours.
And therefor third, in many cases the distance between open and ADR high/low was indiffferent, putting one closer and the other further away.
Why is that?
After having tried seven different modes of calulation - from ta. to array, it appeared that especially since Pine v5 the calulation is lagging when calling
the request.security function and is thus rendering the calculations indifferent.
Especially the open is lagging and plotting delayed, about 15 minutes on a M1-chart or about 45 minutes on a M15 chart, which made id difficult to spot open (test) drives
- as f.e. described in Dalton, J. F., Jones, E. T., & Dalton, R. B. (1990). Mind over markets: power trading with market generated information. 1st edition . Probus. -
and estimating extremely strong or weak open moves.
While switching between regular and extended intraday charts, the open was either calculated on the open as request of "D" (open of the regular session)
and "1440" (which means full intraday since 00:00 UTC or the corresponding timezone), leading to undesired anchoring.
After having tried about five different anchoring periods and comparing the adr to @TradingView 's stock screener, there was no proper calulation or plotting possible,
if not partially hardcoded (being the least desired, elegant or flexible method).
Visualizing the problem
As described in the picture:
@sherwind 's ADR is plotting entirely wrong! I couldn't even figure out (even the source is available) whre the problem is rooted.
@treypeng 's ADR is anchored properly, but unfortunately the calculation is wrong.
Originality
As evident in the attached picture - and you are able to compare this to @TradingView 's stock screener - in this script as well the ADR is calculated PROPERLY
as well as the anchoring is set PROPERLY within the first tick of the session.
As matter of fact, you don't have to examine different timeframes, charts or sessions simoultaneously to see the correct levels and
you're able to ease observations and focus on your trading.
Innovation
There is no innovative approach, as described above, simply because this statistical approach is around since the 1960's.
Considering coding, neither is, but it is properly calculated and anchored.
What this script does
Anchoring at the first tick of the new New York session
Plotting the actual - not the past nor future - average day range (gray lines in picture)
Plotting the actual - not the past nor future - 75% average day range ( silver lines in picture)
Vizualising ADR breakouts by colouring the backround green (long breakout) or read (short breakout)
Selection methods
Keeping it simple stupid, as of now:
Abiliy to chose between 5/10/14/20 days
Additional
Theory says, that we are staying within the ADR of 75% every day.
_
Alas, there are some exceptions.
If price is breaking out of the ADR, we are likely to move in this direction for the rest of the day.
If price has broken out of the ADR on the previous day, ist highly unlikely to expect another ADR breakout day,
which doesn't mean that there might not appear a strong or weak second day.
Notes
Designed for intraday stock trading of the U.S. market.
Best (and easiest) chances are to be spotted in special conditions.
//Cheers,
//Constantine

Dealar VIX Implied Range + Retracement LevelsThis Implied range Is derived by the VIX(1 sd annual +/- Implied move.)
This Indicator plots the daily Implied range, A lot of quantitative trading firms/ MM firms hedge their delta & gamma exposure around the Implied range(prop calc). I have added retracement levels as well, so you have more pivot levels.
Enjoy!

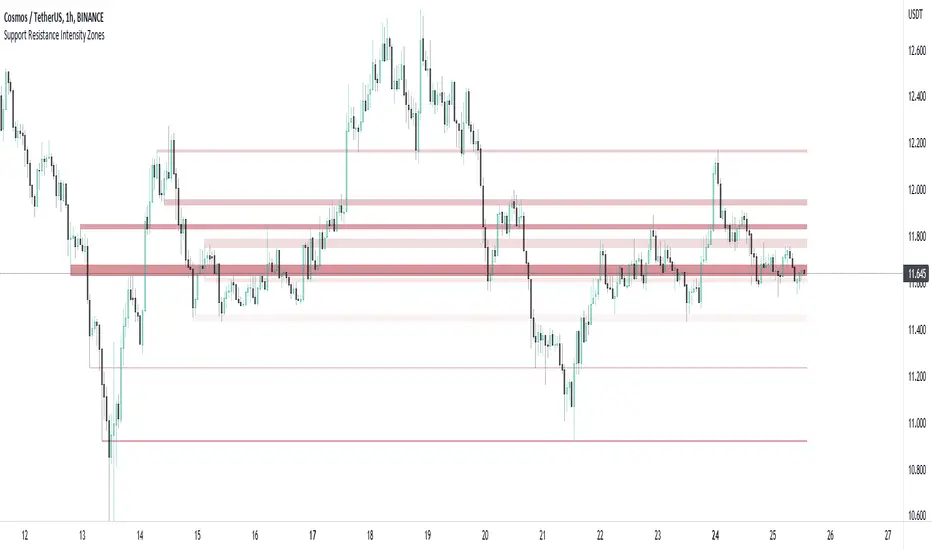
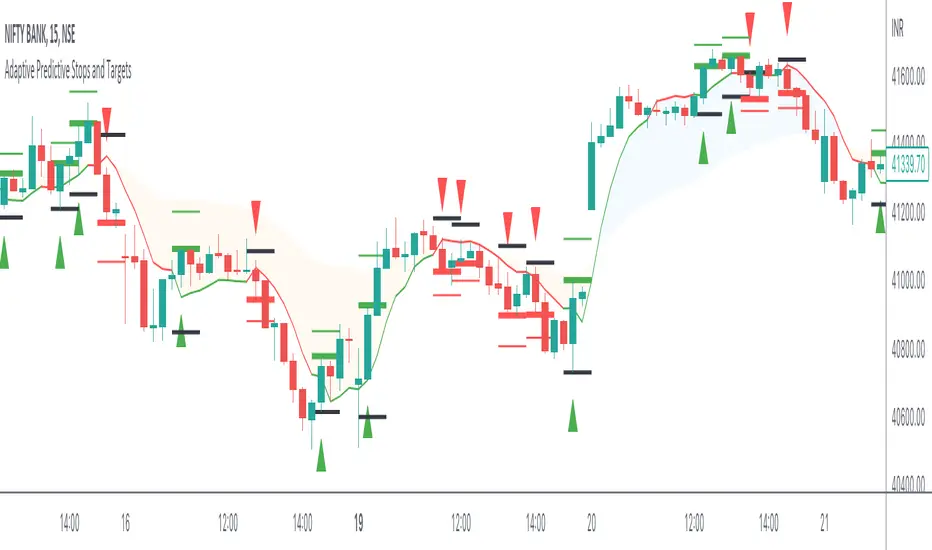
Adaptive Predictive Stops and Targets The indicator is an experiment to Predict Stops and 1st target for any liquid security and for any timeframe,
Intro
The indicator is made using Predictive Differential Filter of 2nd Degree
and an Adaptive Filter to generate Signals and define Targets and Stops
An adaptive filter is a system with a linear filter that has a transfer function controlled by variable parameters and a means to adjust those parameters according to an optimisation algorithm. Because of the complexity of the optimisation algorithms, almost all adaptive filters are digital filters. Thus Helping us classify our intent either long side or short side
The indicator use Adaptive Least mean square algorithm, for convergence of the filtered signals into a category of intents, (either buy or sell)
The Other Category of Filter used in the indicator is Predictive Differential Filter, which helps us estimate the acceleration of the prices and levels of significance for targeting and Stops
The Predictive Differential Filters are capable of predicting the next state of the input based on the interaction with a pre-specified number of filters, The prediction helps in minimising the quantisation error and in removing the granular noise which are caused by PCM systems.
How to Use
The logic to use is simple Buy at the High of the Signal Candle and Sell at the Low of the Signal Candle
Book your 50% position on the first target shown (respectively in green and red lines) and Trail the rest of the positions till you reach stop or breakeven!
vice versa for Sell,
Just Sell on the Low of the Signal Candle
What securities and timeframes will it work upon
The system is designed to work over any liquid security over any timeframe,
The Indicator has provisions for Alert
How to request Access
Just Private message me, do not use comment box for requesting access, use it only for constructive comments
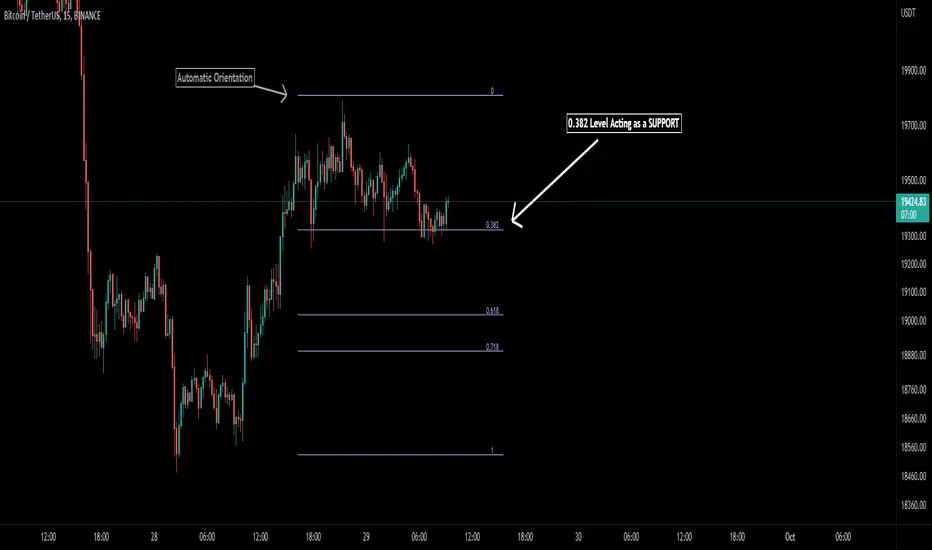
Auto Fibonacci [Misu]█ This indicator shows an automatic Fibonacci retracement levels.
This indicator is designed based on highs, lows, and trend interpretation to orientate the fibonacci retracement in the good direction.
Fibonacci analysis uses a logical sequence of numbers to predict trends and price action.
█ Usages:
The Fibonacci retracement is used to identify hidden support and resistance levels that an investor can use for entry, exit, and stop placement.
Depending on your usage, you can track breakouts above and below retracement levels to provide early entry points for major breakouts and breakdowns.
█ Features:
> Choose Fib levels
> Color Fib Levels all in one
> Color Fib Levels Individually
█ Parameters:
Deviation: A parameter used to calculate pivots.
Depth: A parameter used to calculate pivots.
UI Settings: Select Fibs levels and colors.
Delimited Levels Today Session - Colors as InputsThis script is an alternative to
It was developed to address user feedback / enhancement requests.
The difference is that the 12 color settings are separate input variables, and therefore will retain their values across level input value changes, and support 'default' template saving.

[FrizLabz]PB OLvlsDisplay Market Open and/or Premarket Open
Labels are offset to the right of Lines
You can adjust the number of opens back to display
If you want to change the format of the label please read the tool tip
Hope you enjoy
FrizLabz

Fib Percentage Previous Day CloseIntraday regulated markets move within their circuit range above or below which the market activity is halted.
These levels are protected by the MM to accumulate or distribute. These levels are mostly same for all markets i.e. 2%, 4% , 5%, 10% and 20% of previous day close, crossing which the market activity halts.
So, from here the expectation of turning or breaking increases.
This indicator automatically plots the levels and helps understanding the price behavior at these points. This in turn helps taking better RR trades.

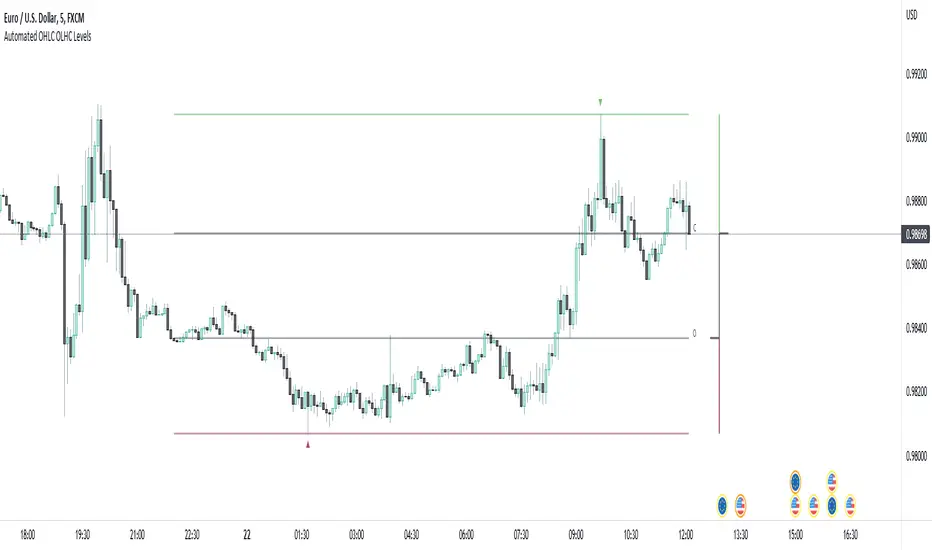
Automated OHLC OLHC LevelsA simple, clean, effective visualization tool, for the OHLC or OLHC of a chosen candle/timeframe.
Apply this indicator using a higher timeframe, in conjunction with other levels and the directional bias, to easily recognize trading opportunities at lower timeframes.
Price LevelsAuto plots significant Gann and Fib price levels using the all time range. Useful to quickly identify significant levels of support and resistance.

Candle Price FinderCandle Price Finder
A simple script that finds a candle (or candles) with user defined price levels. Search prices of a candle's high, low, open, close (or any element of the candle).
How To Use:
You can search prices with whole numbers and/or decimals. The search is tail end so if you are looking for a whole number that ends with 00 you type in 00 in search.
Indicator can be used to detect levels of interest, locked in range/points of consolidation. Originally coded to be used with anchored vwap.
Alerts included
In action:

Psychological levels (Bank levels) PsychoLevels v2 - TartigradiaPsychological levels (Bank levels) plots "round" price levels above and below current price, by truncating after the nth leftmost digits, based on neuroscience research of how humans intuitively calculate in logarithms.
Psychological levels, also called bank levels, are "round" price numbers around which price often experience resistance or support, because traders and investors tend to set orders around these round numbers.
Calculation here is fully automatic and dynamic, contrary to other similar scripts, this one uses a mathematical calculation that extracts the 1, 2 or 3 leftmost digits and calculate the previous and next level by incrementing/decrementing these digits. This means it works for any symbol under any price range.
This approach is based on neuroscience research, which found that human brains intuitively approximate numbers on a logarithmic scale, adults and children alike, and similarly to macaques, for more info see Numerical Cognition , Weber-Fechner Law , Zipf law.
For example, if price is at 0.0421, the next major price level is 0.05 and medium one is 0.043. For another asset currently priced at 19354, the next and previous major price levels are 20000 and 10000 respectively, and the next/previous medium levels are 20000 and 19000, and the next/previous weak levels are 19400 and 19300.
Usage:
* By default, strong upper level is in green, strong lower level is in red, medium upper level is in blue, medium lower level is in yellow, and weak levels aren't displayed but can be. Half levels are also displayed, in a darker color. Strong levels are increments of the first leftmost digit (eg, 10000 to 20000), medium levels are increments of the second leftmost digit (eg, 19000 to 20000), and weak levels of the third leftmost digit (eg, 19100 to 19200). Instead of plotting all the psychological levels all at once as a grid, which makes the chart unintelligible, here the levels adapt dynamically around the current price, so that they show the upper/lower levels relatively to the current price.
* A simple moving average is implemented, so that "half-levels" are also displayed when relevant (eg, medium level can also display 19500 instead of only 19000 or 20000). This can be disabled by setting smoothing to 1.
* By default, the script runs on the daily timeframe, whatever the current chart's timeframe is. This is to reduce the variability in levels, to make it less noisy than intraday price movement, but this can be changed in the settings.
* The step can be adjusted to increase the gap between levels, eg, if you want to display one every 2 levels then input step = 2 (eg, 22000, 24000, 26000, etc), or if you want to display quarter levels, input 0.25 (eg, 22000, 22250, 22500, etc). The default values should fit most use cases and cover most psychological levels.
I made this script mainly to train with PineScript, but I found it surprisingly accurate to define levels that are respected by price movements. So I guess it can be useful for new traders and experienced traders alike, as it's easy to forget that psychological levels can often be as strong if not stronger than technical levels. It can also be used to quickly screen other minor assets for trading opportunities. For example, a hybrid strategy would be to manually define levels on BTCUSD but using this script to automatically define levels in crypto altcoins and quickly screen them for a trade opportunity that can be greater than with BTCUSD but with the same trend.
Changes compared to v1:
* Deduplicated redundant calculations and hence faster script.
* Added half-step levels, which allows to more easily see breakouts (because the levels are still on-screen).
* All steps are now configuration on the GUI.
* Revamped color scheme.
* And major reasons to post as a separate v2 script rather than updating: because we can't update the original description nor screenshot. I have now read more about the House Rules and saw other scriptmakers, so I am trying to write better descriptions like wizards do, by explaining not only how the script works but what the underlying financial concept is to a neophyte audience.

Round NumbersThis is a variation of "Round numbers above and below" indicator by BitcoinJesus-Not-Roger-Ver. I've made it two sets of lines and round number range changeable. Defaults at 100 and 500 round numbers.

Simple LevelsSimple Level provides a (you guessed it) simple user to user level sharing experience, with less boxes, less formatting, and less hassle.
Simply insert your levels into the input box, separated by commas. That's it.
Example: 1,2,3,4,5
The Simple Levels indicator will automatically color your lines based on their position to the current close price.
If the level is crossed, the level line will change color.
This indicator is intended for those who just want to skip filling out boxes or typing in a tricky format, and cut to the chase.
There are additional, nice-to-have settings as well for the "more" technically inclined; however, nothing too complicated.
Enjoy!

All-In-One Sessions, Weekly, Monday, Previous Highs/LowsWe are forever drawing key levels on our charts with saved drawing templates, but finding the levels, adding the labels, is all tedious stuff. We have indicators, but we have multiple different ones at a time.
What if you could just tick a box on/off?
Well now you can.
This all in one 'levels' indicator is designed to show all the key highs and lows from previous weeks, Monday, the current week, as well as an option to highlight the market sessions and their highs and lows.
There are lots of options available for extending lines and choosing their colors, so once you have set it up how you want, don't forget to save YOUR defaults.
Oorah.

RSI + GDAX EMA ConfluencerHighly customizable RSI + GDAX EMA tool to help you quickly spot levels of confluence
- Displays current RSI levels as a plot
- Displays current 12 + 26 EMA as a plot
- 7 customizable time frames
- Each time frame marks RSI oversold, RSI overbought, 12 EMA, and 26 EMA as a line with label
- Each time frame RSI and EMA have options to toggle visibility and oversold/overbought only so you can choose exactly what you want to see
Planned for future release:
- Further customization for lines (color, size, direction, etc)
- Further customization for labels (location, offset, color, size, etc)
- Highlighting areas of confluence (if 2-3+ lines are within a certain % of each other)

TriexDev - Liquidation Rekt LevelsTriexDev - Liquidation Rekt Levels TradingView Indicator
A basic indicator which lets you see where positions will be liquidated. Each line is based on default leverage levels typically used for trading. (3x,5x,10x,25x,50x)
Have a subtle 'label prompt' on the 3x - because I had noticed some people didn't understand what labels were in other indicators.
In the settings:
- There is an offset to adjust the levels horizontally, this is to help make it easier to track if the chart has hit liquidation positions.
- You can change colours/opacity of the lines.
- You can hide the 'Labels', and/or 'label prompt'
- In the 'Style' tab you can hide individual levels.
Inspired/initially based off 'Mex Rekt Level'
I often have this added to my charts, and toggle visibility when I want to check the liq levels.
GitHub Repo for tidier/more detailed documentation as it is updated.
