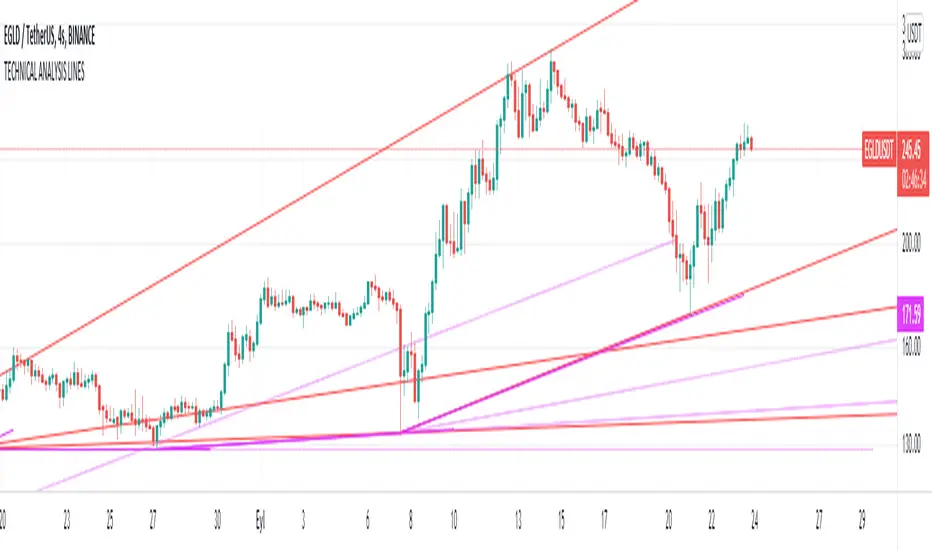
TECHNICAL ANALYSIS LINESTechnical analysis lines automatically do technical analysis for you. It connects the important points and allows you to see. It calculates the momentum of the price action and makes a target forecast. It should never be used as investment advice. Settings are designed to be fully customizable.
For access link on my profile or message me.
Enjoy :)
Lines
lineAlertslineAlerts is a powerful tool to define Buys, Sells and Buy-Sell lines for repeating actions.
The possibilities vary from 1 Buy and/or Sell to repetitive Buying and Selling at definable lines from a specified point in time (Year, Month, Day and Hour to begin).
lineAlerts provides:
+ optional StartBuy and optional EndSell
+ in repeat mode: optional definable ending-action (Buy or Sell, which overwrites Stop-Out/Abort)
+ buy- and sell Lines can be angled separately by using non-zero entries in the Angle %perDay parameter
+ configurable Stop Loss (Percentage, Stop-Out/Abort-Only, Flat or Angled like Buy-Sell-Lines)
+ profit calculation and effective alerts can be set further than the beginning time (ActiveAfter#Hours)
+ empty-bar-correction for lower-liquidity pairs on short timescales (automatically on)
+ optional visual extension to the right for currently active buy-sell lines
+ Slippage Max. Percentage parameter, added to order price for Buying, subtracted for Selling
(represented in the Buy-Sell markings and LastPrice lines, also calculated in Profit/Loss percentages)
+ Full Autoview Alerts automation in the Order parameters (for spot trading, this can be replaced with
your own API commands while creating or modifying the TradingView alerts):
- Separate order size entries for Buying and Selling
- Choice between Percentage or absolute Amount for both Buying and Selling
(choose the corresponding alert-drop-down option when creating an alert!)
The timeframe for running lineAlerts depends on the scale (duration) of the defined pattern.
Running on a very small resolution, e.g. 1-5 Min, is suitable for a pattern of a few days to a week at most.
This is because of the limited available historic data. Keeping your pattern lines shorter than a week on these micro-timeframes will produce accurate results/output. A pattern which may last a few weeks or even months can run flawlessly on a 1H resolution for example.
"Once per bar" is the best alert option in any case. To avoid multiple signals within 1 bar in highly volatile times, it is better to create the alert on the 1 or 4 Hour chart in stead of the daily chart for a pattern of multiple weeks for example.
lineAlerts is suitable for any timeframe on any chart which is open 24/7, like most crypto currencies.
My other published indicators contain a handy combination of new and classical indicators and oscillators.
With lineAlerts, the one defining the lines is in complete control. Results might indicate how good one is at defining trade patterns and at defining suitable stop losses, but lineAlerts is not an indicator as such.
lineAlerts is more something like a visually definable price-line alerter with various stop loss and ending options. There will be a video available with some more explaining.
WARNING:
Note that if an Autoview extension is active for the charted exchange and the according TradingView alerts are activated, it works right out of the box, so make sure to have all order decimals right...
GuidoN - December 2019, July 2020

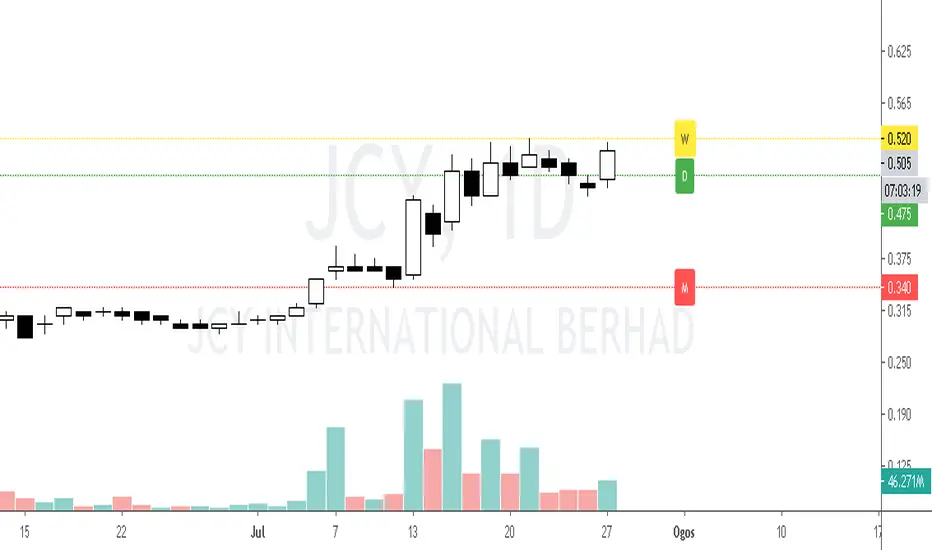
Previous HighHorizontal line for previous daily, weekly or monthly high.
By default :
Green Label - previous 1 day high
Yellow Label - previous 1 week high
Red Label - previous 1 month high
Each number and color can be change in setting.
Fibonacci EMA [sidd]EMA with Fibonacci Numbers, I have developed this system for finding trend , support and resistance in lower time frame and higher time frame.
If Candles closes below at least 4 Fibonacci line then trend is down if Candles closes are above minimum 4 Fibonacci line the trend is up.
Fibonacci line act as support for Uptrend market similarly same lines act as resistance for downtrend market.
Before new trend start all lines shrink together and looks like single thick line.
And When trend almost matures then all lines are expanded and they have spaces between them.
Hope it will help new trader. This study is not for Buy and Sell.

How To Show Vertical LinesExample of various methods to show dashed or solid vertical lines on chart based on using either session or time.
Credit for line method goes to midtownsk8rguy ->
Credit for plot method goes to PineCoders -> www.pinecoders.com
Special thanks to LucF, midtownsk8rguy, and PineCoders for permission to use their work.
NOTICE: This is an example script and not meant to be used as an actual strategy. By using this script or any portion thereof, you acknowledge that you have read and understood that this is for research purposes only and I am not responsible for any financial losses you may incur by using this script!

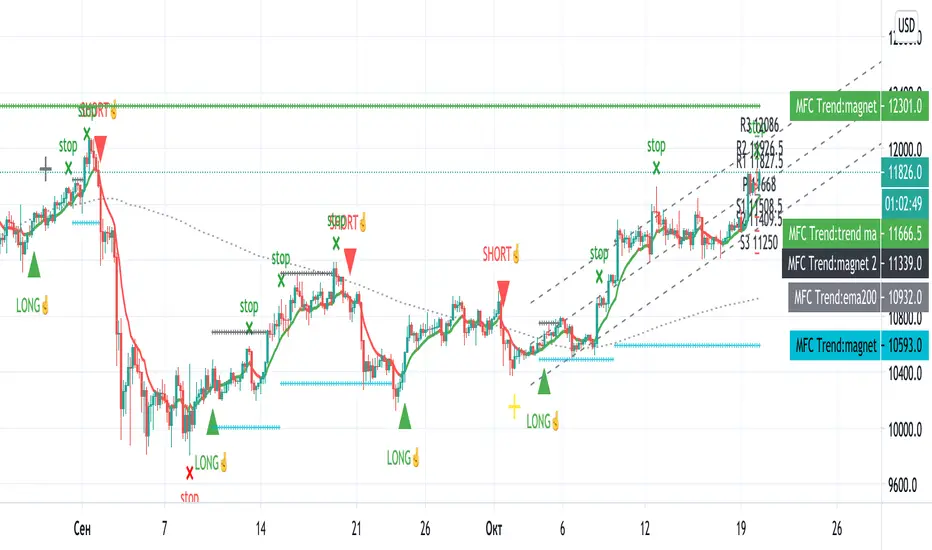
MFCTrade TREND v5 only 4 h The main trend indicator.
Suitable for 1H-1D, on any exchange and on any coin, currency pair, index.
There are basic settings that allow you to adjust the indicator individually for each situation.
Relative Strength Index custom lines and fillingI changed this RSI oscillator to give everyone ability to change position of strategic lines as RSI has a lot more to offer than only overbought and oversold boundries. You can change overbought and oversold line and make one more space depend what you are looking for. For me and as default it is 40-60 range. I put a center line at 50.

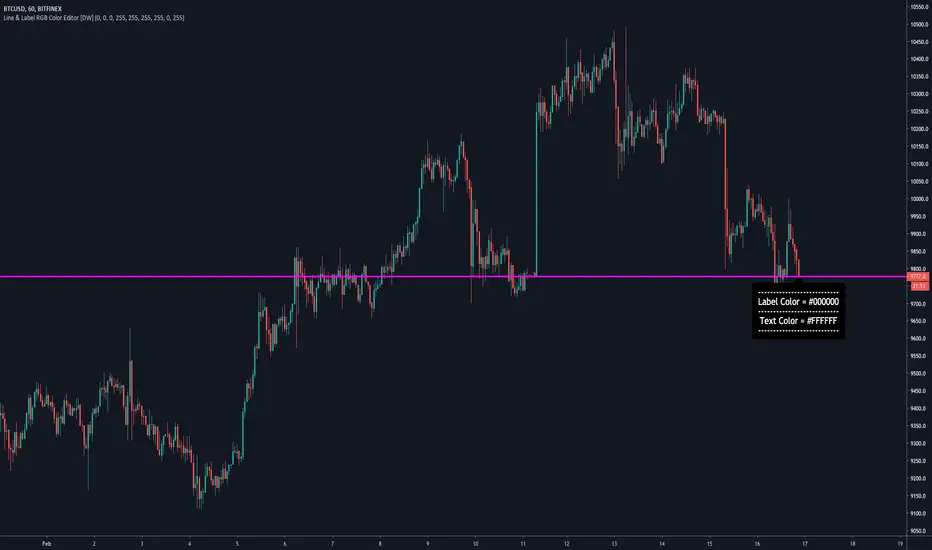
Line & Label RGB Color Editor [DW]This script is a template designed to provide developers with UI color customization for v4 lines and labels.
The color pallete used within this script is a full spectrum "web safe" format with 216 colors to choose from.
Colors are easily modified via the RGB inputs. The designated color selector function takes in the RGB values and returns the corresponding hex color.
Transparency can be modified as well. However, the color.new function only supports constant integers for transparency value, so it has to be manually adjusted within the code.
On line 42, you'll see a variable within the color selector function named trans. This is the transparency value, which can be set to any integer from 0 to 100. I have it set to 0 by default.
I included a sample label to demonstrate how the color editor works. It also displays the hex codes for the current label and text colors for some additional reference.
Implementing this in your own script is pretty straightforward.
All you need to do is copy the color selector function and inputs (feel free to name them whatever you want) into your desired script. Then, you can use them to declare your color variables.
[PX] MTF Standard Deviation LevelHello guys,
once again, I want to show you a different method for detecting support and resistance level. Today's approach is similar to the one I posted recently, but the way the level will be detected is different. I call it the multi-timeframe standard deviation level.
How does it work?
The method is similar to the way Bollinger Bands work. First, the indicator calculates the standard deviation, which can be influenced by the "Sensitivity"- and "Length"-setting.
Sensitiitiy - the higher the value, the fewer level will be shown
Length - simply the length for the standard deviation formula
Second, the detected value will be added (for resistance level) or substracted (for support level) from the current close. Once the upper or lower boundaries are crossed, a level will appear and keeps moving until the up- or downward movement finishes. Then the level will settle and stay in place.
Again, as seen in my previous indicator, you can control all the different styles and colors for the levels. The best part is, the whole thing works in a multi-timeframe fashion. In an example, you could select the "Daily" level and plot them on a 4-hour chart.
If you find this indicator useful, please leave a "like" and hit that "follow" button :)
Have fun, happy trading and once again Merry Christmas :)))

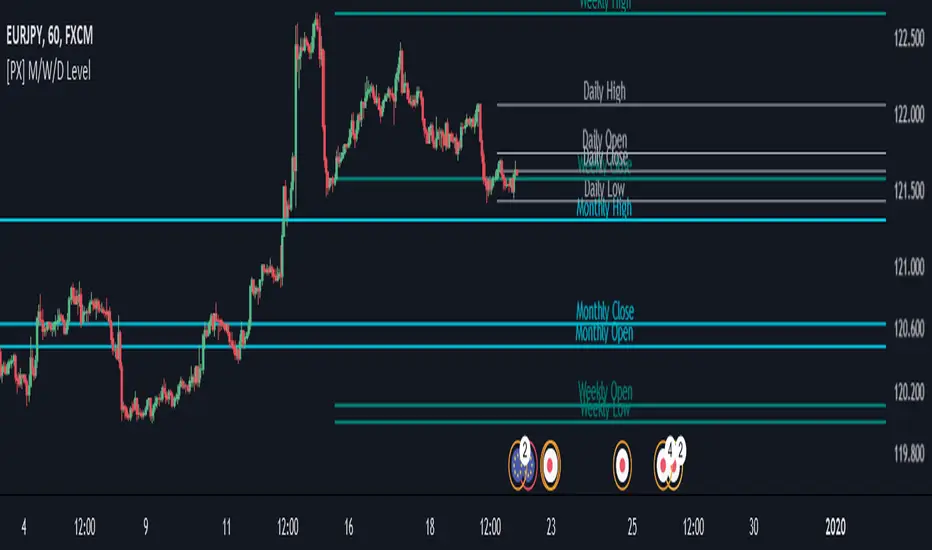
[PX] M/W/D LevelHey guys,
this script shows monthly, weekly and daily OHLC data represented as horizontal level.
I tried to make it as user-friendly as possible. Therefore, you can add different colors and styles for each level, as well as turn them on and off.
With the "Label Offset" -parameter you are in control where the label text should appear. You can shift it from left to right and vice-versa. To shift it to the left choose a negative value. To shift it to the right use a positive one.
This best setting for me personally is the "Candle Selection" -dropdown. This allows you to decide wether you want to show the previous candles OHLC-data or the current live OHLC-data.
!!CAUTION!! If you use the "Current Month/Week/Day" -selection be aware that values shown are "live"-data of the current candle. Therefore, values will change the same way your chart keeps changing on live data.
The "Previous Month/Week/Day" -selection on the other hand is historical data and therefore only changes once we reached a new month/week/day.
If you like my work, consider leaving a like :)
Happy trading!
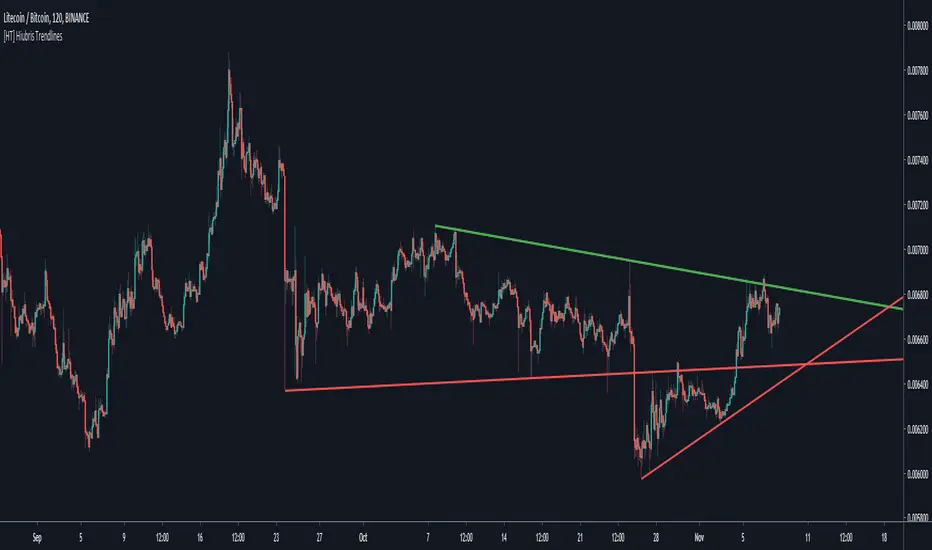
[HT] Hiubris TrendlinesHOW IT WORKS
This script automatically draws the last 2 TrendLines based on pivot points on the chart (wick to wick)
- Users can adjust the lookback length of those pivot points
NOTES
This Script is meant to help traders easily identify Trends and Trendlines
* This indicator does NOT Repaint! None of our published indicators repaint!
Price-Line Channel - A Friendly Support And Resistance IndicatorIntroduction
Lines are the most widely used figures in technical analysis, this is due to the linear trends that some securities posses (daily log SP500 for example), support and resistances are also responsible for the uses of lines, basically linear support and resistances are made with the assumption that the line connecting two local maximas or minimas will help the user detect a new local maxima or minima when the price will cross the line.
Technical indicators attempting to output lines have always been a concern in technical analysis, the mostly know certainly being the linear regression, however any linear models would fit in this category. In general those indicators always reevaluate their outputs values (repainting), others non repainting indicators returning lines are sometimes to impractical to set-up. This is what has encouraged me to make a simpler indicator based on the framework used in the recursive bands indicator that i published.
The proposed indicator aim to be extremely flexible and easy to use while returning linear support and resistances, an option that allow readjustment is also introduced, thus allowing for a "smarter" indicator.
The Indicator
The indicator return two extremities, the upper one aim to detect resistance points while the lower one aim to detect support points. The length setting control the steepness of the line, with higher values of length involving a lower slope, this make the indicator less reactive and interact with the price less often.
The name "price-line" comes from the fact that the channel is dependent on its own interaction with the price, therefore a breakout methodology can also be used, where price is up-trending when crossing with the upper extremity and down trending when crossing with the lower one.
Readjusted Option
The line steepness can be readjusted based on the market volatility, it make more sense for the line to be more steep when the market is more volatile, thus making it converge faster toward the price, this of course is done at the cost of some linearity. This is achieved by checking the "readjustment" option. The effects can be shown on BTCUSD, below the indicator without the readjusted option :
when the "readjustment" option is checked we have the following results :
The volatile down movement on BTCUSd make the upper extremity converge faster toward the price, this option can be great for volatile markets.
Conclusion
The recursive bands indicator prove to be an excellent framework that allow for the creation of lots of indicators, the proposed indicator is extremely efficient and provide an easy solution for returning linear support and resistances without much drawbacks, the readjusted option allow the indicator to adapt to the market volatility at the cost of linearity.
The performance of the indicator is relative to the motion of the price, however the indicator show signs of returning accurate support and resistances points. I hope the indicator find its use in the community.
Thanks for reading !
Note
Respect the house rules, always request permission before publishing open source code. This is an original work, requesting permission is the least you can do.

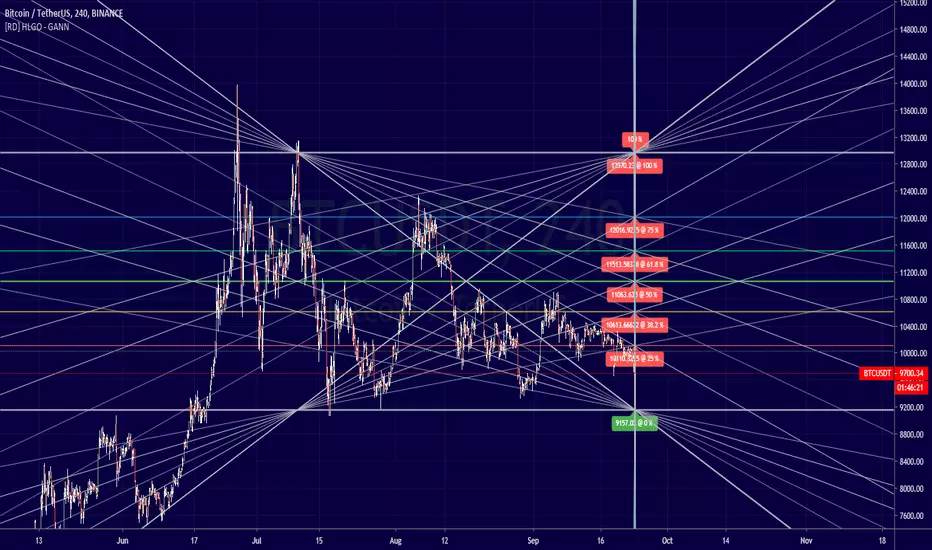
[RD] HLGO - GANN fibonacci (square/box, based on bars, h&l)==================================================================
Sept 24 - 2019 - HLGO - GANN V1
==================================================================
==================================================================
Description
==================================================================
Script to plot a gann related model (square / box ), try the different params.
Next version will be a time based version. Current version uses bars
(aka bar_index) so it can't plot beyond the last bar accept by extending
===================================================================
Version : v1 (notes
===================================================================
NaN
===================================================================
PLEASE -TIP- (we are trying to raise ₿100 to educate the wales)
===================================================================
BTC: 1C7sk3x8o2sX5eBV5HSz3KAgXJJ3FsF2Mo
ETH: 0xa14f3059EcDAE4aEe2E17826033E1D2C7e83233e
BNB: bnb1kwe3hqp4e8ch02ruhpclau4tvf0enzzh5tc2e3
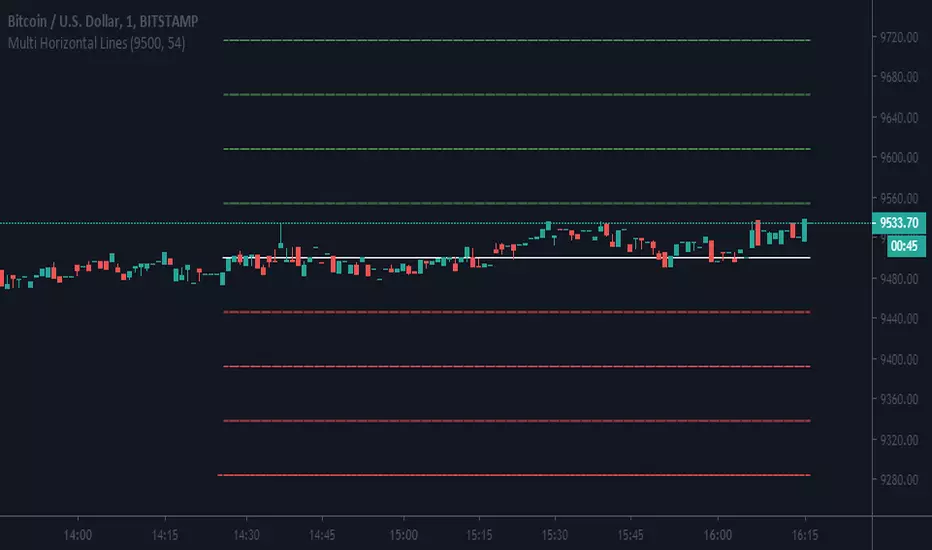
Multi Horizontal Lines 540Draws horizontal lines depends on condition of regular price, if 10000 then increment is 540, otherwise increment by 54

Multi Horizontal LinesAbility to plot multi price lines, go to settings and put price and increment of lines.
Enjoy
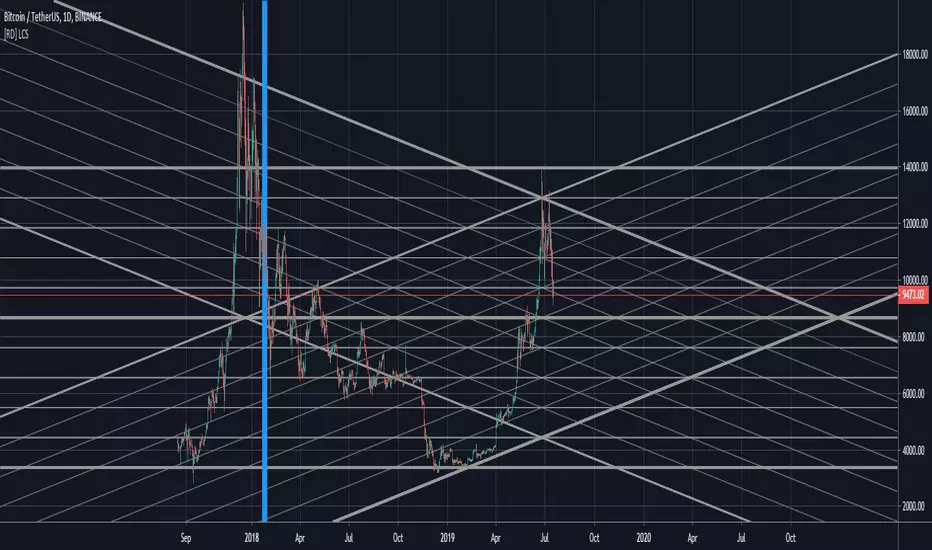
[RD] LCS - line channels (basic) v3 - [republish]==================================================================
July 18 2019 - LCS - line channels (basic) by RootDuk
Version : v3 - read the notes
==================================================================
Easy script to draw channels based on ie. GANN using the following
input params
- ibback : barsback to search for high and low
- ffactor : factor to up/downscale the lines
- oextend : extend lines, left, right, both, none
- bshowline : show horizontal lines yes/no
- bsshowdown : show diag down lines yes/no
- bsshowup : show diag up lines yes/no
- bshowindm : show index marker, where is you current ibback
===================================================================
Notes
===================================================================
When you use this code, pls let me know where and how you used it
as iam always curious what some can do with it. Thanks!
===================================================================
Updates
===================================================================
v1
v2 - July 17 2019
- Removed support wallets from source code. I think the source
- has been deleted because of this, find no other clue.
v3 - July 18 2019
- Republish
[RD] high / low lines pv4 v1==================================================================
July 7 2019 - high / low lines pv4 v1 - by RootDuk
==================================================================
Easy script to draw some lines on the input variable barsback.
You can extend the lines on the sides: left, right, both or none.
With the show variables (bools) you can show or hide the lines
Lines: high to high, low to low, high to low or low to high
Easy way to find support / resistance based on the past with
extended lines. Cheers and enjoy
===================================================================
Notes
===================================================================
Hope TV (pinescript) will get color inputs for line or a type color so we can
easily create inputs for colors for lines. Now its static. If someone knows
another way, pls let me know, i'll integrate it
===================================================================
Updates
===================================================================
Non so far v1

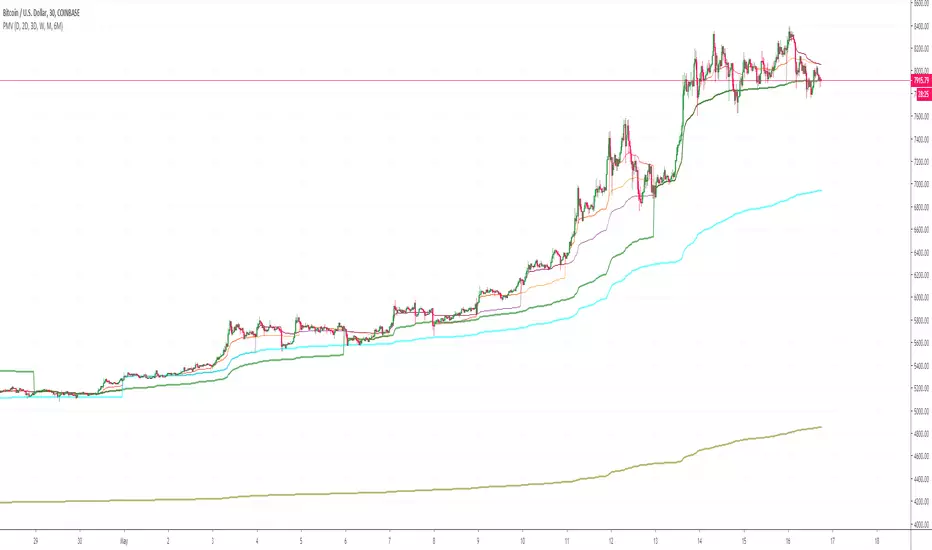
Perigraph's Customizable Multi VWAP LinesCustomizable Multi VWAP Lines
input examples:
30, 60, 120, 180, 240,360,480, 720 = minutes
D = Days
W = Weeks
M = months
12M = 12 Months
Simple LinesIntroduction
Making lines is great in technical analysis since it can highlights principal movements and make the analysis of the price easier when using certain methodologies (Elliott Waves, patterns).
However most of the indicators making lines (Zig-Zag, simple linear regression) are non causal (repaint), this is the challenge i tried to overcome, making an indicator capable of making lines in a smart way (able to follow price without loosing a linear approach) and with the least lag possible, i inspired myself from the behaviour of the renko when using a small brick size. This indicator does not repaint .
The code is short and i hope, understandable for all of you, making lines is not a difficult task and its important to know that when a problem appear complex it does not mean that the code used to solve this problem must be complex. Lets see the indicator in details.
The indicator
The indicator have 4 parameters, the length parameter who control the length of lines, the emphasis parameter who control the stability and also the ability to make lines closer to the price (thus minimizing the sum of squares) , the mult parameter which is similar to emphasis and a point option that we will discuss later.
When emphasis and mult are both equal to 1 the indicator will sometimes draw a perfect line, however this line will try to follow the price and thus can create a noisy result.
This is where emphasis and mult will correct this behaviour. The emphasis parameter give a more periodic look as well as some control to the lines but can also destroy them.
This should not happen with mult , this parameter also give more predictability to the lines. Overall it correct the drawbacks of the parameters combinations mentioned earlier.
Its also possible to mix both the emphasis and mult parameter, but take into account that when both are equals the result consist of less reactive lengthy lines with low accuracy. Its better to only use one of them and let the other stay to 1.
Point Option
The indicator can sometimes have a weird look, appearing almost flat or just dont appearing at all. When such thing happen use the point option.
XPDUSD without point option.
with point option :
Time Frame Problem and Its Fix
When using higher time-frames the result of the indicator can appear different, in general the higher the time frame the lengthier are the lines. In order to fix this you can use decimals in the length parameter
length and mult both equal to 5.5, emphasis cant use decimals.
Conclusion
I have highlighted a simple way to make use of the small renko box size method in order to return reactive lines without making the indicator repaint. However Its ability to be close to the price as well as being always super reactive is not a guarantee.
For any suggestion/help feel free to pm me, i would be happy to help you :)

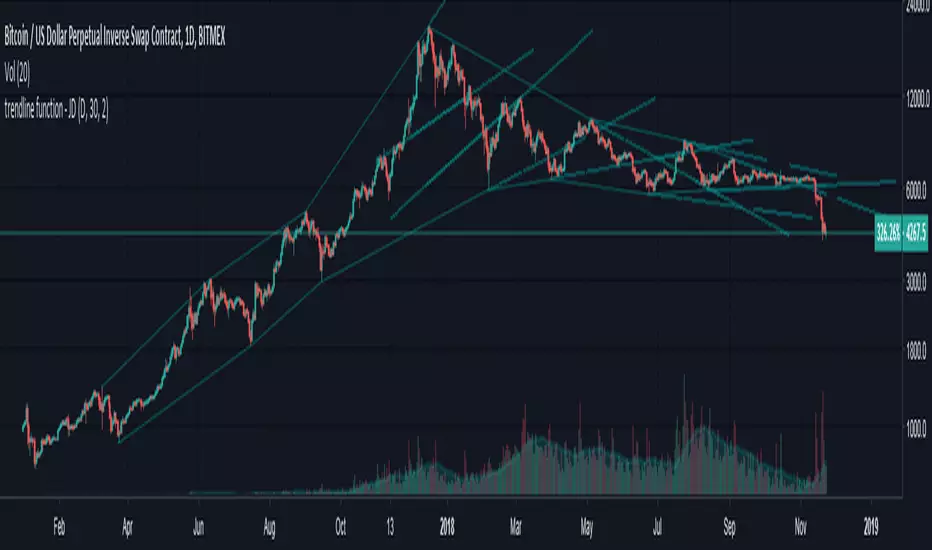
trendline function - JD!EXPERIMENTAL!
As TV doesn't provide a function to draw lines between points, I wrote a function to do this in one my own indicators.
The function itself however can be applied/modified for different use cases, eg. drawing trendlines.
In this (proof of concept) example I used it to draw lines based on past high/low pivot points.
The inputs required:
* an INPUT FUNCTION (in this form, its designed to work with functions that have occasional values and na-values between them, it then connects the non-zero values to form a line)
* a BOOL (to indicate if you want to draw only the rising or falling lines)
* a DELAY (in this case this is the lookback period for the pivot-points function, this is to compensate the calculation of the past and realtime points)
The function returns:
* the function to draw the extension from the BASE-LINE to the current time (here this is the connection of the last pivot-point to the current point to bridge the gap of the lookback period, this is NOT REALTIME!)
* the function to draw the extension for the current time (here this is the continuation of the line until a new pivot-point is valid, this is DRAWN IN REALTIME!!)
* the color of the lines (in this case the lines are only colored (lime or fuchsia) if they either go up or down, else they are invisible, this is to clean up the invalid lines)
these output functions can then simply be plotted using the 'plot' function.
JD.