BTC Sentiment analysis RSI 2xEMAThis is a CRYPTO correlation strategy, which is using BTC sentiment with BITFINEX long and short ratios.
WIth them we are making from one side 2 RSI, one for long and another for short. And from another side, we are going to make multiple EMA's, using the ratios for long and short.
Rules for entry
For this scenario I created a long only strategy.
The long entry condition is : we have a crossover of the rsi long ratio with rsi short ratio and long ratio from BITFINEX is above the long EMA and short ratio from BITFINEX is below short EMA.
We exit when we get the opposite condition, in this case we have a crossunder of the rsi long ratio with rsi short ratio and long ratio from BITFINEX is below the long EMA and short ratio from BITFINEX is above short EMA.
If you have any questions, let me know !
LINK

Carpe Diem 2.0 [Alerts]Carpe Diem 2.0 Alerts, Still automating the original Carpe Diem scripts, now the V2 uses heavy Volume based filtering to help only trade in bullish markets,
Search for Carpe diem 2.0 to see backtest results
This Alerts script has been created to help with bot Automation allowing you to create custom alerts
This script has 10 variations built within it which are fitted for the coins differnt coinditions
The coins included are
DOGE/USDT 4H
XRP/USDT 4H
LINK/USDT 4H
MATIC/USDT 2H
SRM /USDT 6H
COTI/USDT 4H
DOT/USDT 3H
TRX /USDT 4H
RSR/USDT 4H
ATOM/USDT 4H
How to use the Indicator
You can change what plots are shown in the settings Cog, I toggle all plots off apart from the coin I am trading
When the Volume Average line is green, the market is up trending and will be looking for a trade whereas when they are red, the market is in a sideways or downtrend.
You can ignore the color of the line and just base the bullish / bearish bias based of the Volume line being above/below 0
The script is written in version 4
When you go to create an alert with this script you will see 20 options, 10 for opening longs on certain conis and then 10 to close them
This strategy performs best on the Binance listings

Betelgeuse-Good entry/exit zoneHello everyone and welcome!
This is the my first indicator and also the first version of Betelgeuse script,I hope you will like it.
The indicator was designed to be used on cryptocurrencies
The idea is to be able to identify good entry and exit points in the market, traders often try to identify the minimum or maximum points and this is why Betelgeuse was born.
Betelgeuse should be combined with your analysis and other indicators to find good entry and exit zones and not a precise point.Obviously the more the indicator will be used
over long time frames the more accurate the signals will be.
You can decide to wait for a good signal from the RSI or from the MACD and add up
the Betelegeuse confirmation for a good entry or exit from the market.
The MA based indicator will give you an idea of the direction of the medium term trend.
Direct message me for acces.
Crypto Derivatives Sentiment HeatmapWhat?
This is a heatmap that shows derivatives sentiment for some of the most prominent coins in crypto.
Content
Coins included:
BTC
ETH
LTC
DOT
LINK
YFI
The indicator takes the Binance USDT perpetual swaps of these coins and compares them to their respective spot indices.
Binance is the exchange of choice because their perps have the highest volume in the market.
For the spot indices I've used the indices created by Bitmex.
These are very intricate and weighted indices with compositions of the most important and trustworthy spot markets.
For more information check the Bitmex website.
The heatmap shows red coloring if the perp is trading above spot (bearish).
It shows green coloring if the perp is trading below spot (bullish).
The lighter the color the less wide the gap is between perps & spot.
The darker (brighter) the coloring the more extreme the difference.
Trading
It's quite simple.
When you see a lot of green, preferably dark green, you should have a bullish bias because it means that perps are oversold or that spot is bidding hard.
Vice versa a lot of red should give a bearish bias.
It's very practical for a quick sentiment check.
This indicator is free so you can just add it to your favorites.
Shout-out to zzzcrypto123 for inspiring me.

OnTheMoveWith this plot one is able to compare the different % change in the given time frame. It calculates the sma of a given period (defval = 7) for the close/open.
Strategy would be to choose (trade) from one to other asset in order to get higher rates when pumping or lower when dumping.
The Symbol & exchange has to be specified.
defSymbols = BTC, ETH and LINK
defExchange = BINANCE

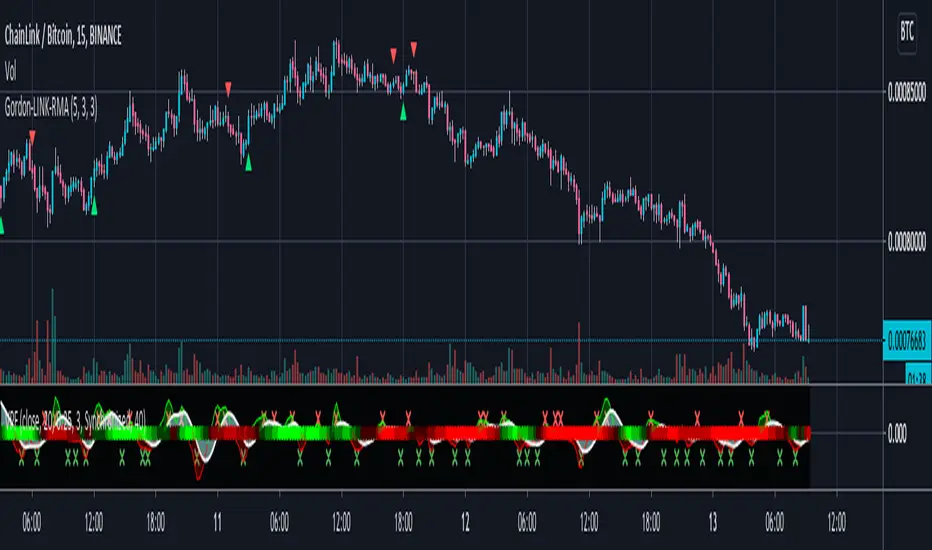
Gordon-LINK-RMA - LINK/BTC - Trend Indicator (Swing)Configured specifically for LINK/BTC Markets on Binance. Plots changes in low timeframe trend based off Multiple timeframe RMA values.
Buy = Green Triangle
Sell = Red Triangle