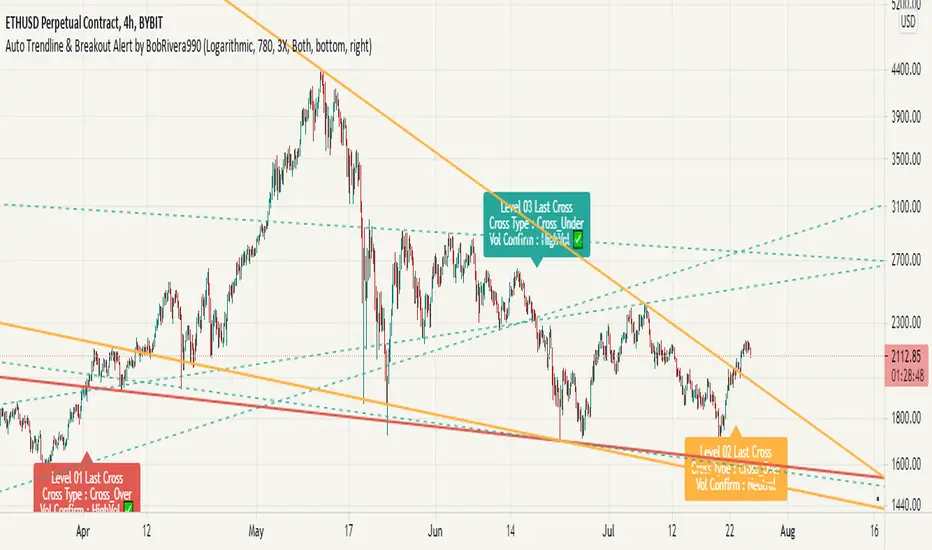
Auto Trendline & Breakout Alert(Linear / Log) Full-VersionContents
Overall Introduction
Does it repaint?
Features
Settings menu parameters
How to setup
Limits
Errors and Performance
Examples
Overall Introduction
This indicator is the best tool for breakout traders.
Drawing and evaluating the trend lines of multiple charts in different time frames is a very time-consuming and tedious task. In addition, being aware of breakouts in the shortest possible time requires constant monitoring.
With this tool, you can draw and classify trend lines in a fraction of a second and by placing an alert on any chart, you can receive notifications about breakouts, wherever you are.
The classification of trend lines is done based on the reaction of the price chart to the trend lines and the analysis of the trading volume.
This indicator is designed to reclassify trend lines with each reaction of the price chart. These lines are classified into 6 levels and these levels are distinguished by different colors. Thus, any touching or crossing of the price chart can make a difference.
Does it repaint?
Any tool that shows trend lines must repaint because trend lines are constantly changing. Some lines lose their strength and new ones are formed, so some lines should be removed and replaced with new lines and that means repainting.
The indicator should reflect the latest changes. So while repainting is a bad thing in a strategy, it is essential in this indicator.
This indicator is designed to reclassify trend lines with each reaction of the price chart. Thus, any touching or crossing of the price chart can make a difference.
Note that unlike alerts, breakout labels are not trading signals:
Breakout labels show the latest breakout for each level based on the lines that appear on the chart, so they may repaint or have delay.
But Alerts work differently, Alerts are triggered when one of the trend lines is broken and then the next candle is opened and has no any delay.
Features
This indicator is designed for use on both linear and logarithmic scales. It works linearly by default. If you are using a logarithmic chart, enter the settings menu and set the chart scale parameter to “Log”.
The indicator is equipped with the volume status tool to identify and avoid false breakouts. Note that you can't completely avoid false breakouts, but you can minimize risk and loss. I have already published volume status as a separate script.
Several filters are provided to customize alerts. You can limit alerts based on the level and strength of broken trend lines, volume status, and type of breakout (Cross-Over, Cross-Under, or both).
The last breakouts panel gives an overview of the current market situation. You can activate it in the settings menu. the figure below shows the panel:
Settings menu parameters
{Chart Scale …} =>
Set it according to the chart. If you are using a linear chart, select the "Linear" option or if you are using a logarithmic chart, select the "Log" option
{Max Operational Range Length ...} =>
This parameter specifies the number of candles processed by the indicator (By default, the last 1000 bars)
{Filter Out-Of-Range Lines} =>
The filter removes diverging or out-of-range lines and reduces the clutter of the chart
{Visible Trend Lines ...} =>
In this section you can specify which level of trend lines should be visible. Level 1 contains the strongest lines and level 6 contains the weakest.
{Alert Condition 01 _ Trendline Levels} =>
In this section, you can specify which level of trend lines will trigger an alert after the breakout. This section has been added to customize alerts.
{Alert Condition 02 _ Cross Type} =>
In this section, you can limit alerts based on the type of breakout (Cross-Over, Cross-Under or both). This section has been added to customize alerts.
{Alert Condition 03 _ Volume Status} =>
In this section, you can limit alerts by volume to avoid fake breakouts. This section has been added to customize alerts.
{Last Breakout Label} =>
In this section, you can enable or disable the last breakout labels.
{Panel} =>
In this section, you can enable or disable the last breakout panel or set its position on the chart.
How to setup
There are many parameters in the settings menu, but two are more important. One is “Chart Scale” and the other is the “Max Operational Range Length".
Set the “chart scale” parameter according to the chart, otherwise the trend lines drawn by the indicator do not match the price chart.
If you are using a linear chart, select the "Linear" option or if you are using a logarithmic chart, select the "Log" option.
Max Operational Range Length Limits the range of the price chart that is processed by the indicator.
By increasing this parameter:
The strength and durability of the trend lines increases.
The number of breakout signals decreases.
The importance of breakout signals increases.
The indicator processing load increases.
In the following figure, you can see the effects of increasing the “Max Operational Range Length" parameter:
Limits
Since this indicator makes extensive use of trading volume, it is necessary to use a chart with volume information.
But if the volume information is not provided by the vendor, indicator will continue to work based on the price chart only, and a warning message will be displayed below the chart to let you know.
Errors and Performance
The performance of this indicator depends on the “Max Operational Range Length” parameter in the settings menu because it performs calculations, within a range with the length of this parameter.
By increasing this parameter, the processing load increases. Sometimes you may encounter the following error: “Loop takes too long to execute (>200 ms)”
If you see this error, do one of the following:
Reduce the “Max Operational Range Length”.
Reset the indicator. To do this, double-click on the “Hide” button in front of the indicator name.
Examples
EURUSD (FX:EURUSD) – 1D // Scale: Logarithmic, Max Range Length = 1000, Filter: 2X
NASDAQ 100 (CME_MINI:NQ1!) - 1D // Scale: Logarithmic, Max Range Length = 700
GOLD (COMEX:GC1!) – 1D // Scale: Logarithmic, Max Range Length = 650, Filter: 2X
NATURAL GAS (NYMEX:NG1!) – 1D // Scale: Logarithmic, Max Range Length = 625, Filter: 4X
AMAZON (NASDAQ:AMZN) – 1D // Scale: Logarithmic, Max Range Length = 1750, Filter: 2X
APPLE INC (NASDAQ:AAPL) – 1D // Scale: Logarithmic, Max Range Length = 340, Filter: 4X
GBPUSD (FX:GBPUSD) – 1D // Scale: Logarithmic, Max Range Length = 1000, Filter: 3X
SILVER (COMEX:SI1!) – 1D // Scale: Logarithmic, Max Range Length = 550, Filter: 3X
BITCOIN (KUCOIN:BTCUSDT) – 4H // Scale: Logarithmic, Max Range Length = 1250, Filter: 3X
MICROSOFT (NASDAQ:MSFT) – 1D // Scale: Logarithmic, Max Range Length = 340, Filter: 4X
TOTAL (CRYPTOCAP:TOTAL) – 2H // Scale: Logarithmic, Max Range Length = 1075, Filter: 3X
LOGARITHMIC
Log Scale Linear RegressionThis indicator is basically the standard linear regression but adjusted to be suitable for log scale.
You can use 2 different standard deviation values, choose the data source and lookback length.
The colors are chosen directly on the main menu.
Enjoy!

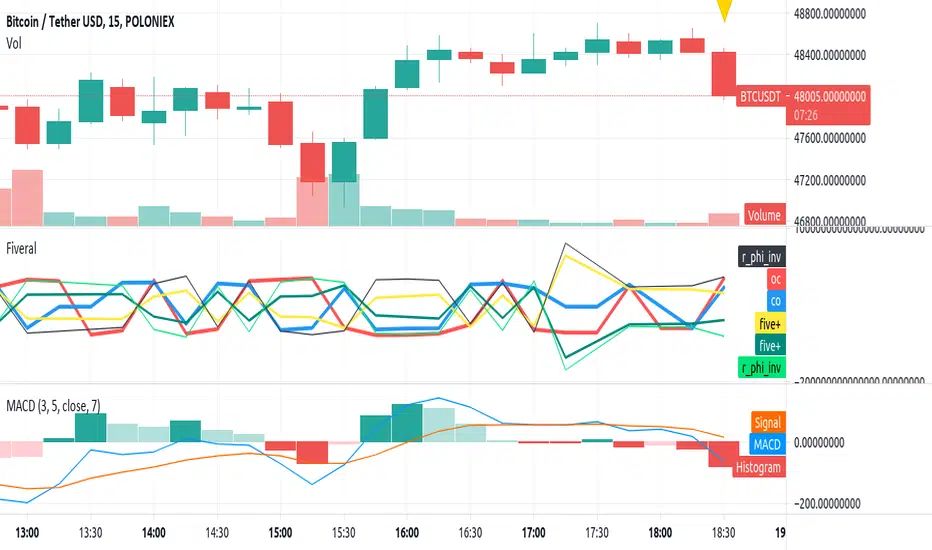
Fiveral: Repulsion/Golden Radio HackAnother in a series of experimental indicators using logarithmic scale visualisation.
This one extends into some work on I've been doing on 'the cube', but Pine isn't liking multiple log lines even when the equations are included for each plotted variable, meaning, no variables used in the definition of a variable, as is done here. As a result, accuracy of this indicator can't be guaranteed between scales, or during use.
Have at it, and enjoy!
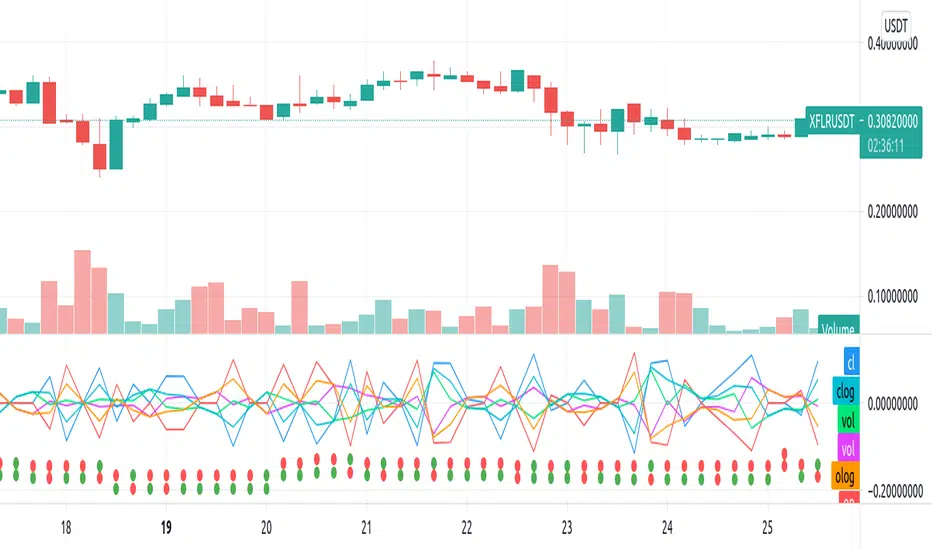
Repulsion: Price & Volume 1Repulsion: Price & Volume 1
www.quantamagazine.org
Proof of concept using the above link and comparisons of price and volume, and one of a series stemming from the so-called Repulsion Engine, now also open sourced, and other indicators from the workbench.
Traffic lights are not accurate.
Like it if you use it, drop a line if you update it -- or if you have comments about how to improve it.
Log MACDThis is just a MACD indicator using the log of the closing price rather than the normal closing price. Useful for exponentially growing stocks and cryptocurrency.

[FTA] Logarithmic MACD with Regular and Hidden DivergencesThis is a highly stable, volatility adaptive, Moving Average Convergence Divergence (MACD) that uses a modified calculation based on improved logarithmic measurements of the momentum.
1- This MACD provides the trader with most accurate detection of divergences, both regular and hidden ones, and shows them on the MACD Histogram.
2- Furthermore, the MACD/Signal divergences are also easily detectable (unlike the regular MACD which often does not provide accurate divergences; see the screenshot for comparison).
3- Finally, due to some different calculation methods, this MACD, unlike the regular MACD, is highly stable in higher time frames even in the most volatile markets (such as BTC, ETH, ADA, etc...) and thus can easily be utilized for the market prediction state in the crypto (see the screenshot for comparison).
Use it and let me know what you think about it in comparison to regular MACD!


Valero Logarithmic RegressionBTCUSD Logarithmic Regression
Inspired by: trolololo & Über Holger.
Make sure you have "log" and "auto" turned ON!
BLUE: BUY!
GREEN: ACCUMULATE
YELLOW: HODL!
ORANGE: FOMO / IS THIS A BUBBLE?
LIGHT RED: SELL!
RED: MAXIMUM BUBBLE TERRITORY

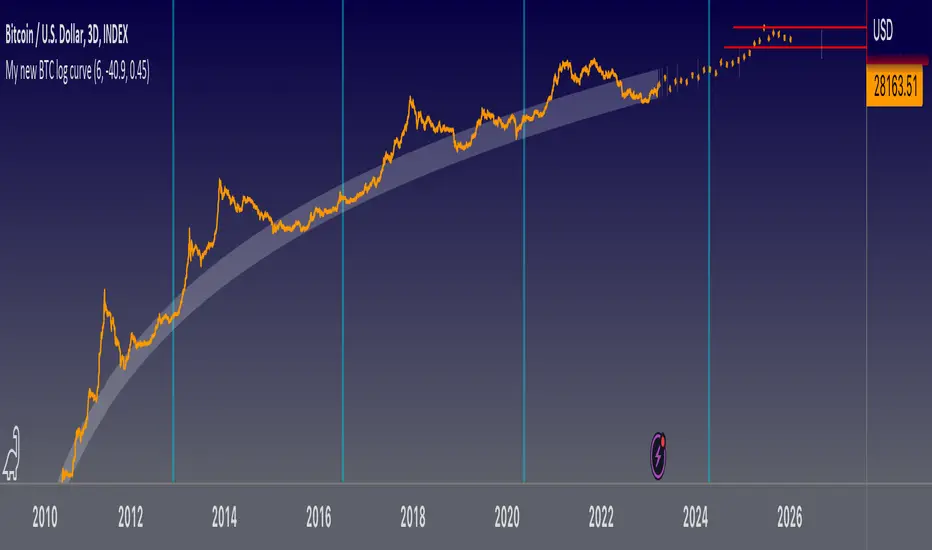
My new BTC log curveThis is my new logarithmic regression curve to the USD/BTC price chart. It is based on a new, very simple equation: y = (e^b)*(x^a), where x is number of days since the Genesis block, a and b are parameters set by the user. Also included is an upper regression curve that is fit to the peaks of each Bitcoin cycle; no fundamental analysis went into making these lines, they are merely fits to the data, so it should not be expected that they can be used to predict tops and bottoms. The upper regression curve is the product of the support curve (lower curve) and two other factors: a constant, and an exponential decay. The constant and the decay factors are parameters that can be set by the user.
Logarithmic Trend lineLogarithmic Trend line is used to model data where growth or decay accelerates rapidly at first and then slows over time.
This model is for the long term series data (such as 10 or 20 years time span).
Technical issues
*The user have to pan over the chart from the beginning to the end of the study range (such as 10 years of bars) so the pine script could generate those lines on the chart.
*If on the chart the number of bar is less than the lookback period, it won't generate any lines as well.

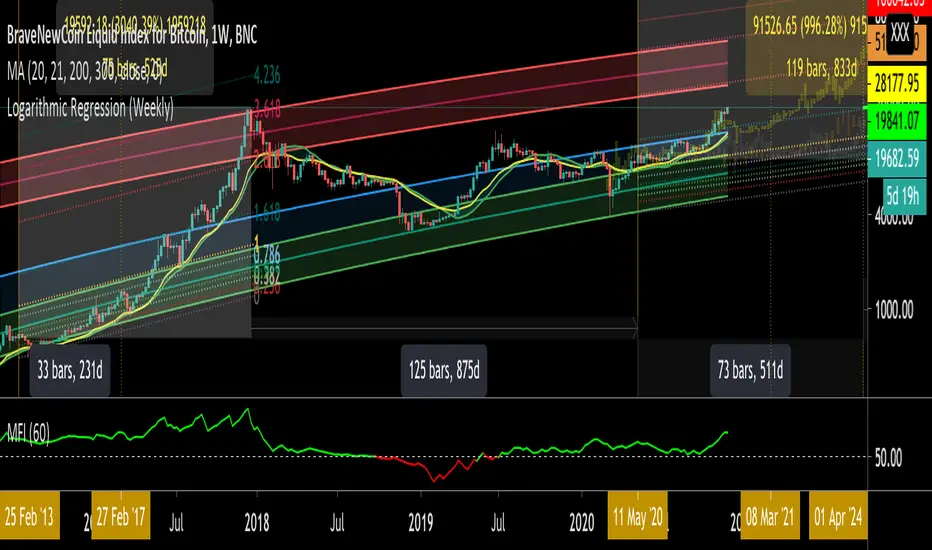
Logarithmic Regression (Weekly)This script is a combination of different logarithmic regression fits on weekly BTC data. It is meant to be used only on the weekly timeframe and on the BLX chart for bitcoin. The "fair value" line is still subjective, as it is only a regression and does not take into account other metrics.
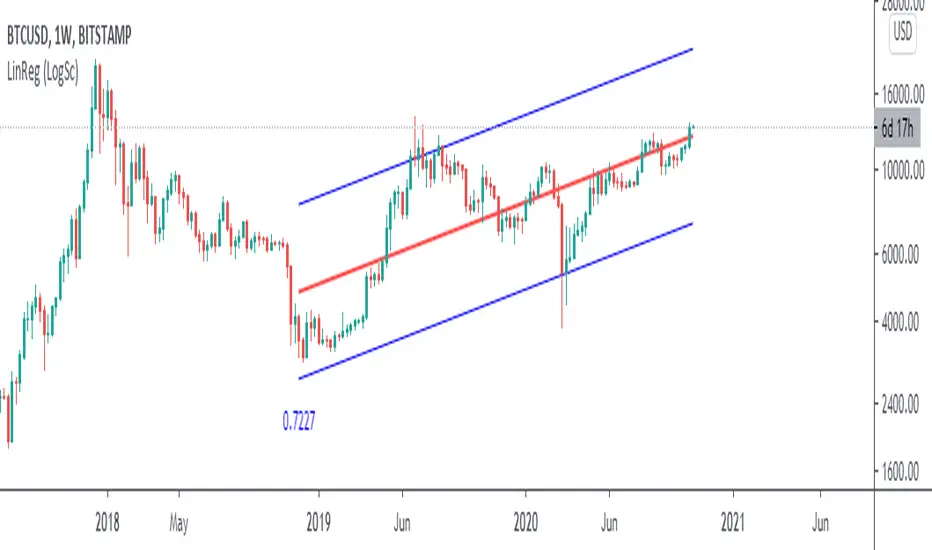
Linear Regression (Log Scale)This code is a slightly modified version of Tradingviews' built-in "linear regression" script which can be correctly plotted on logarithmic charts.
Logarithmic regressionLogarithmic regression (or known as Tseng's tunnels), is used to model data where growth or decay accelerates rapidly at first and then slows over time.
This model is for the long term series data (such as 10 years time span).
The user can consider entering the market when the price below 25% or 5% confidence and consider take profit when the price goes above 75% or 95% confidence line.
Technical issues
*The user have to pan over the chart from the beginning to the end of the study range (such as 10 years of bars) so the pine script could generate those regression lines on the chart.
*If on the chart the number of bar is less than the lookback period, it won't generate any lines as well

My BTC log curveLogarithmic regression of the USD price of Bitcoin , calculated according to the equation:
y=A*exp(beta*x^lambda + c) + m*x + b
where x is the number of days since the genesis block. All parameters are editable in the script options.

Bitcoin Logarithmic Curves OscillatorThis a companion indicator for the Bitcoin Logarithmic Growth Curves indicator.
This is an oscillator version of the above. When the indicator is at / near 1 then Bitcoin price is at / near the upper range of its long-term logarithmic growth trend. When at / near 0 then price is at / near the lower range of that trend.
This indicator only works with the BLX Brave New Coin Index (ticker:BLX) and only on 1 day, 3 day, or 1 week timeframes.

AlAlawi ~ Volume Confidence BreakoutThis is a Volume statistical mean and Lognormal deviation
This indicator shows X amount of Volume bars Lognormal Mean and Standard Deviation, then applies your confidence level.
Just hit like to keep getting free indicators!

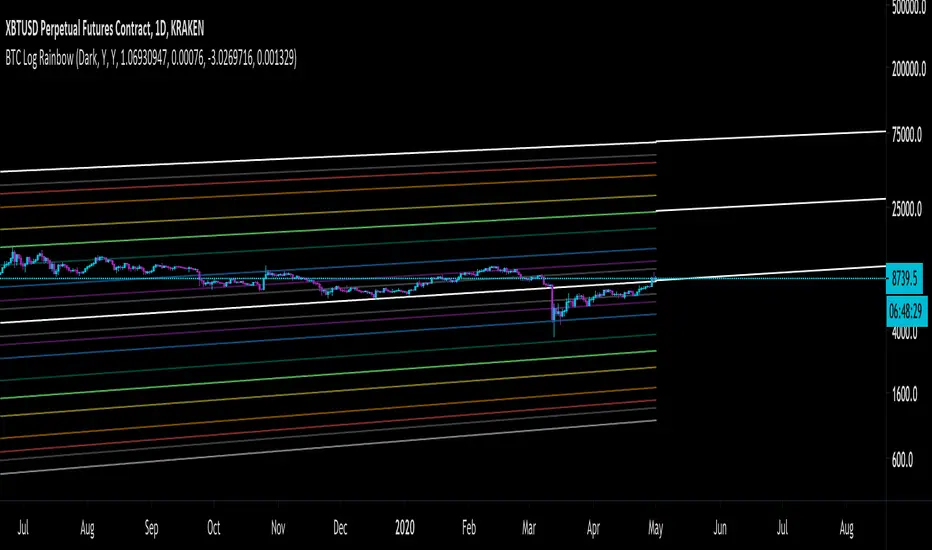
Bitcoin Fibonacci Log RegressionThe "Zero Line" is the calculated logarithmic regression of Bitcoin over the last decade.
The rainbow above the Zero Line are the Fibonacci multiples from 0 --> 1 of the log regression (0.236, 0.382, etc.)
The rainbow below the Zero Line is identical, except that the multiples are negative (-0.236, -0.382, etc.)
For the first time ever, Bitcoin broke through the Zero Line (the natural regression) when it dumped on March 12-13. It looked at though the regression was invalidated when, in fact, it simply made an unprecedented move to a lower Fibonacci multiple.
Enjoy.
Logarithmic Moving AverageLogarithmically weighted moving average.
Here is how weight is distributed in LMA and RMA (exponential moving average)
As you know, logarithm of 1 is 0... This means the last bar in specified period will be ignored, and the log curve above applies to LMA of 9 bars.
So one bar should be added to the length when calculating the weight.
Result is faster than simple moving average, but a bit slower than linearly weighted moving average.

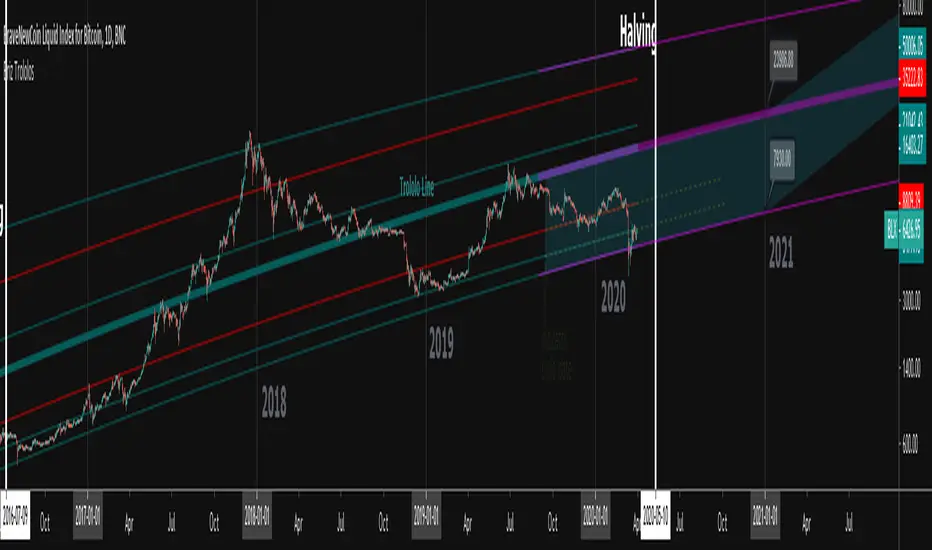
Bitcoin Trololo Lines - Logarithmic Regression for 1D BLXTrololo Lines - Logarithmic Regression lines for Bitcoin with top and bottom ranges. Works only on BLX (BNC) 1 day time frame. Red lines indicate bottom buy range and top sell range. Thickest middle line is the origional "Trololo" or logarithmic regression line.
Bitcoin Logarithmic Growth Curves & ZonesI found this awesome script from @quantadelic and edited it to be a bit more legible for regular use, including coloured zones and removing the intercept / slope values as variables, to leave space for the fib levels in the indicator display. I hope you all like it.

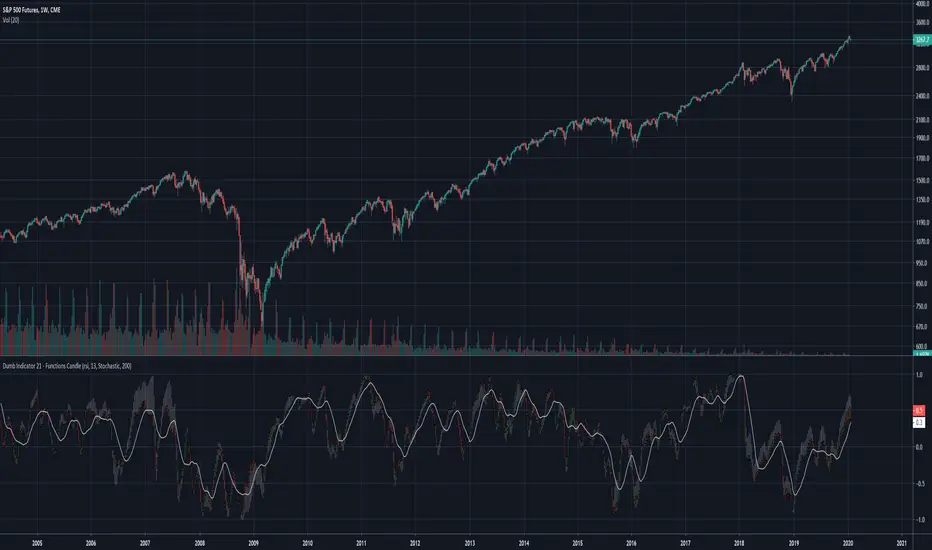
Dumb Indicator 21 - Function's Candlestick Bar's StyleThe idea is help traders to see the patterns and levels from a different point o view.
This script create candlestick using the opening, high, low and close price as source on your favorite function.
It's very simple to use:
Select a function in the drop box list, the number of bars length, check or uncheck the boxes to treat source as logarithm, smooth, and if you want to plot the SMA from the results.
To make a deeper analysis, you can select to plot the candles in Stochastic or in Percent Rank way.
The Stochastic and Percent Rank plot will show how far the price is close to highest or lowest value of the source from the last "Stochastic Length" number of bars.
Some functions with different names can plot the same results.
This indicator works on every kind of market, but you will need to find the best function and length to use.
Please, if you find anything good with this, share to everyone.
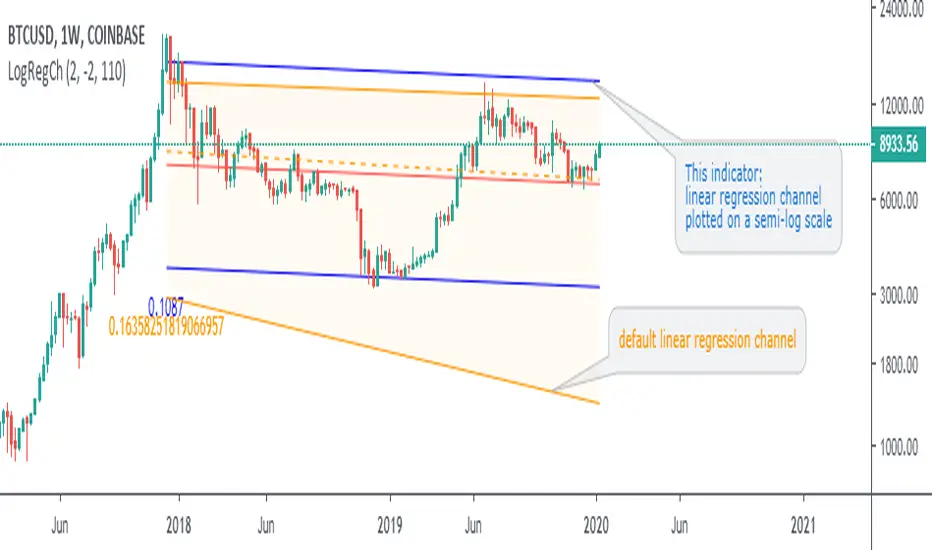
Linear Regression Logarithmiclinear regression channel plotted on log-scale
useful for bitcoin chart and other cryptos