[astropark] Trend Skywalker V2 [alarms]Dear Followers,
today I'm glad to present you Trend Skywalker V2 , the evolution of Trend Skywalker V1 indicator that you can see here below:
This indicator works on every timeframe and market, it's quite responsive to market movements, so it's especially good on volatile markets.
In this new version you have 3 trend clouds available :
a short-term one (yellow)
a mid-term one (green)
a long-term one (blue)
You can also enable an option to show all trend clouds as one, the result will be similar to a special bollinger bands tool.
Of course you can edit trend clouds analysis period and color, also you can turn on or off the cloud that you prefer.
The indicator can run 4 different kinds of strategy : one for each trend cloud individually or a mixed one.
Also the indicator tracks for you a peak profit from entry: this tracker is a suggestion for you to take profits while price goes up!
All red-green circles you see in the chart is a reminder that a peak profit label was there in the past: what does this tell you?
if price starts losing the short-term trend and you had a lot of TP suggestions, maybe trend ended and you should start consider closing your trade before you give back all your profit.
This indicator will let you set alerts on each buy/sell/close/tp label.
For backtesting, you can use the indicator here below:
This is a premium indicator , so send me a private message in order to get access to this script.
Long-short

[astropark] Trend Skywalker V2 [strategy]Dear Followers,
today I'm glad to present you Trend Skywalker V2 , the evolution of Trend Skywalker V1 indicator that you can see here below:
This indicator works on every timeframe and market, it's quite responsive to market movements, so it's especially good on volatile markets.
In this new version you have 3 trend clouds available :
a short-term one (yellow)
a mid-term one (green)
a long-term one (blue)
You can also enable an option to show all trend clouds as one, the result will be similar to a special bollinger bands tool.
Of course you can edit trend clouds analysis period and color, also you can turn on or off the cloud that you prefer.
The indicator can run 4 different kinds of strategy : one for each trend cloud individually or a mixed one.
Also the indicator tracks for you a peak profit from entry: this tracker is a suggestion for you to take profits while price goes up!
All red-green circles you see in the chart is a reminder that a peak profit label was there in the past: what does this tell you?
if price starts losing the short-term trend and you had a lot of TP suggestions, maybe trend ended and you should start consider closing your trade before you give back all your profit.
On backtesting you can you test long and short setups individually or both, as well as performance in a specific time window.
This is a premium indicator , so send me a private message in order to get access to this script.

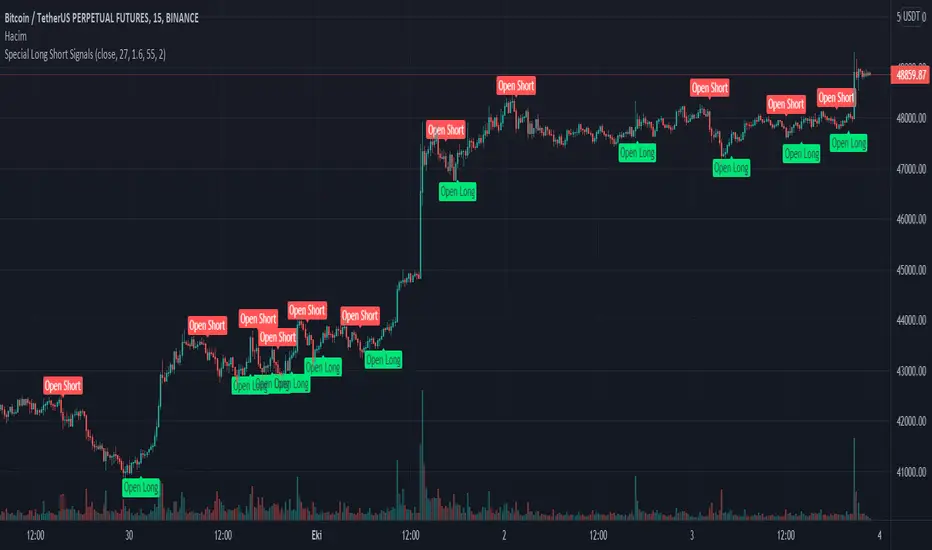
Special Long Short ConditionsIt generates buy and sell signals using a special algorithm when various moving averages approach and diverge from the price. It aims to stay in the trend as long as possible. Please control the risks of your investments well. It is not investment advice.
It calculates using fast, slow period and distance and near distance units. You can adapt it by changing the parameters, but too much optimization is not recommended.
Cesitli hareketli ortalamalarin fiyata yakinlasmasi ve uzaklasmasi durumunda ozel bir algoritma kullanarak al ve sat sinyalleri uretir. Trendde mumkun olabildigince kalabilmeyi amaclar. Lutfen yatirimlarizda risklerini iyi kontrol edin. Yatirim tavsiyesi degildir.
Hizli,yavas periyot ve uzak, yakin uzaklik birimlerini kullanarak hesaplama yapar. Parametreleri degistirerek kendinize uyarlayabilirsiniz fakat cok fazla optimizasyon tavsiye edilemez.
Pivot TrackerThis script finds swing lows and swing highs based on input criteria for lookback and lookforward periods, and plots letters accordingly.
Helps identify trend or lacktherof
HH = higher high
LH = lower high
HL = higher low
LL = lower low

Average Highest High and Lowest Low Swinger StrategyThis is a full price action strategy designed for trending markets such as crypto and stocks.
Its purely made on calculations for the highest high and lowest low using 2 different length , a faster and a slower one.
With those we make multiple averages.
Rules for entry:
For long: our close of the candle is above both the average using fast and slow line
For short: our close of the candle is below both the average using fast and slow line
Rules for exit
We always exit when we have an opposite order
Caution
This strategy use no risk management system, so be careful with it
If you have any questions, let me know

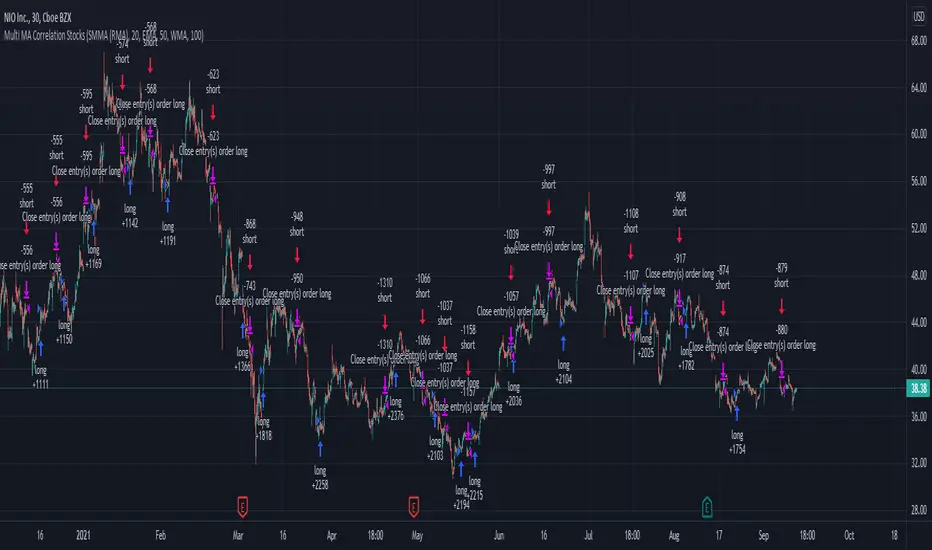
Swing Stock Market Multi MA Correlation This is a swing strategy adapted to stock market using correlation with either SP500 or Nasdaq, so its best to trade stocks from this region.
Its components are
Correlation Candle
Fast moving average to choose from SMA , EMA , SMMA (RMA), WMA and VWMA
Medium moving Average to choose from SMA , EMA , SMMA (RMA), WMA and VWMA
Slow moving average to choose from SMA , EMA , SMMA (RMA), WMA and VWMA
Rules for entry
Long: fast ma > medium ma and medium ma > slow ma
Short: fast ma< medium ma and medium ma < slow ma.
Rules for exit
We exit when we receive an inverse condition.
Caution:
This strategy use no risk management inside, so be careful with it .
If you have any questions, let me know !
Trend System Oscillator Averages RatingThis is a trend system made with multiple oscillator averages designed especially for trending markets such as stocks or crypto.
It can be used with any timeframe.
Its made of multiple moving oscillators such as
RSI
Stochastic
ADX
CCI
AO
MACD
MOM
STOCH RSI
WPR
BP
UO
Avg of all oscillators
It has also a rating, making an avg from all of the oscillators , going from -100 (all ma's are telling to go short ) to 100 ( all ma are telling to go long).
If you have any questions let me know !

Traffic Lights Strategy4HS Crypto Market Strategy
This strategy uses 4 ema to get Long or Short Signals
Length are: 4, 9, 18, 100
We take long positions when the order of the emas is the following:
green > yellow > red (As the color of Traffic Lights) and they are above white ema (Used as a filter for long positions)
We take short positions when the order of the emas is the following:
green < yellow < red (As the color of inverse Traffic Lights) and they are below white ema (Used as a filter for short positions)
Enable Long and/or Short Positions in settings
Enable Profit and Stop in strategy settings with different percentage to backtest the strategy. Also if it is better to use a Traditional Stop Loss or a Trailing Stop Loss based on ATR
Change ema filter resolution in settings for better strategy performance
This Strategy was tested on Crypto Market with good results in assets as BTC, ETH, BNB, ADA, LTC, XLM, BCH, among others
Feel free to optimize this strategy, optimizing its parameters. Each asset has its own "personality".

CRYPTO TRADING BOT - 1min SCALPING LONG/SHORTHOW IT WORKS
The core concept behind the script is the determination of the current market mood in sense of creating a trendline indicator using EMA / SMA .
By using this trend indication alongside RSI / MACD value range, we are able to enter/exit the market in both directions: LONG and SHORT .
In case of confirmed false signals, we try to catch up the next good opportunity to minimise loss and to close the current trade.
If the chance for a good countertrade is given at this point, the market is going to be entered reversely.
Should the market move incredibly fast against our trade direction, we use proven Stop-loss targets, to bring our children into safety.
As many others, we could tell you now, that we used state-of-the-art machine learning algorithms
as well as highly sophisticated methods to gain our results.
As a fact, we started with an idea, using simple and common trading tools/indicators,
as a solid ground. We did not want to reinvent the wheel and it paid off.
GET A WORKING SCRIPT
The algorithm we are using has initially been created with a self-developed backtesting software.
To be able to deliver gas to our engine, we have bought a huge amount of OHLCV data for the 1min chart.
After many exhausting and frustrating weeks of our workflow-rotation (develop, fail, fix, test, repeat)
we finally got confirmation for all of our conditions/expectations, so we translated our algorithm into pine-code.
THE RESULTS
Since we have been using our Pine-Strategy alongside our backtesting software , we checked all the results provided by TradingView
and our tool to be 100% sure every outcome, every entry and every exit is exactly the same.
We did this for several months and since 2021 June we have been using it with real Alerts, coped to our binance account.
Below, you will find how the performance for the previous months looked like (every trade was made with 100% of the capital, of course using proper stop loss and take profit):
September 2020: 15.18%
October 2020: 36.17%
November 2020: 15.12%
December 2020: 48.58%
January 2021: 150.10%
February 2021: 45.96%
March 2021: 46.48%
April 2021: 4.96%
May 2021: 43.48%
June 2021: -28.99%
Juli 2021: 15.63%
August 2021 (so far): 11.57%
Accumulated Profit: 1,979.01%
To prove our results, we will link an excel sheet for every trade that was made within this timerange.
Link: docs.google.com
ABOUT US
We are two good friends, both incredibly interested in mathematics, software engineering, AI and algorithmics. After getting introduced into the crypto space
by a common friend, we started figuring out that there is a pattern behind every big or small move which happens in an asset.
This is where the passion for creating a CRYPTO TRADING BOT began. It was our goal, to create this script for the 1min Timeframe, so the software can react quickly when a
big or small move is happening - this is why it is called a SCALPING SCRIPT .
We are incredibly proud of this script and would like to share it with this amazing community - just hit us up on TradingView!

KV Box v1.0 - Buy / Sell signalKV BOX is a trading indicator. It combines Darvas box theory (developed by Nicolas Darvas), breakout strategy, multi-timeframe trading and ALMA (Arnaud Legoux Moving Averages). This indicator helps identify BUY signals when the price is in the entry zone and SELL when the price breaks out of the uptrend.
---
How to use?
KV BOX can be used in both SPOT and FUTURE (Long/Short) trading
BUY (LONG):
• Entry: When the BUY signal appears.
• Stop loss: LOWER than LOW of first and second candlestick IN THE BOX WHERE BUY SIGNAL APPEARS of 1H, 4H, 1D timeframe.
• Take profit: When the SELL signal appears.
SELL (SHORT):
• Entry: When the SELL signal appears.
• Stop loss: HIGHER than the HIGH of first and second candlestick IN THE BOX WHERE SELL SIGNAL APPEARS of 1H, 4H, 1D timeframe.
• Take profit: When a BUY signal appears.
---
Attention:
KV BOX is only displayed on 1H, 4H and 1D timeframe. 1H for short-term trades (a few days), 4H for mid-term trades (a few weeks), 1D for long-term trades (weeks to months).
---
Options setting:
- Kelvin box on: KV BOX activates
- ALMA mode on: KV BOX activation according to Arnaud Legoux Moving Average (ALMA) method
- Pinbar indicator: activate the indicator when the pinbar candlestick appears
- Supertrend: trend continuation or reversal indicator
============================
KV BOX là 1 chỉ báo mua / bán kết hợp giữa nguyên lý hộp Darvas, phương pháp phá vỡ (break out), giao dịch đa khung thời gian và đường trung bình ALMA (Arnaud Legoux Moving Averages). Chỉ báo này giúp xác định tín hiệu mua khi giá ở vùng entry và bán khi giá phá vỡ khỏi trend tăng (up trend).
---
Cách sử dụng:
KV box có thể dùng trong giao dịch SPOT và FUTURE (Long/Short).
Mua khi có tín hiệu BUY, bán khi có tín hiệu SELL.
MUA:
• Entry: Khi có tín hiệu BUY.
• Cắt lỗ: thấp hơn giá thấp nhất cùa 2 nến đầu tiên trong hộp xuất hiện tín hiệu BUY của khung 1H, 4H, 1D.
• Chốt lời: Khi có tín hiệu SELL xuất hiện.
BÁN:
• Entry: Khi có tín hiệu SELL.
• Cắt lỗ: cao hơn giá cao nhất của 2 nến đầu tiên trong hộp xuất hiện tín hiệu SELL cùa khung 1H, 4H, 1D.
• Chốt lời: Khi có tín hiệu BUY xuất hiện.
---
Chú ý:
KV BOX chỉ hiển thị trên khung 1H, 4H và 1D. 1H cho giao dịch ngắn hạn (vài ngày), 4H cho giao dịch trung hạn (vài tuần), 1D cho giao dịch dài hạn (vài tuần đến vài tháng).
---
Tùy chọn setting:
- Kelvin box on: kích hoạt KV BOX
- ALMA method on: kích hoạt KV box theo phương pháp Arnaud Legoux Moving Averages (ALMA)
- Pinbar indicator: kích hoạt chỉ báo khi xuất hiện nến pinbar đảo chiều
- Supertrend: chỉ báo xu hướng tiếp diễn hoặc đảo chiều

High/Low Channel Multi averages Crypto Swing strategyThis is a swing strategy designed for trending markets such as crypto and stock, with big timeframes , like 8h.
For this strategy we take SMA, EMA, VWMA, ALMA, SMMA, LSMA and VWMA and make an apply them all to both HIGH and LOW separately and make 2 averages, 1 applied to high and the other applied to low.
With them we make a channel.
Rules for entry
For long: close of a candle is above avg applied to high.
For short: close of a candle is below avg applied to low.
Rules for exit
We exit when we either hit TP or SL or when we receive a different condition than the entry one.(long- > short and viceversa)
If you have any questions, let me know !

Percentage Oscillator SwingThe percentage price oscillator (PPO) is a technical momentum indicator.
It shows the relationship between the close of a candle and the highest/lowest point with a specific lenght in percentage terms.
Rules
The higher percentage on the values upwards, compared to those downwards, the higher the power of the bull trend.
The higher percentage on the values downwards, compared to those upwards, the higher the power of the bear trend.

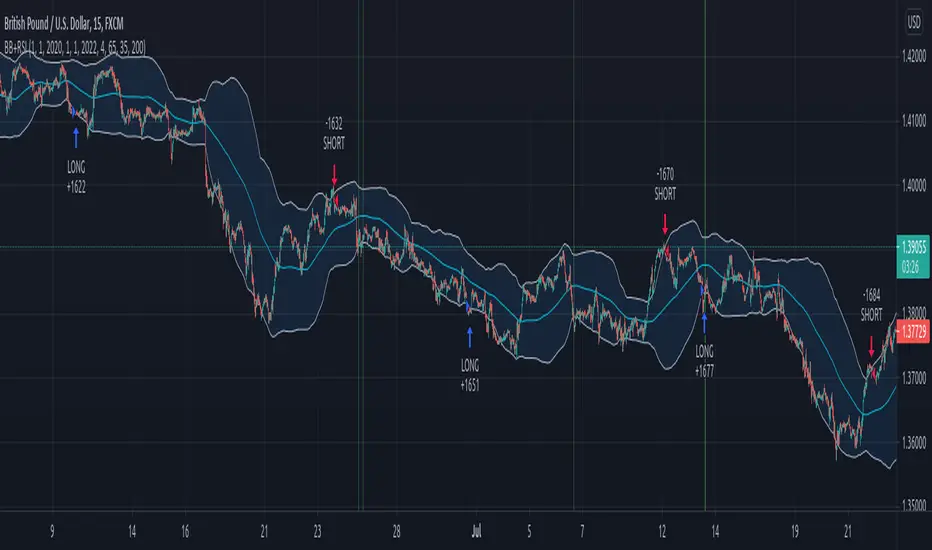
Swing forex strategy 15minThis is a strategy made using BB+ RSI indicators that seems to work great with 15 min major pairs for FOREX.
THe rules for it are simple:
For long we enter when the close of our candle crosses upwards the lower line and rsi crossover the over sold line
We exit long when we have a short entry.
For short we enter when the close of the candle crosses downwards the top line and rsi cross under the over bought line
WE exit short when we have a long entry.
Careful, this strategy has no risk management inside.
If you have any questions let me know !
Boom Hunter ProBoom Hunter Pro is the ultimate indicator for targeting perfect long entries and epic shorts. Boom Hunter comes with a super fast oscillator that uses Ehlers Early Onset Trend (EOT). This is the Center Of Gravity Oscillator (COG) with a super smoothing filter and a roofing filter. This indicator is tuned for 1 hour charts but can be used on any time frame.
Colored bars can be turned on to assist in finding an entry. Purple signifies a drag and potential dump.
Fibonacci lines can be turned on to track price action and find entries/exit.
This indicator follows the same rules as COG. For more information please see my COG HOWTO here:

xGhozt Consecutive Candle CountxGhozt Candle Count simply counts consecutive positive or negative candles, and allows you to get the live statistics of how many times this consecutive candle series occurred in the past, with the probabilities of the next candle to be a reversal, and the average past gains from that reversal. You can select the number of consecutive candles you're tracking, and select a start and end date. When your desired pattern is met by the indicator, it will indicate you on the chart if it's worth shorting or longing the next candle.

[astropark] Moon Phases [alarms]Dear Followers,
today I'm glad to present you an indicator which calculates Moon Phases and let's you set an alert over it.
This is a public free indicator based on the public one by @paaax:
I added my usual alert system logic, plus some more customization inputs for easy coloring.
The lower the timeframe you use it and set your alerts on, the more precise the alert value you get.
Here below the script for backtesting it:
Enjoy!
-- astropark

[astropark] Moon Phases [strategy]Dear Followers,
today I'm glad to present you an indicator which calculates Moon Phases and let's you backtest the simplest strategy over it: buy/sell on full moon and do the opposite on new moon.
This is a public free indicator based on the public one by @paaax:
I added my usual backtesting logic, plus some more customization inputs for easy coloring.
The lower the timeframe you backtest on, the more backtesting data are effective.
Enjoy!
-- astropark

nonoiraq indicator it's very strong i edit this indicator to connect it with my bot to auto trading and he take the info from the volume, so when he is give me a single the bot take just 0.50% to 1% for 3 - 5 trade in day and this perfect, if u use a manual trading this indicator can reach to from 10% to 80% in some point .
the indicator have 3 line
(Red , Purple, Yellow)
1- The yellow line it's high sensitivity this mean it's when rich to the -3 or 3 you can open the order when the bar is close and the signal be sure
and u need to watch the your order because in some case he is reach to 0.30% to 2% and the price reflected to loss and when you wait the price reflected to but my advice you take profit and close the order directly.
2- The purple circles it's medium sensitivity this mean when the purple hit the 2.5 or 3 from down or up in indicator with yellow line you open the order when bar close and the signal is be sure , like example in the photo
3- The red circles it's low sensitivity and this one when reach to 3.0 with any line (yellow or purple) you open directly short or long , like the example in the photo
i am sorry for my english it's not very good
please support me to share other idea or script

Target Price for KuCoin FuturesWhen trading on KuCoin, it can be difficult to determine what you're exit price should be.
This script solves this issue by giving you an exit price based on a given entry price, a base margin, and a target profit %.
USE CASES:
No Entry Price:
If you have no position in KuCoin, then this use case could be more helpful. With no entry price inputted, two lines will be drawn above and below the current closing price.
The blue line represents your exit price for if you were to enter into a long at the current close.
The orange line represents your exit price if you were to enter into a short at the current close.
With Entry Price:
If you're already in a position in KuCoin, then this case might be more helpful.
The green line represents your exit price for a long from your entry price
The red line represents your exit price for a short from your entry price
The yellow line represents your entry price itself.

Tolueno StrategyTolueno Strategy is a help tool for the average trader of tradingview. This tool facilitates the interpretation of entries either long or short.
The use of magic trend has been implemented, in addition to different types of ema and fully configurable signals.
Soon the use of more sophisticated support and resist will be added to be used for inputs and outputs. RR will be improved too.
The tool has alerts
The tool has a dashboard that shows current signal (LONG / SHORT), shows a recommended take profit (not mandatory), recommended stop loss (not mandatory) and the profit that the current operation is achieving, all this to help the trader and his emotions do not harm him.
The tool is constantly updated and will be gradually improved over time with feedback from tradingview users.
Any questions ask in the comment box or by pm.
This indicator is not for sale, it is not a commercial publication.

TEMA Cross +HTF BacktestThis is a follow up to a previous script release called " TEMA Cross Backtest ".
This new strategy uses two TEMA crosses, one for trend direction, one for entry and exit. The entry and exit parameters are the same as the previous script. The trend direction is based on a user configurable higher timeframe TEMA cross which determines when to take longs or shorts. When the indicator is purple, it is looking for shorts, and when it is yellow, it is looking for longs. The background of the chart is colored accordingly to see the trend direction at a glance.
The default settings are the ones I have found produce the highest backtest results. The backtest is set by default to use a $500 account, and use $500 for every entry and exit, no matter the direction or overall profit/loss.
Parts of script borrowed from other public scripts.

Hull MA with BB (With Alerts)This is a combination of the standard Bollinger bands with a VWAP(Pink line), and the 'Hull Trend with Kahlman' script by user capissimo, and the NMA (Moving Average 3.0 (3rd Generation)) script by everget.
You can find the original scripts here:
This indicator gives you several confirmations of a good entry and exit positions for Crypto currency like bitcoin and most alt coins. I use this on a 15min, 30min, 1hour, and 4hour chart for best results.
How to use:
Entry Signals:
-A candle closes above the NMA (Yellow Step Line). AND
-You see a Long (text) flag. AND
-The candles are near the bottom of the Bollinger bands and heading upwards.
Exit Signals:
-Candles have passed below and closed below the NMA (Yellow Step Line). AND
-You see a Short (text) flag.
It's important to use these confirmations with other indicators so you have the best entry/exit positions, and make sure you are on normal candles and not HA or any other types.
There are alerts built in that you can setup for the Short and Long text flags that you see. These are generally good alerts to follow. I use the alerts as a reminder to check the charts and see if my other indicators line up for a good trade.

Angle Attack Follow Line Indicator This indicator works with Follow Line Indicator , evaluates the angle for possible additions or reductions of the position. Many settings to play with:
s3.tradingview.com
- FOLLOW LINE CURRENT CHART RESOLUTION
- FOLLOW LINE HIGHER TIME FRAME
- FILTER HIGHER TIME FRAME
- NO FILTER HIGHER TIME FRAME
- ANGLE CONFIGURATION
- ANGLE LEVELS
- BUY / SELL
- OPTIONS TO ADD
- OPTIONS TO REDUCE
- BAR COLOR
- LABELS
-ALERTS
MANAGE YOUR RISK AND CAPITAL WELL IF YOU DO NOT WANT TO LOSE EVERYTHING¡¡¡
TO PLAY¡¡¡
