Heikin Ashi Candle Startegy for Long PositionThis strategy utilize Heikin-Ashi candlestick chart.
Heikin-Ashi technique is a Japanese candlestick-based technical trading tool that uses candlestick charts to represent and visualize market price data.
Heikin-Ashi candle is essentially taking an average of the movement.
There is a tendency with Heikin-Ashi for the candles to stay red during a downtrend and green during an uptrend.
This strategy only apply for long trading position.
The idea is trader will waiting 3 green candles for validation period (confirmation) before entering long position.
Different timeframe will result different result.
Number of validation period can be changed to see different result
This strategy has parameter for take profit percentage, trailing stop and stop loss.
User can set maximum active position to minimize risk and qty order.
This tool is useful for user who wants to backtest Heikin-Ashi trading strategy.
Script will emit alert when long position is opened and closed.
Warning of Backtesting
Backtesting is backward-looking. As the name implies, you are testing how something would have worked if you traded it perfectly in the past.
Past performance does not indicate future performance and you should not assume it does.
Backtesting assumes you never miss-fire, that you get in and out at the exactly perfect moment each time.
Backtesting assumes you have perfect liquidity, and your limit orders fill at a specific, pre-defined price every time (either the open, close, low, high, or some average of these).
Disclaimer
Do your own research and consider fundamental price of asset.
The indicators provided on this script is for educational purposes only.
Author does not offer advisory or brokerage services, nor does it recommend or advise users to buy or sell particular stocks or securities.
Please examined script and give feedback for further improvement.
Script are open to public, everyone see and clone source code or just apply to chart. Please make comment for improvement.
LONG

RSI StrategySimple way how to use RSI and MA indicators for trading.
What we use:
• RSI
• SMA calculated by RSI (title: SMA_RSI)
• Delta of RSI and SMA_RSI (title: delta)
• SMA calculated by delta of RSI and SMA & RSI (title: SMA_RSI2)
Logic:
Upon the fact that we use the difference between two indicators that have similar values ( RSI and SMA_RSI), we get number around zero. Next, result is smoothed by calculated the SMA . This is the blue/purple line that appears on the chart - SMA_RSI2.
The trade open when SMA_RSI2 cross over the threshold. The trade close when SMA_RSI2 cross under the threshold below.
Also, the usual EMA 200 is used as a filter, which you can switch on or switch off.

Juicy TrendThis script is simple.
It uses EMA and HMA crosses to find entries and exits.
There is an option for sourcing Heikin Ashi based entries/exits.
There is an option for Stop Loss percentage.
It is made for finding Long entries on the 45min chart.
You can optimize the signals by adjusting the moving average lengths.
The default settings are for BTC/USDT 45min.
Suggestion, reduce the Stop Loss percentage for smaller / more volatile assets.

MA&AOThat is quit simple strategy, which combines only two indicators: AO and MA. The logic of trades is also clear, when AO is bullish; slow ma is under the close price; fast ma > slow ma - buy.

MACD + BB + RSI Strategy [Alorse]A very simple and highly effective strategy that combines 3 famous indicators:
MACD
Bollinger Bands
RSI
Entry conditions are:
The MACD line crosses over the signal line.
RSI less than 50
Price below the BB baseline
Exit conditions are:
RSI greater than 70
Closing price higher than the upper BB
Or when the price hits the Stop Loss defined by you (Feature).

Average Highest High and Lowest Low Swinger StrategyThis is a full price action strategy designed for trending markets such as crypto and stocks.
Its purely made on calculations for the highest high and lowest low using 2 different length , a faster and a slower one.
With those we make multiple averages.
Rules for entry:
For long: our close of the candle is above both the average using fast and slow line
For short: our close of the candle is below both the average using fast and slow line
Rules for exit
We always exit when we have an opposite order
Caution
This strategy use no risk management system, so be careful with it
If you have any questions, let me know

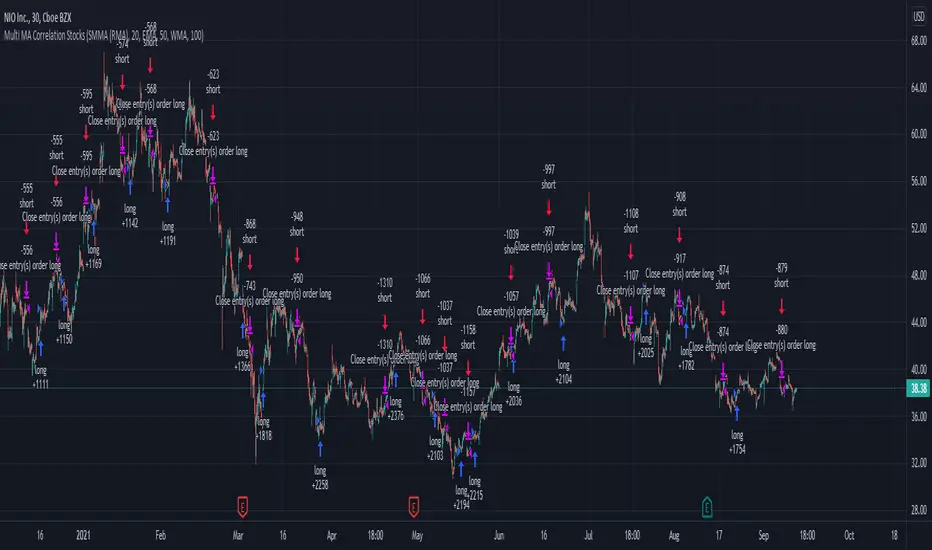
Swing Stock Market Multi MA Correlation This is a swing strategy adapted to stock market using correlation with either SP500 or Nasdaq, so its best to trade stocks from this region.
Its components are
Correlation Candle
Fast moving average to choose from SMA , EMA , SMMA (RMA), WMA and VWMA
Medium moving Average to choose from SMA , EMA , SMMA (RMA), WMA and VWMA
Slow moving average to choose from SMA , EMA , SMMA (RMA), WMA and VWMA
Rules for entry
Long: fast ma > medium ma and medium ma > slow ma
Short: fast ma< medium ma and medium ma < slow ma.
Rules for exit
We exit when we receive an inverse condition.
Caution:
This strategy use no risk management inside, so be careful with it .
If you have any questions, let me know !
Traffic Lights Strategy4HS Crypto Market Strategy
This strategy uses 4 ema to get Long or Short Signals
Length are: 4, 9, 18, 100
We take long positions when the order of the emas is the following:
green > yellow > red (As the color of Traffic Lights) and they are above white ema (Used as a filter for long positions)
We take short positions when the order of the emas is the following:
green < yellow < red (As the color of inverse Traffic Lights) and they are below white ema (Used as a filter for short positions)
Enable Long and/or Short Positions in settings
Enable Profit and Stop in strategy settings with different percentage to backtest the strategy. Also if it is better to use a Traditional Stop Loss or a Trailing Stop Loss based on ATR
Change ema filter resolution in settings for better strategy performance
This Strategy was tested on Crypto Market with good results in assets as BTC, ETH, BNB, ADA, LTC, XLM, BCH, among others
Feel free to optimize this strategy, optimizing its parameters. Each asset has its own "personality".

High/Low Channel Multi averages Crypto Swing strategyThis is a swing strategy designed for trending markets such as crypto and stock, with big timeframes , like 8h.
For this strategy we take SMA, EMA, VWMA, ALMA, SMMA, LSMA and VWMA and make an apply them all to both HIGH and LOW separately and make 2 averages, 1 applied to high and the other applied to low.
With them we make a channel.
Rules for entry
For long: close of a candle is above avg applied to high.
For short: close of a candle is below avg applied to low.
Rules for exit
We exit when we either hit TP or SL or when we receive a different condition than the entry one.(long- > short and viceversa)
If you have any questions, let me know !

Stock trending strategy This is a long only strategy designed maily for stock markets and futures. In general it works best with 1h, however it can be optimized with other timeframes as well.
Components:
VWAP
MACD histogram
EMA 9
Rules for entry
Long :
For VWAP: close is above the vwap daily
EMA: close is above the moving average
MACD histogram is above 0
Short:
For VWAP: close is belowthe vwap daily
EMA: close is below the moving average
MACD histogram is below 0
Rules for exit
This strategy does not have any risk management inside. Instead it exits whenver it receives an opposite signal form the original one used for entry.
If you have any questions let me know !

Supertrend LSMA long StrategyThis is a long strategy which combines Super trend indicator with LSMA moving average.
In general it tends to works better with long trending markets such as stocks and cryptos using a big timeframe.
The rules are simple
Long entry:
Supertrend is telling us to go long and close of a candle is above moving average
Long exit:
Supertrend is telling us to go short
IF you have any questions, let me know !

Pivot Reversal strategy long onlyPivot Point Reversal Strategy
Pivot point reversal strategy is based on the first support level’s price action during the bullish trend and the first resistance level during the bearish trend . Traders follow the main trend and enter into the trade after reversal analyzing pivot point levels.
This version is an upgraded version, combining the initial pivot point reversal strategy together with one of the most accuracy moving average in my opinion for day trade, the Least square moving average.
At the same time I applied an option to backtest using a date range and a leverage calculator.
The default options are optimized for BTC /USDT 2H charts, using 0.1% comission fee.
If you have any questions, let me know

Vwap mtf Swing Stock StrategyThis is a trending strategy designed for stock market, especially long trending assets such as TSLA, NIO, AMAZON and so on.
Its made of volatility bands and weekly VWAP, in this case daily and weekly.
This strategy has been adapted to go long only.
Rules for entry
For long , we want to enter close of a candle is above vwap weekly, and at the same time the close of a candle cross-under the lower volatility band.
For exit , we want to enter close of a candle is below vwap weekly, and at the same time the close of a candle cross-over the upper volatility band.
This strategy does not have a risk management inside, so use it with caution.
If you have any questions, let me know !

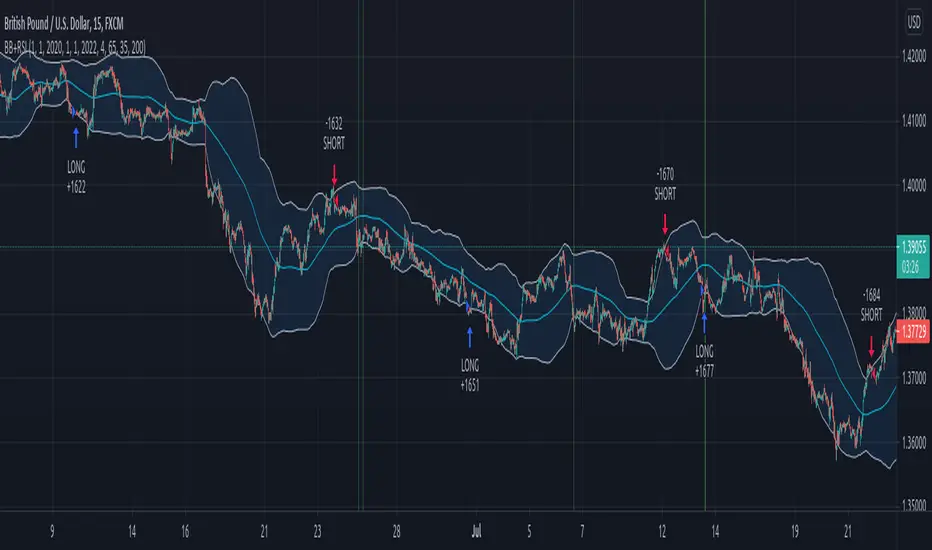
Swing forex strategy 15minThis is a strategy made using BB+ RSI indicators that seems to work great with 15 min major pairs for FOREX.
THe rules for it are simple:
For long we enter when the close of our candle crosses upwards the lower line and rsi crossover the over sold line
We exit long when we have a short entry.
For short we enter when the close of the candle crosses downwards the top line and rsi cross under the over bought line
WE exit short when we have a long entry.
Careful, this strategy has no risk management inside.
If you have any questions let me know !
[astropark] Moon Phases [strategy]Dear Followers,
today I'm glad to present you an indicator which calculates Moon Phases and let's you backtest the simplest strategy over it: buy/sell on full moon and do the opposite on new moon.
This is a public free indicator based on the public one by @paaax:
I added my usual backtesting logic, plus some more customization inputs for easy coloring.
The lower the timeframe you backtest on, the more backtesting data are effective.
Enjoy!
-- astropark

TEMA Cross +HTF BacktestThis is a follow up to a previous script release called " TEMA Cross Backtest ".
This new strategy uses two TEMA crosses, one for trend direction, one for entry and exit. The entry and exit parameters are the same as the previous script. The trend direction is based on a user configurable higher timeframe TEMA cross which determines when to take longs or shorts. When the indicator is purple, it is looking for shorts, and when it is yellow, it is looking for longs. The background of the chart is colored accordingly to see the trend direction at a glance.
The default settings are the ones I have found produce the highest backtest results. The backtest is set by default to use a $500 account, and use $500 for every entry and exit, no matter the direction or overall profit/loss.
Parts of script borrowed from other public scripts.

Ichimoku EMA RSI - Crypto only long StrategyHey there!
Here I show you an Ichimoku Cloud Strategy.
I discovered the strategy on a YouTube channel and tried to transfer it as a strategy into a script.
He said in his video that you would make more profit with this strategy than holding the coin.
Tested with the crypto pair ETH/USDT in the four hour chart.
Period: beginning of 2017 until today.
The strategy should also work with foreign exchange. But then the settings have to be adjusted.
There is the possibility to activate two EMA's and a Stochastic RSI .
-----------------------------------------------------------------------------------
How does the strategy work?
ENTRY
The green Ichimoku lead line must above the red Ichimoku lead line - only the two lead lines are activated.
A green candle must closed above the green lead line.
EXIT
A red candle must close below the green Ichimoku lead line.
OPTIONAL ENTRY
EMA
Once you activate the EMA , long positions will only be taken once the EMA1 is above the EMA2.
Thereby I could observe a significant increase of the profit as well as a decrease of the maximum drawdown.
RSI
As soon as you activate the Stochastic RSI , long positions are only taken when the K line is above the D line.
In the future, I may add an oversold - undersold parameter.
The results of the strategy are without commissions and levers.
If you have any questions or feedback, please let me know in the comments.
If you need more information about the strategy and want to know exactly how to apply it, check out my profile.
I wish you good luck with the strategy!

Jaws Mean Reversion [Strategy]This very simple strategy is an implementation of PJ Sutherlands' Jaws Mean reversion algorithm. It simply buys when a small moving average period (e.g. 2) is below
a longer moving average period (e.g. 5) by a certain percentage and closes when the small period average crosses over the longer moving average.
If you are going to use this, you may wish to apply this to a range of investment assets using a screener for setups, as the amount signals are low. Alternatively, you may wish to tweak the settings to provide more signals.
Context can be found here:
LINK

Simple way to BEAT the market [STRATEGY]This script has been created to demonstrate the effectiveness of using market regime filters in your trading strategy, and how they can improve your returns and lower your drawdowns
This strategy adds a simple filter (A historical volatility percentile filter, an implementation of which can be found on my trading profile) to a traditional buy and hold strategy of the index SPY.
Note, There are other filters that could also be added including a long-term moving average/percentile rank filter/ADX filter etc, to improve the returns further.
The filter closes our long position during periods of volatility that exceed the 95th percentile (or in the top 5% of volatile days) and buys back when the volatility is below 95% rank of the past 100 days
Have included the backtest results since 1993 which is 28 years of data at the time of writing. Comparison of traditional buy and hold with this modified strategy can be found below:
Traditional buy and hold:
Return per year: 7.95 % (ex Dividends)
Total return: 851.1 %
Max drawdown: 50.79 %
'Modified' buy and hold (this script):
Return per year: 9.92 % (ex Dividends)
Total return: 1412.2 %
Max drawdown: 31.57 %
Feel free to use some of the market filters in my trading profile to improve and refine your strategies further, or make a copy and play around with the code yourself. This is just a simple example for demo purposes.

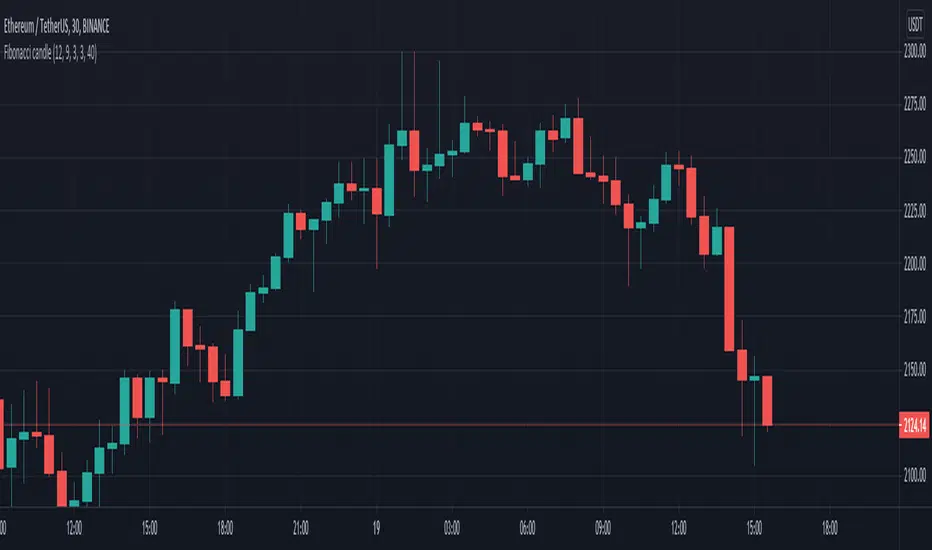
Fibonacci candle with Fibonacci ema strategyFor this strategy I am making use of the fibonacci numbers until 10 sequences and I am using them to make an avg candle and an average ema.
With it, I combine multiple price action rules and I set it up to only go long. When we have a short , we exit from the trade.
From the initial tests, it looks like it performs better on big timeframes.
If you have any questions, let me know !
Full strategy Psar+ adx + cmf + rsi This ia full strategy made with a combination of a trender, volume, volatility and oscillator.
In this case we only go long.
Indicators used:
Default PSAR
Default CMF
Modified RSI logic, not using OB/OS
ADX with EMA applied
The rules are : we check if we are in a uptrend on psar, together with a positive value in volume, rsi is above the middle line(50), using a big length, and lastly the ADx is superior to the ema ADx
For exit, we check the opposite, like downtrend psar, negative value volume, rsi < 50, and adx < ema adx
If you have any questions let me know.

4X EMA and volume strategyThis is a strategy made from multiple types of EMA and volume(EOM).
This is a long only strategy.
EMA 1 = 13
EMA 2 = 21
EMA 3 = 50
EMA 4 = 180
In this case we have 2 options for entry:
1.We check that are candles are in ascending order and EOM is above 0 - > long, descending and eom<0 -> exit long
2.We check if we have a crossover between the first ema with the second and the third. Cross up -> long, crossdown -> exit long
If you have any questions let me know!

ATR with EOM and VORTEXThis is a strategy, designed for long trends for stock and crypto market.
Its made of ATR for volatility, EOM for volume and VORTEX for the trend direction.
In this case on the ATR, I applied an EMA to check if current position is above the EMA -> bull trend, below ema -> bear trend
For EOM I am using the positive and negative value scale, if its positive we are in a bull movement, otherwise a bear movement.
Lastly for VORTEX, I took the min and max, and made an average, after that I am using the average and compare it with 1 value. Above 1 -> bull, belowe 1-> bear.
This strategy only goes long.
If you have any questions, let me know.
