MINIMO


Japanese Correlation CoefficientIntroduction
This indicator was asked and named by a trading meetup participant in Sevilla. The original question was "How to estimate the correlation between the price and a line as easy as possible", a question who got little attention. I previously proposed a correlation estimate using a modification of the standard score (see at the end of the post) for the estimation of a Savitzky-Golay moving average (LSMA) of order 1, however something faster could maybe be done and this is why i accepted the challenge.
Japanese Correlation
Correlation is defined as the linear relationship between two variables x and y , if x and y follow the same direction then the correlation increase else decrease. The correlation coefficient is always equal or below 1 and equal or above -1, it also have to be taken into account that this coefficient is quite smooth. Smoothing is not a problem, scaling however require more attention, high price > closing price > low price, therefore scaling can be done. First we smooth the closing/high/low price with a simple moving average of period p/2 , then we take the difference of the smoothed close with the smoothed close p/2 bars back, this result is then divided by the difference between the highest smoothed high's with the lowest smoothed low's over period p/2 .
Since we use information provided by candlesticks (close/high/low) i have been asked to publish this estimator with the name Japanese correlation coefficient , this name don't imply the use of data from Japanese markets, "Japanese" is used because of the candlestick method coming from Japan.
Comparison
I compare this estimation with the correlation coefficient provided in pinescript by the correlation function.
The estimation in orange with the original correlation coefficient using n as independent variable in blue with both length = 50.
comparison with length = 200.
Conclusion
I have shown that it is possible to roughly estimate the correlation coefficient between price and a linear function by using different price information. Correlation can be further estimated by using homogeneous bridge OHLC volatility estimators thus making able the use of different independent variables. I really hope you like this indicator and thanks to the meetup participant asking the question, i had a lot of fun making the indicator.
An alternative method

Previous hourly low-highA simple indication of the previous hourly low and high _ (Complete version) _

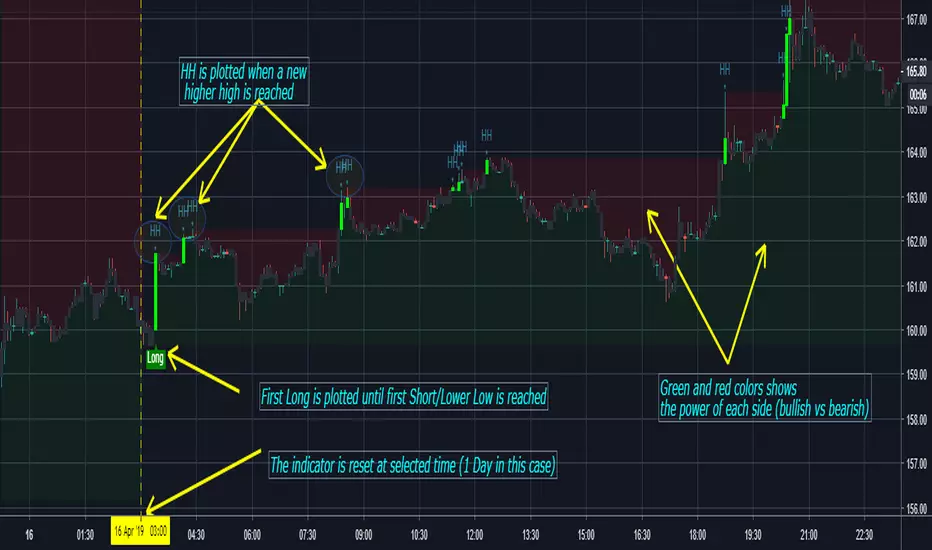
Higher Highs / Lower Lows - m,H,D,W,M w/ Alerts by ZekisA simple but very useful indicator that plots higher highs and lowers lows and that can be reset each hour, day, week or month, so it can plot new HH and new LL only in that range.
It can be used as it it, combined with other indicators or for TA (it's an entire story about highs and lows, google and youtube are your friends).
Alerts for HH/LL and for the first in the series plotted with Long and Short labels.
Use with caution!
Enjoy!
@Zekis
AG Ultimate Bollinger BandsWe believe we have really built the ultimate Bollinger Bands! There are so many options with these Bands:
- use an SMA or EMA for the Basis Moving Average
- displaying the Average Highs/Lows (blue lines) to create a Moving Band
- show breakouts of the Upper/Lower Bollinger Bands with arrows for simplicity (no more wondering whether it closed out or not!)
- show a standard deviation of Highs/Lows alongside the traditional Upper/Lower Bollinger Bands.
All options are togglable, for full flexibility and customisation.

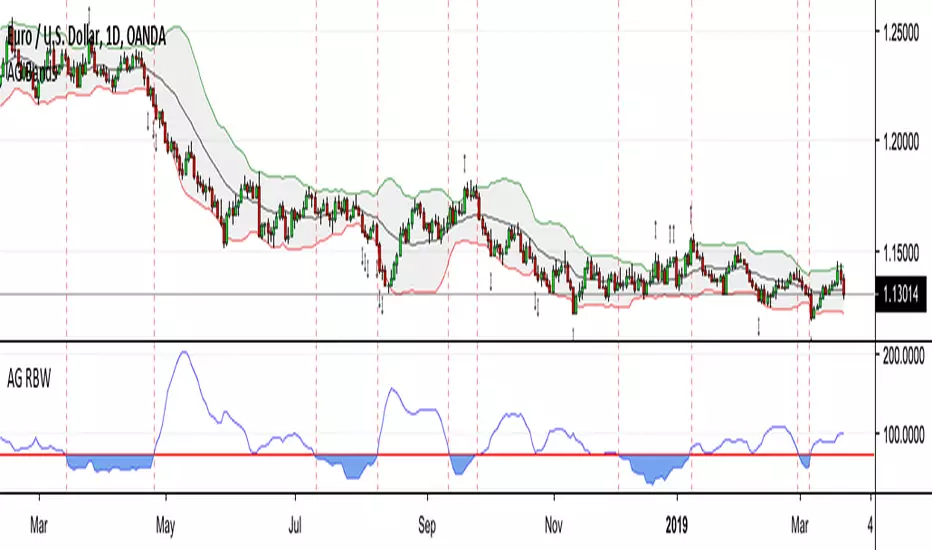
AG Relative BandWidthThis is an indicator that we've been using for a while, very useful for identifying when the market is in a low volatility state. We use the bandwidth of the Bollinger Bands as a proxy for this, but we do something different - we ask the question of "relative to what?".
Whereas typical Bollinger BandWidth indicators give values only applicable for that particular asset, the normalised nature of our Relative BandWidth indicator means that it works and be inferred the same across all assets and timeframes. A really handy tool!
"After periods of low volatility come periods of high volatility" is a well-known theory, and this indicator helps to quickly and easily identify when markets are in low volatility states. Another name for the information our indicator shows is known as the "Bollinger squeeze". Trading breakouts of this squeeze in Bands can be a profitable strategy, given one can filter the false breakouts adequately.
I have shown examples of when the indicator was showing low volatility, take note of what the price action and the width of the Bollinger Bands are doing.
Every parameter is editable, so feel free to play around with the settings. The default settings are what we have used for a long time and have worked well.
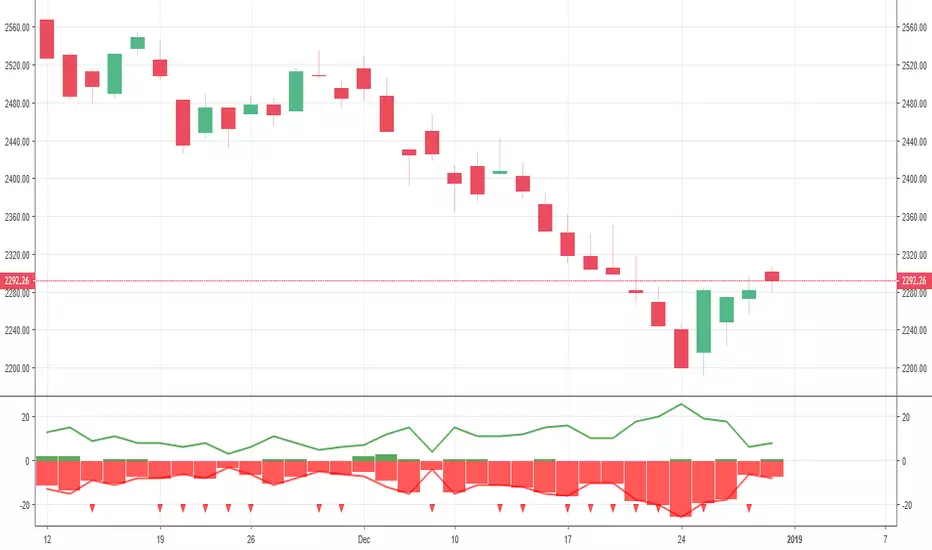
Range: OHLC vs Previous OHLCThis will plot your choice of OHLC (or any of the averaging choices) of the current candle compared to the previous candle.
For example if you choose "high" for the input and set the chart to daily, you'll see the currently daily high vs the previous daily high.
Green candle represent a higher high and the length of the candle represents how much higher.
Red candles represent a lower high than the previous day and the length is by how much lower.
This indicator is pretty straight forward, look for me to build on this with something a little more elaborate in the near future.

High and Lows Multi-timeframeThis script displays highs and lows from higher timeframes into the chart. Recommended to use Weekly or more lines on smaller timeframe charts like the 5M charts.

HTF High/LowThis simple script draws the previous higher timeframe candle high/low to your chart.
You can also make the script paint the zone between the low/open and the high/close.

High Low LinesThis script allows you to see a line graph of the highs and lows. Useful for drawing trend lines.


Poseidon - [Swing High Low][Support and Resistance][Reversal]...A great indicator with tons of usages for technical analysis
Act as:
* Support and Resistance (It can be used as breakouts only if you drag the line manualy, it will never break it by itself)
* Swing points
* Reversal point (The candle will reverse in 90% in cases)
* Tops and Bottoms (It finds highest and lowest points)
... and many more TA for strategies
Combined with RSI will give even better overview of the chart
Play with values till you find what your needs are
The bigger value is, the more accurate points will be
(There is no such as magic indicators, you need to do your job, you need to know what are you doing before enter in real life!)
Cheers!
@Zekis

High-Low RangeThis script just shows a histogram of the daily range. You can change the interval to view the high/low range of any period, but I use it just to see what the day's range is and how it compares to prior days. Simple and straightforward.
New Highs-Lows AMEX-Buschi
English:
This indicator shows the AMEX's up volume (green) and down volume (red).
Extreme trading days with more than 90 % up or down volume are marked via lines (theoretically values) and triangles (breaches).
Deutsch:
Dieser Indikator zeigt das Aufwärts- (grün) und Abwärts-Volumen (rot) der AMEX.
Extreme Handelstage mit mehr als 90 % Aufwärts- oder Abwärts-Volumen ist gekennzeichnet über Linien (theoretische Werte) und Dreiecke (Überschreitungen).
New Highs-Lows NASDAQ-Buschi
English:
This indicator shows the NASDAQ's new highs (green) and new lows (red).
Extreme trading days with more than 99 % new highs relative to new lows vice versa are marked via lines (theoretically values) and triangles (breaches).
Deutsch:
Dieser Indikator zeigt die neuen Hochs (grün) und neuen Tiefs (rot) der NASDAQ.
Extreme Handelstage mit mehr als 99 % neuen Hochs relativ zu den neuen Tiefs und andersherum sind gekennzeichnet über Linien (theoretische Werte) und Dreiecke (Überschreitungen).
New Highs-Lows NYSE-Buschi
English:
This indicator shows the NYSE's new highs (green) and new lows (red).
Extreme trading days with more than 99 % new highs relative to new lows vice versa are marked via lines (theoretically values) and triangles (breaches).
Deutsch:
Dieser Indikator zeigt die neuen Hochs (grün) und neuen Tiefs (rot) der NYSE.
Extreme Handelstage mit mehr als 99 % neuen Hochs relativ zu den neuen Tiefs und andersherum sind gekennzeichnet über Linien (theoretische Werte) und Dreiecke (Überschreitungen).

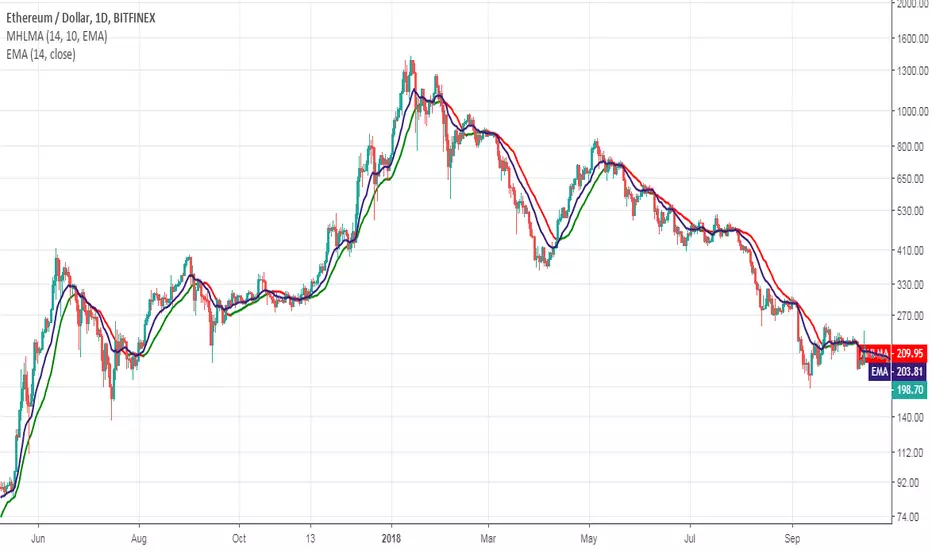
Middle-High-Low Moving AverageThis indicator was originally developed by Vitali Apirine (Stocks & Commodities , V.34:9 (August, 2016): "The Middle-High-Low Moving Average").
You can use it to create a crossover trading system in conjuction with EMA/SMA.
Good luck!
Price Open/High/Low/CloseAnother indicator that shows Open, High, Low, Close on multiple timeframes.
It can be used to discover possible support/resistance areas on lower timeframes.
Other indicators may do the same thing but just added some custom timeframes
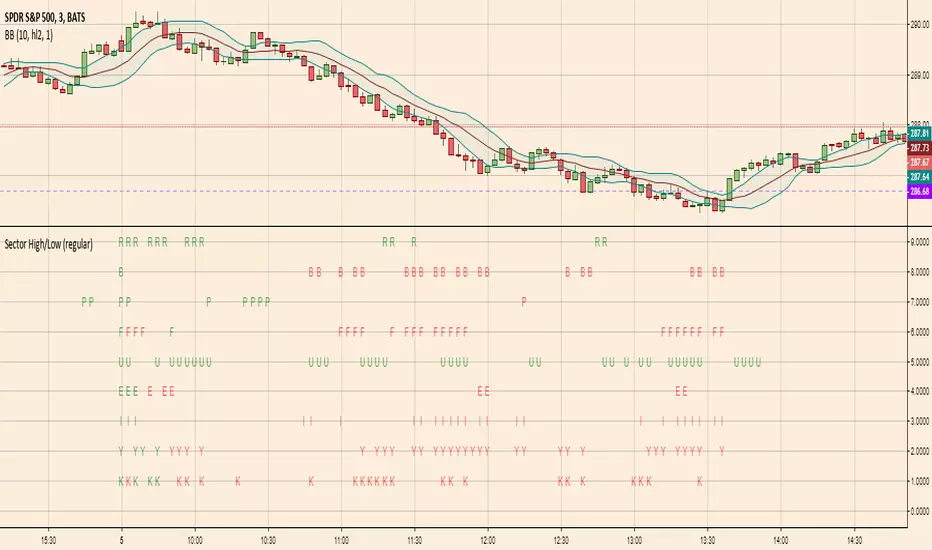
Sector High/LowHighlights which S&P SPDR Sector ETFs are at highs of day (green letter) or lows of day (red letter)
The first candle of the day is always all-green because by default the first candle of the day has the high of the day. So this indicator is more meaningful later in the day when sectors are making repeated highs/lows