Renko Bollinger StrategyIf you build Bollinger Bands from the values of Renko or Haken Ashi, then you can get an interesting strategy.
M-oscillator

Combo Backtest 123 Reversal & CMOabsThis is combo strategies for get a cumulative signal.
First strategy
This System was created from the Book "How I Tripled My Money In The
Futures Market" by Ulf Jensen, Page 183. This is reverse type of strategies.
The strategy buys at market, if close price is higher than the previous close
during 2 days and the meaning of 9-days Stochastic Slow Oscillator is lower than 50.
The strategy sells at market, if close price is lower than the previous close price
during 2 days and the meaning of 9-days Stochastic Fast Oscillator is higher than 50.
Second strategy
This indicator plots the absolute value of CMO. CMO was developed by Tushar
Chande. A scientist, an inventor, and a respected trading system developer,
Mr. Chande developed the CMO to capture what he calls "pure momentum". For
more definitive information on the CMO and other indicators we recommend the
book The New Technical Trader by Tushar Chande and Stanley Kroll.
The CMO is closely related to, yet unique from, other momentum oriented indicators
such as Relative Strength Index, Stochastic, Rate-of-Change, etc. It is most closely
related to Welles Wilder`s RSI, yet it differs in several ways:
- It uses data for both up days and down days in the numerator, thereby directly
measuring momentum;
- The calculations are applied on unsmoothed data. Therefore, short-term extreme
movements in price are not hidden. Once calculated, smoothing can be applied to
the CMO, if desired;
- The scale is bounded between +100 and -100, thereby allowing you to clearly see
changes in net momentum using the 0 level. The bounded scale also allows you to
conveniently compare values across different securities.
WARNING:
- For purpose educate only
- This script to change bars colors.

SELO Triangular WaveBased on master indicator creator @AlexGrovers scripts i just combined some of his work.
Result depends on settings and pairs and is not forward tested yet although the backtest can give some good results.

BreakingDawn [JackTz]Designed for 4 hour charts - No repaint.
BreakingDawn tries to anticipate the trend change before the actual break from one trend to another. This is an extenstion to WaveTrend from LazyBear.
Cudos to LazyBear for his awesome WaveTrend script!
//Jack

QuantCat Chande Swinger StrategyQuantCat Chande Swinger
This strategy is designed to be used on the 1 minute with mainly bitcoin, and cryptocurrencies. But parameters can be adjusted to ANY pair.
After some long research about chande momentum oscillator, I decided to create a strategy using normal distribution percentage levels to snipe entries. This in turn on the 1 minute can create a nice profit over a consecutive amount of days, the end goal is to get a stronger version of this strategy running on a bot and print some money. This strategy is tightly defined, and can be loosened up to make more trades too- giving a higher sample size and better sharpe ratio.
The strategy checks to see if the Chande value is in an extreme percentile based on the last few hundred chande values- if it is it will open a position.
No stoploss or take profit implemented into the swinger yet, but this will be the next addition to really minimise loss and amplify potential profits.
Any liquid crypto pair on the low timesframes will net a good result with this strategy.
We also have a free 15M and 1H strategy available too.
You can join our discord server to get live alerts for the strategies as well as speak to our devs! Link in signature below!!!


RSI Fibonacci Levels StrategyRSI with Fibonacci Levels
Visually can be used as:
- Countertrend indicator at extreme green/red lines
- Follow trend indicator
- Fibonacci supports and resistantes zones
The strategy works as a follow trend
How to trade:
The indicator is more reliable in longer time frames, at least 4H
Choose a fibonacci level as reference
Buy when the RSI line turns green
Sell when the RSI line turns red

QuantCat Mom Finder Strategy (1H)QuantCat Momentum Finder Strategy
This strategy is designed to be used on the 1 hour time frame, on all x/btc pairs.
The beautiful thing is it plots the take profit, and stoploss for you for each entry- where I would say use the stoploss for sure and feel with water with how the price action is looking when in profit.
In this strategy, I actually implemented my own trading style into building the strategy. Having to replicate my own trading strategy into an algorithm, I can't make it exactly perfect to how I would trade, but what I can do is try and program the parameters that give it the absolute best chance of making a big move with a small drawdown- which replicates part of my momentum trading style. Here I am using RSI, MACD, EMA and trend filtering values to find moments where there has been a momentum change to play the rest of the move. It only picks the best entries.
There is always a 3-4 R/R move on average with with these trades, meaning 1 in 4 only need to hit to be a break even trader- where most of these strategies have about 35% hit rate.
The stoploss is so crucial to minimise any damage from huge unexpected candles, the strategies can just be used for entries as well, you don't have to stick to the exact formula- of the long and short system, but this by itself is profitable.
The system nets positive results on
-ETH/BTC
-LTC/BTC
-XRP/BTC
-ADA/BTC
-NEO/BTC etc.
We also have a free 15M strategy available too.
You can join our discord server to get live alerts for the strategy as well as speak to our devs! Link in signature below!!!


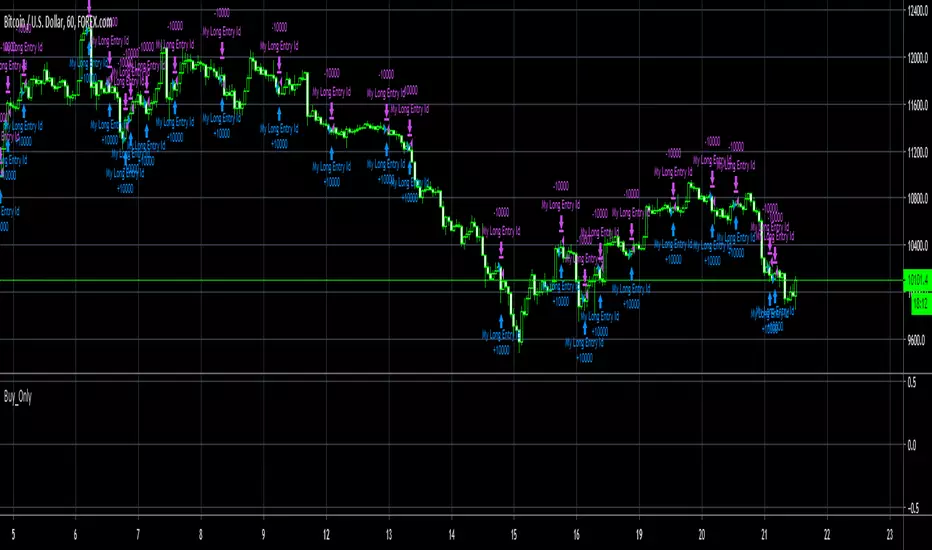
Strategy for The Bitcoin Buy/Sell IndicatorThis is the strategy for
Starting with a capital of $3,000 XBT , one might have $15,975 dollar worth of XBT plus whatever the bitcoin has appreciated over the years.
The Sharpe Ratio: 0.586, Net Profit is 532%, 57 closed trades from 2017 till today, Profit factor of 3.745 (aka for every dollar loss, there is 3.745 dollar profit) with 14% drawdown .
Let that sink in.

BTC strategy for margin tradingAlmost identical to the one I published before, but this one includes short orders as well.
I didn't spend much time backtesting, so there may be a different set of parameters that gives better results. Please let me know if you find something!


Combo Backtest 123 Reversal & CMO & WMA This is combo strategies for get a cumulative signal.
First strategy
This System was created from the Book "How I Tripled My Money In The
Futures Market" by Ulf Jensen, Page 183. This is reverse type of strategies.
The strategy buys at market, if close price is higher than the previous close
during 2 days and the meaning of 9-days Stochastic Slow Oscillator is lower than 50.
The strategy sells at market, if close price is lower than the previous close price
during 2 days and the meaning of 9-days Stochastic Fast Oscillator is higher than 50.
Second strategy
This indicator plots Chande Momentum Oscillator and its WMA on the
same chart. This indicator plots the absolute value of CMO.
The CMO is closely related to, yet unique from, other momentum oriented
indicators such as Relative Strength Index, Stochastic, Rate-of-Change,
etc. It is most closely related to Welles Wilder?s RSI, yet it differs
in several ways:
- It uses data for both up days and down days in the numerator, thereby
directly measuring momentum;
- The calculations are applied on unsmoothed data. Therefore, short-term
extreme movements in price are not hidden. Once calculated, smoothing
can be applied to the CMO, if desired;
- The scale is bounded between +100 and -100, thereby allowing you to clearly
see changes in net momentum using the 0 level. The bounded scale also allows
you to conveniently compare values across different securities.
WARNING:
- For purpose educate only
- This script to change bars colors.

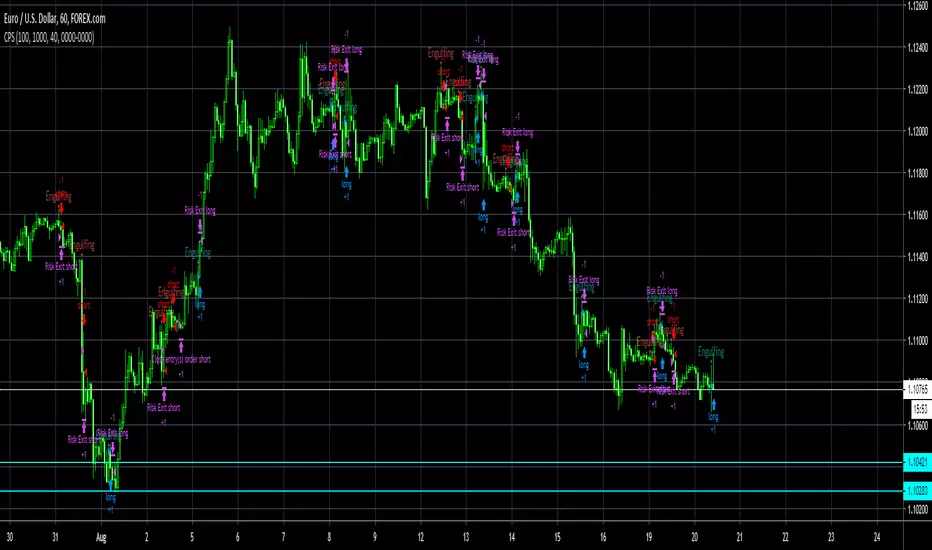
Candle Patterns Strategy V1//Modify DanyChe script to work in latest version of pinescript
//The script allows you to test popular candlestick patterns on various instruments and timeframes. In addition, you can configure risk management (if the value is zero, it means the function is disabled), and you can also specify the time of the trading session (for example, so that the positions are not transferred to the next day).
//The author is grateful to JayRogers and Phi35, their code examples helped a lot in writing the strategy.

Candle Patterns Strategy//I saw this code from DanyChe, i modify it to work on the latest version of pinescript
//The script allows you to test popular candlestick patterns on various instruments and timeframes. In addition, you can configure risk management (if the value is zero, it means the function is disabled), and you can also specify the time of the trading session (for example, so that the positions are not transferred to the next day).
//The author is grateful to JayRogers and Phi35, their code examples helped a lot in writing the strategy.
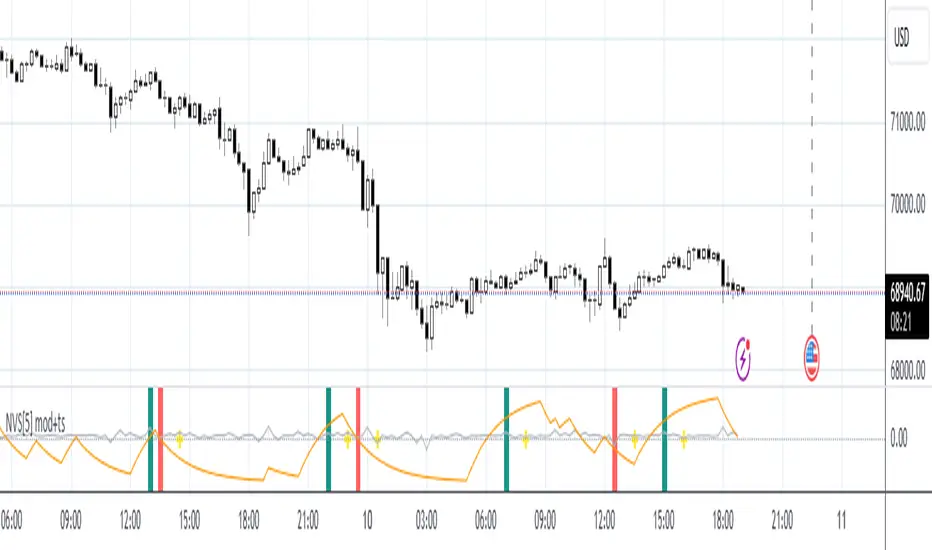
Scaled Normalized Vector Strategy, ver.4.1This modification of the Scaled Normalized Vector Strategy uses trailing stops and is optimized for lower TFs.
Combo Backtest 123 Reversal & Chande Momentum Oscillator This is combo strategies for get a cumulative signal.
First strategy
This System was created from the Book "How I Tripled My Money In The
Futures Market" by Ulf Jensen, Page 183. This is reverse type of strategies.
The strategy buys at market, if close price is higher than the previous close
during 2 days and the meaning of 9-days Stochastic Slow Oscillator is lower than 50.
The strategy sells at market, if close price is lower than the previous close price
during 2 days and the meaning of 9-days Stochastic Fast Oscillator is higher than 50.
Second strategy
This indicator plots Chande Momentum Oscillator. This indicator was
developed by Tushar Chande. A scientist, an inventor, and a respected
trading system developer, Mr. Chande developed the CMO to capture what
he calls "pure momentum". For more definitive information on the CMO and
other indicators we recommend the book The New Technical Trader by Tushar
Chande and Stanley Kroll.
The CMO is closely related to, yet unique from, other momentum oriented
indicators such as Relative Strength Index, Stochastic, Rate-of-Change,
etc. It is most closely related to Welles Wilder`s RSI, yet it differs
in several ways:
- It uses data for both up days and down days in the numerator, thereby
directly measuring momentum;
- The calculations are applied on unsmoothed data. Therefore, short-term
extreme movements in price are not hidden. Once calculated, smoothing
can be applied to the CMO, if desired;
- The scale is bounded between +100 and -100, thereby allowing you to
clearly see changes in net momentum using the 0 level. The bounded scale
also allows you to conveniently compare values across different securities.
WARNING:
- For purpose educate only
- This script to change bars colors