EVWAPThis indicator plots two Volume-Weighted Average Price (VWAP) lines anchored to earnings events:
EVWAP (Earnings Day): Resets VWAP on the day of the earnings release.
EVWAP (Post-Earnings Day): Resets VWAP on the first trading day after earnings.
These earnings-based VWAPs help identify average price zones impacted by earnings, providing insight into post-earnings support/resistance and potential trend shifts. Works on all timeframes.
Useful for traders analyzing price reactions around earnings reports.
M-VWAP

ARSI – (VWAP & ATR) 3QKRAKThe ARSI Long & Short – Dynamic Risk Sizing (VWAP & ATR) indicator combines three core components—an adjusted RSI oscillator (ARSI), Volume‐Weighted Average Price (VWAP), and Average True Range (ATR)—so that entry/exit signals and position sizing are always tailored to current market conditions. ARSI, plotted from 0 to 100 with clearly marked overbought and oversold zones, is the primary signal driver: when ARSI falls below the lower threshold it indicates an excessive sell‐off and flags a long opportunity, whereas a break above the upper threshold signals overextended gains and foreshadows a short. A midpoint line at 50 can serve as an early exit or reduction signal when crossed against your position.
VWAP, showing the volume‐weighted average price over the chosen period, acts as a trend filter—long trades are only taken when price sits above VWAP, and shorts only when it’s below—ensuring each trade aligns with the prevailing market momentum. ATR measures current volatility and is used both to set safe stop‐loss levels and to dynamically size each position. In practice, this means positions automatically shrink in high‐volatility environments and grow in quieter markets, all while risking a fixed percentage of your capital.
Everything appears on a single chart: the ARSI pane below the price window with its reference levels; VWAP overlaid on the price; and the ATR‐based stop‐loss distances graphically displayed. Traders thus get a comprehensive, at-a-glance view of entries, exits, trend confirmation, and exactly how large a position they can safely take. The indicator runs in real time, removing the need for manual parameter calculations and letting you focus on strategic decision-making.

Dynamic VWAP: Fair Value & Divergence SuiteDynamic VWAP: Fair Value & Divergence Suite
Dynamic VWAP: Fair Value & Divergence Suite is a comprehensive tool for tracking contextual valuation, overextension, and potential reversal signals in trending markets. Unlike traditional VWAP that anchors to the start of a session or a fixed period, this indicator dynamically resets the VWAP anchor to the most recent swing low. This design allows you to monitor how far price has extended from the most recent significant low, helping identify zones of potential profit-taking or reversion.
Deviation bands (standard deviations above the anchored VWAP) provide a clear visual framework to assess whether price is in a fair value zone (±1σ), moderately extended (+2σ), or in zones of extreme extension (+3σ to +5σ). The indicator also highlights contextual divergence signals, including slope deceleration, weak-volume retests, and deviation failures—giving you actionable confluence around potential reversal points.
Because the anchor updates dynamically, this tool is particularly well suited for trend-following assets like BTC or stocks in sustained moves, where price rarely returns to deep negative deviation zones. For this reason, the indicator focuses on upside extension rather than symmetrical reversion to a long-term mean.
🎯 Key Features
✅ Dynamic Swing Low Anchoring
Continuously re-anchors VWAP to the most recent swing low based on your chosen lookback period.
Provides context for trend progression and overextension relative to structural lows.
✅ Standard Deviation Bands
Plots up to +5σ deviation bands to visualize levels of overextension.
Extended bands (+3σ to +5σ) can be toggled for simplicity.
✅ Conditional Zone Fills
Colored background fills show when price is inside each valuation zone.
Helps you immediately see if price is in fair value, moderately extended, or highly stretched territory.
✅ Divergence Detection
VWAP Slope Divergence: Flags when price makes a higher high but VWAP slope decelerates.
Low Volume Retest: Highlights weak re-tests of VWAP on low volume.
Deviation Failure: Identifies when price reverts back inside +1σ after closing beyond +3σ.
✅ Volume Fallback
If volume is unavailable, uses high-low range as a proxy.
✅ Highly Customizable
Adjust lookbacks, show/hide extended bands, toggle fills, and enable or disable divergences.
🛠️ How to Use
Identify Buy and Sell Zones
Price in the fair value band (±1σ) suggests equilibrium.
Reaching +2σ to +3σ signals increasing overextension and potential areas to take profits.
+4σ to +5σ zones can be used to watch for exhaustion or mean-reversion setups.
Monitor Divergence Signals
Use slope divergence and deviation failures to look for confluence with overextension.
Low volume retests can flag rallies lacking conviction.
Adapt Swing Lookback
30–50 bars: Faster re-anchoring for swing trading.
75–100 bars: More stable anchors for longer-term trends.
🧭 Best Practices
Combine the anchored VWAP with higher timeframe structure.
Confirm signals with other tools (momentum, volume profiles, or trend filters).
Use extended deviation zones as context, not as standalone signals.
⚠️ Disclaimer
This script is for educational and informational purposes only. It does not constitute financial advice or a recommendation to buy or sell any security or asset. Always do your own research and consult a qualified financial professional before making any trading decisions. Past performance does not guarantee future results.

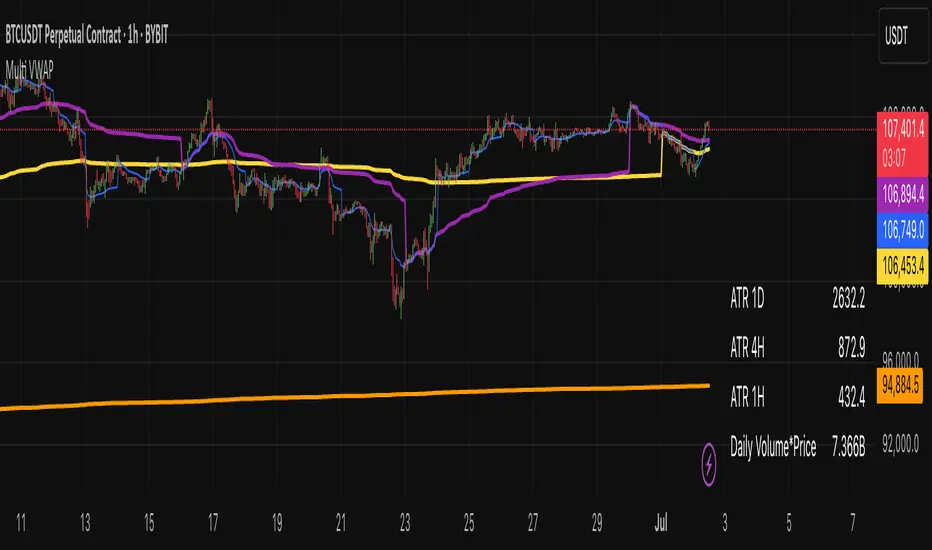
Multi VWAP indicatorMulti VWAP – Advanced Volume-Weighted Average Price Tool
The Multi VWAP indicator is a powerful tool for traders who use volume-based price analysis to find high-probability trade levels. It plots multiple VWAPs across different timeframes and key market anchors to give a deeper view of market structure and value.
Features:
Multi-Timeframe VWAPs: Displays VWAPs for the Year, Month, Week, and Day – giving you an instant overview of where price is trading relative to its volume-based average over time.
Anchored VWAPs from Yearly High/Low: Automatically anchors VWAP to the Yearly High and Yearly Low – these levels often act as dynamic support and resistance, making them excellent reference points for both entries and exits.
ATR Levels: Optional display of Average True Range (ATR) on Daily, 4-Hour, and Hourly timeframes – useful for volatility assessment and risk management.
Volume × Price Analysis: Includes an option to show Volume × Price for the previous day, which is especially helpful when trading low-liquidity cryptocurrencies or small-cap stocks, where volume has a stronger influence on price.
The Multi VWAP indicator is ideal for traders who want a layered, volume-driven perspective of the market. It helps identify key support and resistance levels, track market sentiment shifts, and improve timing across different trading styles.
VWAP Deviation Channels with Probability (Lite)VWAP Deviation Channels with Probability (Lite)
Version 1.2
Overview
This indicator is a powerful tool for intraday traders, designed to identify high-probability areas of support and resistance. It plots the Volume-Weighted Average Price (VWAP) as a central "value" line and then draws statistically-based deviation channels around it.
Its unique feature is a dynamic probability engine that analyzes thousands of historical price bars to calculate and display the real-time likelihood of the price touching each of these deviation levels. This provides a quantifiable edge for making trading decisions.
Core Concepts Explained
This indicator is built on three key concepts:
The VWAP (Volume-Weighted Average Price): The dotted midline of the channels is the session VWAP. Unlike a Simple Moving Average (SMA) which only considers price, the VWAP incorporates volume into its calculation. This makes it a much more significant benchmark, as it represents the true average price where the most business has been transacted during the day. It's heavily used by institutional traders, which is why price often reacts strongly to it.
Standard Deviation Channels: The channels above and below the VWAP are based on standard deviations. Standard deviation is a statistical measure of volatility.
- Wide Bands: When the channels are wide, it signifies high volatility.
- Narrow Bands: When the channels are tight and narrow, it signifies low volatility and
consolidation (a "squeeze").
The Conditional Probability Engine: This is the heart of the indicator. For every deviation level, the script displays a percentage. This percentage answers a very specific question:
"Based on thousands of previous bars, when the last candle had a certain momentum (bullish or bearish), what was the historical probability that the price would touch this specific level?"
The probabilities are calculated separately depending on whether the previous candle was green (bullish) or red (bearish). This provides a nuanced, momentum-based edge. The level with the highest probability is highlighted, acting as a "price magnet."
How to Use This Indicator
Recommended Timeframes:
This indicator is designed specifically for intraday trading. It works best on timeframes like the 1-minute, 5-minute, and 15-minute charts. It will not display correctly on daily or higher timeframes.
Recommended Trading Strategy: Mean Reversion
The primary strategy for this indicator is "Mean Reversion." The core idea is that as the price stretches to extreme levels far away from the VWAP (the "mean"), it is statistically more likely to "snap back" toward it.
Here is a step-by-step guide to trading this setup:
1. Identify the Extreme: Wait for the price to push into one of the outer deviation bands (e.g., the -2, -3, or -4 bands for a buy setup, or the +2, +3, or +4 bands for a sell setup).
2. Look for the High-Probability Zone: Pay close attention to the highlighted probability label. This is the level that has historically acted as the strongest magnet for price. A touch of this level represents a high-probability area for a potential reversal.
3. Wait for Confirmation: Do not enter a trade just because the price has touched a band. Wait for a confirmation candle that shows momentum is shifting.
- For a Buy: Look for a strong bullish candle (e.g., a green engulfing candle or a hammer/pin
bar) to form at the lower bands.
- For a Sell: Look for a strong bearish candle (e.g., a red engulfing candle or a shooting star)
to form at the upper bands.
Define Your Exit:
- Take Profit: A logical primary target for a mean reversion trade is the VWAP (midLine).
- Stop Loss: A logical place for a stop-loss is just outside the next deviation band. For
example, if you enter a long trade at the -3 band, your stop loss could be placed just
below the -4 band.
Disclaimer: This indicator is a tool for analysis and should not be considered a standalone trading system. Trading involves significant risk, and past performance is not indicative of future results. Always use this indicator in conjunction with other forms of analysis and sound risk management practices.

Fibo_Ma with Toggleable 200 EMA Filter Fibo_MA with Toggleable 200 EMA Filter
Description:
This multi-functional indicator blends Fibonacci-based moving averages with customizable filters and visual enhancements to support various trading strategies. It offers traders the flexibility to analyze trend dynamics and potential reversal zones using multiple tools in one script.
Key Features:
🔹 Fibonacci MA Framework
Leverage a range of Fibonacci numbers (from 1 to 233) to visualize trend-based EMA lines with optional smoothing. Users can choose the moving average method (SMA, EMA, RMA, WMA, VWMA, etc.) and adjust the smoothing length for fine-tuned analysis.
🔹 VWAP and Dynamic EMA Tools
Includes VWAP and a color-coded 200 EMA that updates based on trend slope. These help visualize key dynamic support and resistance levels.
🔹 Multi-Timeframe Support
Option to switch the data source to a higher timeframe for broader trend confirmation.
🔹 Signal Highlights
Bullish and bearish signal markers based on crossovers with optional filters.
Background highlights show whether the current price is above or below a smoothed EMA line.
🔹 Customizable Filters
Enable or disable filters like:
200 EMA Position Filter (only signal when price is above or below the 200 EMA)
ATR Filter (filter out low-volatility candles)
Volume Filter (signal only on sufficient volume)
🔹 Cross Alerts & Labels
Built-in alert conditions for crossovers and customizable signal display options—labels, shapes, and background highlights.
🔹 Advanced Options
Toggle forecast line visibility and offset
Fine-tune alerts using price action relative to the smooth trend line
Optional tail and cross label display for deeper chart customization
How to Use:
This tool can support trend-following, breakout, and pullback strategies. Customize the MA types, filters, and timeframe settings to match your trading style. The script is designed for visual clarity while offering rich configurability for discretionary and system-based traders.

Out of the Noise Intraday Strategy with VWAP [YuL]This is my (naive) implementation of "Beat the Market An Effective Intraday Momentum Strategy for S&P500 ETF (SPY)" paper by Carlo Zarattini, Andrew Aziz, Andrea Barbon, so the credit goes to them.
It is supposed to run on SPY on 30-minute timeframe, there may be issues on other timeframes.
I've used settings that were used by the authors in the original paper to keep it close to the publication, but I understand that they are very aggressive and probably shouldn't be used like that.
Results are good, but not as good as they are stated in the paper (unsurprisingly?): returns are smaller and Sharpe is very low (which is actually weird given the returns and drawdown ratio), there are also margin calls if you enable margin check (and you should).
I have my own ideas of improvements which I will probably implement separately to keep this clean.

Rolling VWAP LevelsRolling VWAP Levels Indicator
Overview
Dynamic horizontal lines showing rolling Volume Weighted Average Price (VWAP) levels for multiple timeframes (7D, 30D, 90D, 365D) that update in real-time as new bars form.
Who This Is For
Day traders using VWAP as support/resistance
Swing traders analyzing multi-timeframe price structure
Scalpers looking for mean reversion entries
Options traders needing volatility bands for strike selection
Institutional traders tracking volume-weighted fair value
Risk managers requiring dynamic stop levels
How To Trade With It
Mean Reversion Strategies:
Buy when price is below VWAP and showing bullish divergence
Sell when price is above VWAP and showing bearish signals
Use multiple timeframes - enter on shorter, confirm on longer
Target opposite VWAP level for profit taking
Breakout Trading:
Watch for price breaking above/below key VWAP levels with volume
Use 7D VWAP for intraday breakouts
Use 30D/90D VWAP for swing trade breakouts
Confirm breakout with move beyond first standard deviation band
Support/Resistance Trading:
VWAP levels act as dynamic support in uptrends
VWAP levels act as dynamic resistance in downtrends
Multiple timeframe VWAP confluence creates stronger levels
Use standard deviation bands as additional S/R zones
Risk Management:
Place stops beyond next VWAP level
Use standard deviation bands for position sizing
Exit partial positions at VWAP levels
Monitor distance table for overextended moves
Key Features
Real-time Updates: Lines move and extend as new bars form
Individual Styling: Custom colors, widths, styles for each timeframe
Standard Deviation Bands: Optional volatility bands with custom multipliers
Smart Labels: Positioned above, below, or diagonally relative to lines
Distance Table: Shows percentage distance from each VWAP level
Alert System: Get notified when price crosses VWAP levels
Memory Efficient: Automatically cleans up old drawing objects
Settings Explained
Display Group: Show/hide labels, font size, line transparency, positioning
Individual VWAP Groups: Color, line width (1-5), line style for each timeframe
Standard Deviation Bands: Enable bands with custom multipliers (0.5, 1.0, 1.5, 2.0, etc.)
Labels Group: Position (8 options including diagonal), custom text, price display
Additional Info: Distance table, alert conditions
Technical Implementation
Uses rolling arrays to maintain sliding windows of price*volume data. The core calculation function processes both VWAP and standard deviation efficiently. Lines are created dynamically and updated every bar. Memory management prevents object accumulation through automatic cleanup.
Best Practices
Start with 7D and 30D VWAP for most strategies
Add 90D/365D for longer-term context
Use standard deviation bands when volatility matters
Position labels to avoid chart clutter
Enable distance table during high volatility periods
Set alerts for key VWAP level breaks
Market Applications
Forex: Major pairs during London/NY sessions
Stocks: Large cap names with good volume
Crypto: Bitcoin, Ethereum, major altcoins
Futures: ES, NQ, CL, GC with continuous volume
Options: Use SD bands for strike selection and volatility assessment

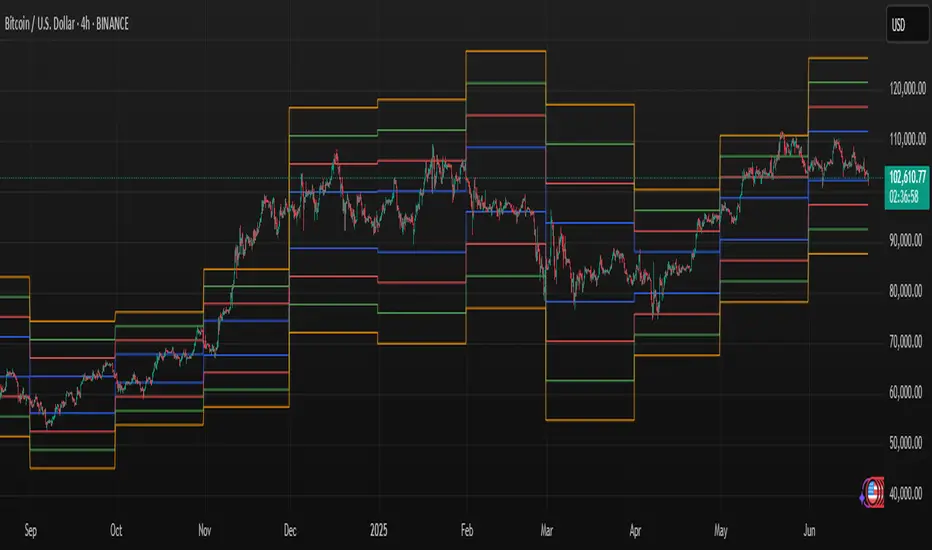
Volume Zones IndicatorVolume Zones Indicator — VWAP with Dynamic Monthly Volume Zones
This indicator is an enhanced version of the classic VWAP (Volume Weighted Average Price), designed to create clear monthly zones around VWAP based on average price range (ATR) and volume activity.
The core idea is to highlight key zones where price is more likely to reverse or consolidate, based on where significant trading volume occurs.
How does it work?
VWAP is calculated over the last N days (set by the lookbackPeriod input).
Four zones are plotted above and below VWAP, spaced using a multiple of ATR.
Each zone has its own color for clarity:
Blue — closest to VWAP
Red — second band
Green — third band
Orange — outer band (potential breakout or exhaustion zone)
If the current volume exceeds the moving average of volume, it is highlighted directly on the chart. This helps detect accumulation or distribution moments more easily.
What does the trader see?
You see horizontal colored bands on the chart that update at the start of each new month. These zones:
Remain fixed throughout the month
Automatically adjust based on recent volume and volatility
Act as dynamic support/resistance levels
Best used for:
Mean reversion strategies — identifying pullbacks toward value areas
Support and resistance mapping — automatic SR zones based on price/volume behavior
Breakout filtering — when price reaches zone 3 or 4, trend continuation or reversal is likely
Adding volume context to price action — works well with candlestick and pattern analysis
Settings
Lookback Period (Days): VWAP and volume smoothing length
Volume Area Threshold %: Reserved for future functionality
Works on any timeframe; best suited for 4H timeframe.
Zones are calculated and fixed monthly for clean visual context
Combines price structure with actual volume flow for more reliable decision-making
SHA Multi Pivot Points -v1.0.0🔎Using Pivot Points in Trading
Traders use PPs to help determine predefined support and resistance levels to guide their trading strategies. In addition, traders identify potential price reversals, trend direction, and breakout opportunities:
Trend identification: PPs act as a reference level to gauge market sentiment. If the price opens above the PP and remains above it, traders interpret this as an uptrend. Conversely, if the price opens below the pivot point and stays below, it suggests a downtrend.
Support and resistance determination: Pivot levels are natural barriers where price reactions frequently occur. Traders may enter long positions near support levels, expecting a price bounce, or if the price approaches resistance levels, traders may consider shorting the asset.
Breakout trading: When the price breaks above resistance or support, it may indicate strong momentum for further movement.
Reversal identification: Traders also look for failed breakouts or price rejections at pivot levels to anticipate reversals.
Trading strategy combinations: Traders can improve accuracy by combining PPs with other technical analysis indicators.
1. Camarilla Pivot Points
📌 Overview:
Developed by Nick Scott in 1989, Camarilla Pivot Points are designed for short-term, intraday trading. Unlike traditional pivots, Camarilla levels are tighter and more responsive, making them useful in volatile markets.
📐 Key Levels:
It generates eight levels:
- Resistance: Initial Level (R1), Mid-range Level (R2), Sell Reversal Level (R3), Breakout Level (R4)
- Support: Initial Level (S1), Mid-range Level (S2), Buy Reversal Level (S3), Breakout Level (S4)
✅ How to Use:
- S1/R1 + RSI or volume divergence to confirm weak momentum and early reversals.
- S2/R2 with price action patterns to enter early on major moves before L3/H3 get tested.
- S3/R3: Mean-reversion zones → price often reverses.
- Break of S4/R4: Strong breakout → trend-following signal.
- Combine with volume or candlestick confirmation for entries.
🔹 2. Floor (Standard) Pivot Points
📌 Overview:
This is the most traditional pivot method, widely used by floor traders. It’s symmetrical and provides a clear central pivot point with equally spaced support and resistance levels.
📐 Key Levels:
- Povit Points : Average price (PPs)
- Resistance : First price ceiling (R1), Stronger ceiling (R2), Extreme resistance (R3)
- Support : First price floor (S1), Stronger floor (S2), Extreme support (S3)
✅ How to Use:
- Above PPs = bullish bias; Below PPs = bearish bias.
- S1/R1 are most used for intraday targets.
- S2–S3/R2–R3 indicate potential extreme moves.
- Often used in combination with momentum indicators.
🔹 3. Woodie Pivot Points
📌 Overview:
Woodie’s pivot formula gives double weight to the closing price, emphasizing the most recent session's sentiment.
📐 Key Levels:
- Povit Points : Weighted average (PPs)
- Resistance : First price ceiling (R1), Stronger resistance (R2)
- Support : First price floor (S1), Stronger support (S2)
✅ How to Use:
- Works best in fast-moving markets.
- PPs acts as a momentum-based balance level.
- Good for scalpers and momentum traders.
🔹 4. Fusion Pivot Points
📌 Overview:
This method differs significantly — it calculates only one support and one resistance level, adjusting based on the relationship between the open and close.
📐 Key Levels:
- Povit Points : Single directional (PPs)
- Resistance : Potential ceiling (R)
- Support : Potential floor (S)
✅ How to Use:
- Not symmetrical → more responsive to price behavior.
- Best for breakout or reversal strategies.
- Use when you're expecting directional momentum.
🔹 5. Classic Pivot Points (Traditional)
📌 Overview:
Also known as Standard or Traditional Pivot Points, this is the default method used by most charting platforms. It offers a balanced and simple framework.
📐 Key Levels:
- Povit Points : Central price level (PPs)
- Resistance : First ceiling (R1), Stronger resistance (R2), Extreme resistance (R3)
- Support : First floor (S1), Stronger floor (S2), Extreme support (S3)
✅ How to Use:
- PPs is the market’s equilibrium point.
- Helps define market structure, bias, and trade zones.
- Combine with order blocks, RSI, or MACD for confirmation.
📊 Summary Comparison :
1. Camarilla Pivot Points
- Focus : Mean Reversion & Breakouts
- Best Use : Scalping, Day Trading
2. Floor Pivot Points
- Focus : General Support/Resistance
- Best Use : Intraday, Swing
3. Woodie Pivot Points
- Focus : Recent Close Emphasis
- Best Use : Momentum Trading
4. Fusion Pivot Points
- Focus : Trend/Breakout
- Best Use : Directional Breakouts
5. Classic Povit Points
- Focus : Market Structure
- Best Use : General Use
⚠️ Disclaimer
The information and tools provided in this script are for educational and informational purposes only. They do not constitute financial advice, investment recommendations, or a solicitation to buy or sell any financial instrument.
Trading in the financial markets involves risk of loss and is not suitable for every investor. You are solely responsible for your trading decisions. Always do your own research, use proper risk management, and consult a licensed financial advisor before making any financial decisions.

Bitcoin Macro Oscillator | [DeV]The Bitcoin Macro Oscillator (BMO) is a sophisticated fundamental indicator designed to provide a comprehensive view of Bitcoin’s market conditions by combining four key on-chain metrics: the Market Value to Realized Value (MVRV) Ratio, Volume-Weighted Average Price (VWAP) Ratio, Cumulative Value-Days Destroyed (CVDD) Ratio, and Sharpe Ratio. These metrics are individually z-scored and weighted according to user-defined preferences, then averaged to produce a single oscillating value, the BMO Z-score. This helps users identify whether Bitcoin is in a bullish (above zero) or bearish (below zero) phase, offering insights into potential market tops, bottoms, and overall trend strength. Inspired and reverse engineered from the BMO of Woonomics, this indicator is enhanced with a customizable moving average.
Market Value to Realized Value (MVRV) Ratio
The MVRV Ratio compares Bitcoin’s current market capitalization (price multiplied by circulating supply) to its realized capitalization (the value of all coins at the price they were last moved on the blockchain). Calculated as MVRV = Market Cap / Realized Cap, it is then z-scored over a user-defined lookback period (default 120 days). This metric tracks whether Bitcoin is overvalued (high MVRV, suggesting a market top) or undervalued (low MVRV, indicating a potential bottom), providing a gauge of investor profitability and market sentiment.
Volume-Weighted Average Price (VWAP) Ratio
The VWAP Ratio measures Bitcoin’s current price against its volume-weighted average price, which is computed by summing the product of price and volume over a lookback period (default 120 days) and dividing by total volume, with a fallback to the current price if volume is zero. The ratio is z-scored to standardize it. This tracks the relationship between price and the average price paid with volume consideration, helping identify overbought or oversold conditions—high values may signal tops, while low values suggest bottoms.
Cumulative Value-Days Destroyed (CVDD) Ratio
The CVDD Ratio is based on the CVDD metric, which estimates the total value of Bitcoin that has been “destroyed” (spent at a loss) over time, approximated here using a longer-term simple moving average (SMA) of the price over twice the lookback period. The ratio is calculated as the current price divided by this CVDD price, then z-scored. It tracks the accumulation of value destruction, with low values indicating bearish exhaustion and high values suggesting bullish momentum.
Sharpe Ratio
The Sharpe Ratio assesses Bitcoin’s risk-adjusted return by comparing the average return (calculated as the natural log of the price change) to its volatility (standard deviation of returns) over a user-defined Sharpe lookback period (default 180 days). If volatility is zero, it defaults to zero to avoid errors. This z-scored value tracks whether Bitcoin’s price movements offer a favorable return for the risk taken—positive values indicate good risk-adjusted performance, while negative values suggest caution.
Together, the MVRV, VWAP, CVDD, and Sharpe Ratio metrics provide a multi-faceted view of Bitcoin’s market health, with each contributing unique insights into valuation, volume, value destruction, and risk-adjusted performance. Their weighted combination into the BMO Z-score balances these inputs to offer a unified signal, enhanced by a customizable moving average (default 90-period EMA) that smooths the Z-score for trend confirmation—rising when bullish, falling when bearish. Credit to Woonomics for inspiring this robust framework, which adapts their BMO concept into a flexible, user-tailored tool.

Mark4ex vWapMark4ex VWAP is a precision session-anchored Volume Weighted Average Price (VWAP) indicator crafted for intraday traders who want clean, reliable VWAP levels that reset daily to match a specific market session.
Unlike the built-in continuous VWAP, this version anchors each day to your chosen session start and end time, most commonly aligned with the New York Stock Exchange Open (9:30 AM EST) through the market close (4:00 PM EST). This ensures your VWAP reflects only intraday price action within your active trading window — filtering out irrelevant overnight moves and providing clearer mean-reversion signals.
Key Features:
Fully configurable session start & end times — adapt it for NY session or any other market.
Anchored VWAP resets daily for true session-based levels.
Built for the New York Open Range Breakout strategy: see how price interacts with VWAP during the volatile first 30–60 minutes of the US market.
Plots a clean, dynamic line that updates tick-by-tick during the session and disappears outside trading hours.
Designed to help you spot real-time support/resistance, intraday fair value zones, and liquidity magnets used by institutional traders.
How to Use — NY Open Range Breakout:
During the first hour of the New York session, institutional traders often define an “Opening Range” — the high and low formed shortly after the bell. The VWAP in this zone acts as a dynamic pivot point:
When price is above the session VWAP, bulls are in control — the level acts as a support floor for pullbacks.
When price is below the session VWAP, bears dominate — the level acts as resistance against bounces.
Breakouts from the opening range often test the VWAP for confirmation or rejection.
Traders use this to time entries for breakouts, retests, or mean-reversion scalps with greater confidence.
⚙️ Recommended Settings:
Default: 9:30 AM to 4:00 PM New York time — standard US equities session.
Adjust hours/minutes to match your target market’s open and close.
👤 Who is it for?
Scalpers, day traders, prop traders, and anyone trading the NY Open, indices like the S&P 500, or highly liquid stocks during US cash hours.
🚀 Why use Mark4ex VWAP?
Because a properly anchored VWAP is a trader’s real-time institutional fair value, giving you better context than static moving averages. It adapts live to volume shifts and helps you follow smart money footprints.
This indicator will reconfigure every day, anchored to the New York Open, it will also leave historical NY Open VWAP for study purpose.
Volume Weighted Average Price Dynamic Slope [sgbpulse]VWAP Dynamic Slope: A Comprehensive Indicator for Trend Identification and Smart Trading
Introducing VWAP Dynamic Slope, an innovative TradingView indicator that harnesses the power of Volume Weighted Average Price (VWAP) and enhances it with immediate visual feedback. The indicator colors the VWAP line based on its slope, allowing you to quickly and easily identify the direction and strength of the current trend for the asset, providing advanced tools for in-depth analysis.
What is VWAP and Why is it so Important?
VWAP (Volume Weighted Average Price) is an indicator that represents the average price at which an asset has traded, weighted by the volume traded at each price level. Unlike a simple moving average, VWAP gives greater weight to trades executed with high volume, making it a reliable measure of the asset's "true" or "fair" price within a given period. Many institutional traders use VWAP as a central reference point for evaluating the effectiveness of entries and exits. An asset trading above its VWAP is considered to have bullish momentum, and below it – bearish momentum.
How it Works: Dynamic VWAP Slope Analysis
VWAP Dynamic Slope analyzes the inclination of the VWAP line and displays it using an intuitive color scheme:
Positive Slope (Uptrend): When the VWAP points upwards, signaling positive momentum, the default color will be green.
Negative Slope (Downtrend): When the VWAP points downwards, signaling negative momentum, the default color will be orange.
Trend Change (CHG): When a change in the VWAP's trend direction occurs, a "CHG" label will be displayed. The label's color will be green if the change is to an uptrend, and orange if the change is to a downtrend.
Identifying Steep Slopes for Increased Momentum:
The indicator's uniqueness lies in its ability to identify "steep" slopes – rapid and particularly strong changes in the VWAP's direction. This indicates exceptionally strong momentum:
Steep Positive Slope: The VWAP color will change to dark green, indicating significant buying pressure.
Steep Negative Slope: The VWAP color will change to dark red, indicating significant selling pressure.
Dynamic Momentum Strength Label: In situations of steep slope (positive or negative), a dynamic label will be displayed with the change value of the VWAP at that point. This label allows you to monitor momentum strength, intensification, or weakening in real-time.
Advanced Analytical Tools for Complete Control
VWAP Dynamic Slope provides you with unprecedented flexibility through a variety of customizable tools:
Multiple VWAP Anchors and Visual Marking:
Common Time Anchors: Choose whether the VWAP resets at the beginning of each Session (daily), Week, Month, Quarter, Year, Decade, or Century.
Advanced Intraday Anchors: Within the Session, you can choose to calculate VWAP specifically for Pre-Market, Regular Hours, and Post-Market hours. This option is particularly crucial for intraday traders.
Important Event Anchors: The indicator allows for VWAP resets at significant milestones such as Earnings, Dividends, and Splits, for analyzing the market's immediate reaction.
Visual Anchor Marking: To enhance clarity and orientation, a Label ⚓ can be displayed at each selected anchor point, helping to immediately identify the start point of the VWAP calculation in the chosen context.
Customizable Bands (Up to Three on Each Side):
Add up to three Bands above and below the VWAP to identify areas of deviation and excursion from the average price. You have two calculation options:
Standard Deviation: Based on volatility and statistical distance from the VWAP.
Percentage: Defines fixed percentage-based bands from the VWAP.
Key Pre-Market Levels (Pre-Market High/Low):
Display the Pre-Market High and Low levels as separate lines on the chart. These lines often serve as important psychological support and resistance zones, allowing you to see how the VWAP behaves near them.
Full Customization and Precise Control:
VWAP Source Selection: Determine which price data type will be used for the VWAP calculation. The default is HLC3 (average of High, Low, and Close), but any other relevant data source available in TradingView can be selected.
Offset: Set an offset for the VWAP line, allowing you to shift it left or right on the time axis by a chosen number of bars.
Customizable Colors: Choose your preferred colors for each slope state, Pre-Market High/Low lines, and Bands.
Setting the "Steepness" Threshold (Per-mille Price Change Per Minute ‱/min with Auto-Adjustment): Determine the sensitivity for identifying a steep slope by setting the required change threshold in VWAP in terms of per-mille price change per minute (‱/min). The indicator performs smart adjustment for any timeframe you select on the chart (e.g., 30 seconds, 1 minute, 5 minutes, 10 minutes, etc.), ensuring that the "steepness" setting maintains consistency and relevance.
Examples for Setting the Steepness Threshold:
Suppose you set the steepness threshold to 0.3‱/min (per-mille price change per minute).
On a 30-second chart: The indicator will check if the VWAP changed by 0.15 ‱/min (half of the per-minute threshold) within a single bar. If so, the slope will be considered steep. Explanation: Since 30 seconds is half a minute, the indicator looks for a change that is half of the threshold set for a full minute.
On a 1-minute chart: The indicator will check if the VWAP changed by 0.3 ‱/min (the full per-minute threshold) within a single bar. If so, the slope will be considered steep. Explanation: Here, the bar represents a full minute, so we check the full threshold.
On a 5-minute chart: The indicator will check if the VWAP changed by 1.5 ‱/min (5 times the per-minute threshold) within a single bar. If so, the slope will be considered steep. Explanation: A 5-minute bar contains 5 minutes, so the cumulative change in VWAP needs to be 5 times greater to be considered "steep" on the same scale.
In summary, this setting allows you to precisely and uniformly control the sensitivity of steep slope detection across all timeframes, providing immense flexibility in analyzing the asset's momentum.
Advantages of Using Per-mille Price Change Per Minute (‱/min)
Using per-mille price change per minute (‱/min) offers several key advantages for your indicator:
Normalized and Objective Measurement: It provides a uniform scale for the VWAP's rate of change, regardless of the asset's price or nominal value. A 0.1 per-mille change per minute always carries the same relative significance.
Comparison Across Different Asset Prices: Using per-mille allows for direct comparison of VWAP movement strength between assets trading at very different prices (e.g., a $100 asset versus a $1 asset), enabling an understanding of true momentum without bias from the nominal price.
Smart Timeframe Agnostic Adjustment: This is a critical capability. The indicator automatically adjusts the per-mille per minute threshold you set to any chart timeframe (30 seconds, 1 minute, 5 minutes, etc.), maintaining consistency in "steepness" detection without manual recalibration.
Precise Momentum Identification: This measurement precisely identifies when the VWAP's rate of change becomes significant, and when momentum strengthens or weakens, contributing to more informed trading decisions.
In short, per-mille change per minute (‱/min) provides accuracy, consistency, and flexibility in identifying VWAP momentum changes, with smart adaptation across all timeframes.
Who is this Indicator For?
VWAP Dynamic Slope is a powerful tool for:
Intraday Traders: For quick identification of intraday trend directions and momentum across any timeframe, with specific consideration for Pre-Market, Regular Hours, or Post-Market VWAP, and incorporating key pre-market levels.
Swing Traders and Long-Term Investors: For analyzing longer-term trends based on periodic and event-driven VWAP anchors.
Beginner Traders: As an excellent visual aid for understanding the relationship between price, volume, and trend direction, and how different anchor points, pre-market levels, and data sources influence price behavior.
Experienced Traders: For integration with existing strategies, gaining additional confirmation for trend strength identification, and highly precise and flexible parameter calibration.
VWAP Dynamic Slope provides a rich, multi-dimensional layer of information about the VWAP, helping you make more informed trading decisions in real-time, within the context of your chosen asset.

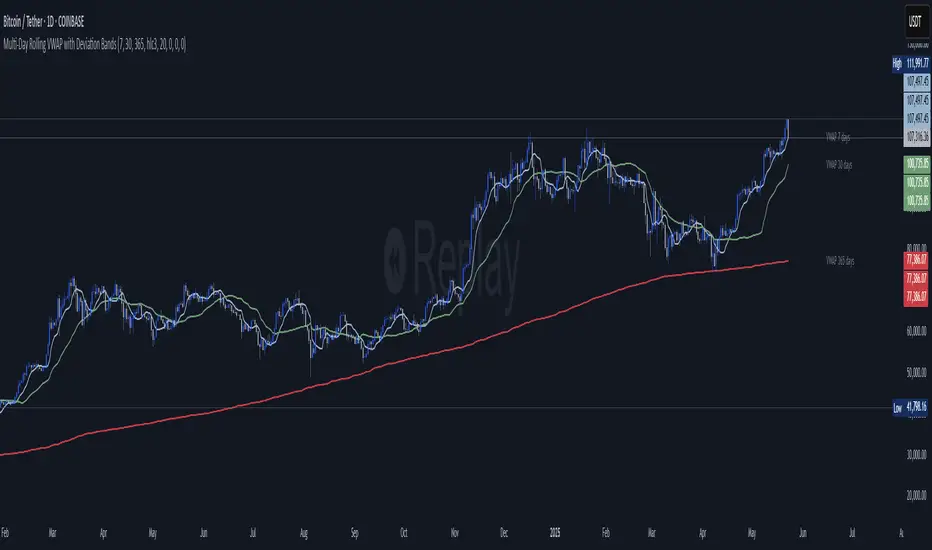
Multi‑Day Rolling VWAP with Deviation Bands📄 Description:
This script introduces a multi-day rolling VWAP (Volume-Weighted Average Price) indicator designed for traders who seek deeper structural insights beyond session-based VWAPs. It is particularly effective on intraday charts like 15m, 45m, 1H, and 4H, and is optimized for crypto swing, position, and trend exhaustion strategies.
Unlike traditional VWAPs that reset daily or weekly, this tool computes persistent VWAP levels by aggregating daily price-volume data across rolling windows such as the past 7, 30, or 365 days. These levels act as anchored support/resistance zones derived from real traded volume — helping traders identify where price is fair or stretched over time.
To enhance confluence and precision, each VWAP level optionally includes standard deviation bands, which act as dynamic volatility envelopes. These bands support custom multipliers, including Fibonacci levels like 0.272, 0.618, 1.0, and 1.618, providing flexible tools for identifying potential reversal or mean reversion zones.
✅ Key Features:
📊 Rolling VWAP over user-defined lookback windows (e.g. 7, 30, 365 days)
📐 Optional deviation bands based on volume-weighted standard deviation
🔢 Supports both traditional and Fibonacci multipliers for precise band tuning
⚙️ Independent configuration for up to 3 VWAP profiles (short/mid/long)
🔁 Auto-updates daily and tracks consistent volume-based anchoring
💼 Designed for crypto markets, especially high-volatility altcoins
🧠 How it Works:
At the start of each new day, the script logs cumulative volume and typical price values.
It maintains a rolling window of those daily values over configurable periods.
VWAPs are recalculated from the historical data each bar, ensuring persistence.
Deviation bands use a volume-weighted standard deviation formula, not naive price stddevs.
All inputs are optional — bands can be turned off by setting their multipliers to 0.
💡 Use Cases:
Identify long-term fair value zones in trending or consolidating markets
Spot overextended conditions using deviation confluence
Build trend continuation or exhaustion strategies around VWAP clusters
Anchor intraday decisions to multi-day volume context
🔒 Why Closed Source?
This script applies a proprietary method of rolling VWAP construction and deviation banding that goes beyond typical session or anchored VWAPs. The volume aggregation logic and smoothing techniques used are custom-built for tracking persistent volume-weighted structure — which is especially valuable in fragmented crypto markets. To protect this unique methodology, the code is published as closed-source.
Disclaimer: This indicator is a tool, not a guarantee. Always manage your risk.
For educational purposes only. Past performance does not guarantee future results.
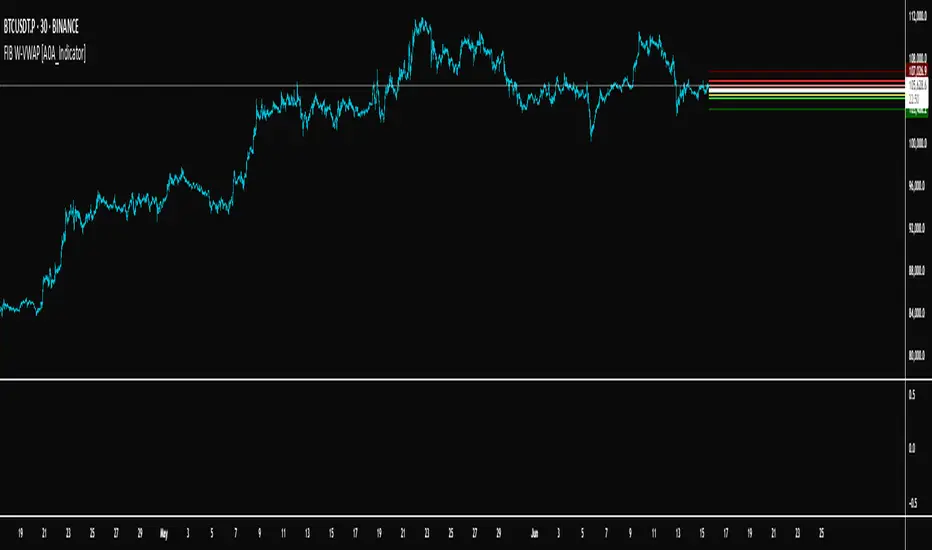
FIB W-VWAP [A0A_Indicator]FIB W-VWAP is an advanced weekly anchored VWAP indicator that leverages Fibonacci-based deviation bands and a custom price source for improved market relevance.
Key Features:
Weekly Anchored VWAP: Resets automatically at the Friday NYSE close, providing a rolling weekly anchor that aligns with professional trading practice.
Fibonacci Deviation Levels: Plots multiple deviation bands around the VWAP, calculated using fixed Fibonacci-inspired multipliers for both positive and negative directions. These serve as key support and resistance zones for mean reversion or trend continuation strategies.
Dynamic Standard Deviation: Each band is based on the live, rolling standard deviation of price within the current weekly session, adapting in real time to changing volatility.
Unique Hybrid Price Source:
VWAP and deviation bands are calculated using a custom price formula:
hidden
This approach gives extra weight to the closing price while still considering intrabar extremes, resulting in a smoother and more robust anchor compared to classic VWAP formulas (such as typical price or close-only).
Visual Enhancements:
Distinct color fills and lines for each band
Configurable transparency and labels
Clearly marked VWAP and all deviation levels, labeled with their corresponding Fibonacci levels
Adaptable for Discretionary and Systematic Trading:
Useful for identifying mean reversion trades, breakouts, and overextended moves during the trading week.
How it works:
At each new weekly session (NY close on Friday), the VWAP and its standard deviation reset.
The script continuously updates cumulative price × volume, cumulative volume, and cumulative price² × volume to maintain accurate VWAP and standard deviation calculations.
Each deviation band is plotted as a multiple of the weekly standard deviation above and below the VWAP, using fixed Fibonacci coefficients.
Labels and horizontal lines extend into the future for clear, actionable visual reference.
Why use this version?
This indicator offers greater precision in turbulent markets, robust support/resistance mapping, and is especially effective for traders seeking a more nuanced, statistically informed view of weekly price structure. The hybrid source makes it more reliable during volatility spikes than classic VWAP methods.
Ready for all timeframes and asset classes—especially powerful for intraday and swing traders working with weekly cycles.
A+ Trade CheckList with Comprehensive Relative StrengthThe indicator designed for traders who need real-time market assessment across multiple timeframes and benchmarks. This comprehensive tool combines traditional technical analysis with sophisticated relative strength measurements to provide a complete market picture in one convenient table display.
The indicator tracks essential trading levels including:
QQQ and SPY trend analysis using exponential moving averages
Previous day and week high/low levels for key support and resistance
Market open levels from the first 5 and 15 minutes of trading (9:30 AM ET)
VWAP positioning for institutional price reference
Short-term EMA positioning for momentum assessment
Advanced Relative Strength Analysis
The standout feature of this indicator is its comprehensive 8-metric relative strength scoring system that compares your current ticker against both QQQ (Nasdaq-100) and SPY (S&P 500) benchmarks.
The 4-Metric Relative Strength System Explained
Metric 1: Relative Strength Ratio (RSR)
Purpose: Measures whether your ticker is outperforming or underperforming relative to its historical relationship with the benchmarks.
How it works:
Calculates the ratio of your ticker's price to QQQ/SPY prices
Compares current ratio to a 20-period moving average of the ratio
Scores +1 if ratio is above average (relative strength), -1 if below (relative weakness)
Trading significance: Identifies when a stock is breaking out of its normal correlation pattern with major indices.
Metric 2: Percentage-Based Relative Performance
Purpose: Compares short-term percentage changes to identify immediate relative momentum.
How it works:
Calculates 5-day percentage change for your ticker and benchmarks
Subtracts benchmark performance from ticker performance
Scores +1 if outperforming by >1%, -1 if underperforming by >1%, 0 for neutral
Trading significance: Captures recent momentum shifts and identifies stocks moving independently of market direction.
Metric 3: Beta-Adjusted Relative Strength (Alpha)
Purpose: Measures risk-adjusted performance by accounting for the ticker's natural volatility relationship with benchmarks.
How it works:
Calculates rolling beta (correlation and variance relationship)
Determines expected returns based on benchmark moves and beta
Measures alpha (excess returns above/below expectations)
Scores based on whether alpha is consistently positive or negative
Trading significance: Identifies stocks generating returns beyond what their risk profile would suggest, indicating fundamental strength or weakness.
Metric 4: Volume-Weighted Relative Strength
Purpose: Incorporates volume analysis to validate price-based relative strength signals.
How it works:
Compares VWAP-based percentage changes between ticker and benchmarks
Applies volume weighting factor based on relative volume strength
Enhances score when high relative volume confirms price movements
Trading significance: Distinguishes between genuine institutional-driven moves and low-volume price action that may not sustain.
Combined Scoring System
The indicator generates 8 individual scores (4 metrics × 2 benchmarks) that combine into a single strength assessment:
Score Interpretation
Strong (4-8 points): Ticker significantly outperforming both benchmarks across multiple methodologies
Moderate Strong (1-3 points): Ticker showing good relative strength with some mixed signals
Neutral (0 points): Balanced performance relative to benchmarks
Moderate Weak (-1 to -3 points): Ticker showing relative weakness with some mixed signals
Weak (-4 to -8 points): Ticker significantly underperforming both benchmarks
Display Format
The indicator shows results as: "Strong (6/8)" indicating the ticker scored 6 out of 8 possible points.

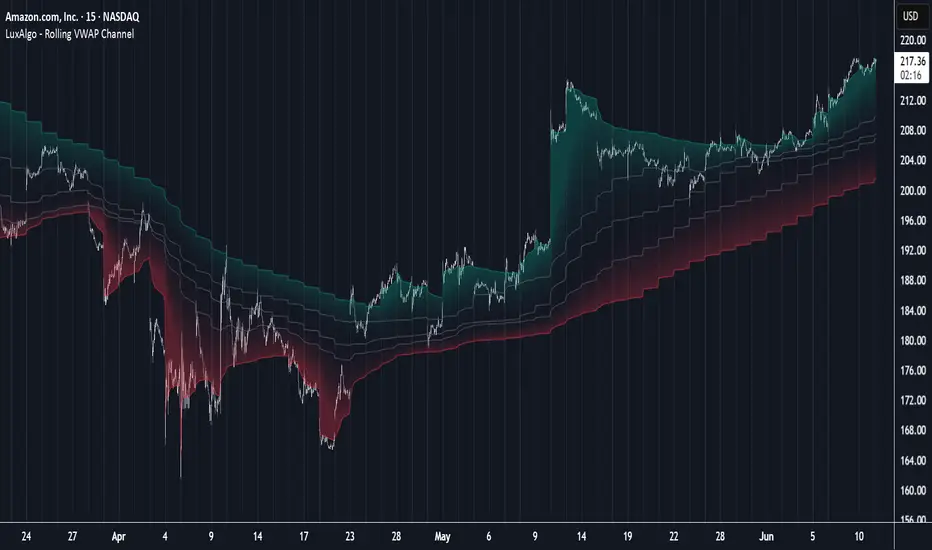
Rolling VWAP Channel [LuxAlgo]The Rolling VWAP Channel indicator creates a channel by analyzing a large number of Volume Weighted Average Prices (VWAPs) and determining a Channel based on percentile linear interpolation throughout the VWAPs.
🔶 USAGE
In this indicator, we have formed a Channel by first calculating multiple VWAPs, each with their respective anchor, then locating prices using "Percentile Linear Interpolation".
Note: Percentile Linear Interpolation locates the price point at which a specified percentage of VWAPs fall below it.
For example, a percentile of 50% would mean that 50% of the VWAP values fall below this price.
This method of analysis is important since the VWAPs are not often evenly distributed; therefore, we are able to draw importance to different levels by analyzing in percentiles.
When visualized, there is typically clustering of the VWAP values, which occurs at any given time, as seen below.
The channel can be tailored to each individual, with full control of each percentile represented in the channel. That being said, a general concept is that these clustered areas are clear results of sideways price action, which would lead us to believe that after interactions at these levels, we should expect to see a directional decision made by the market closely after.
🔶 DETAILS
The Rolling VWAP calculation calculates a user-specified number of VWAPs (up to 500), each anchored to a unique starting point in the chart based on the start of a new timeframe.
Each new timeframe that occurs causes a new VWAP to initialize. When the total number of desired VWAPs is reached, the oldest VWAP is removed and re-initialized, anchored to the current bar. Hence, the name " Rolling " VWAPs
This method allows us to automatically generate and manage large amounts of VWAPs without the need for user interaction.
After we have generated these VWAPs, we are able to run analyses on their returned values, such as the "Percentile Linear Interpolation" mentioned in the section above.
🔶 SETTINGS
Anchor Period: Choose which time period to use as the anchor point to initialize new VWAPs from.
VWAP Source: Choose the source for your VWAPs to calculate.
VWAP Amount: Sets the number of VWAPs to use. After this amount is on the chart, the oldest will be rolled.
🔹 Channel Lines
Toggle: Enable the associated VWAP Channel percentile line.
Percentile: Adjust each line's percentile independently for your needs.
Width: Adjust the width of the associated percentile line.
🔹 Calculation
Calculated Bars: Tells the indicator how many bars to calculate on, for faster calculations with less history, use a lower value. Setting this to 0 will remove the bar constraint.
VWAP %BVWAP %B - Volume Weighted Average Price Percent B
The VWAP %B indicator combines the reliability of VWAP (Volume Weighted Average Price) with the analytical power of %B oscillators, similar to Bollinger Bands %B but using volume-weighted statistics.
## How It Works
This indicator calculates where the current price sits relative to VWAP-based standard deviation bands, expressed as a percentage from 0 to 1:
• **VWAP Calculation**: Uses volume-weighted average price as the center line
• **Standard Deviation Bands**: Creates upper and lower bands using standard deviation around VWAP
• **%B Formula**: %B = (Price - Lower Band) / (Upper Band - Lower Band)
## Key Levels & Interpretation
• **Above 1.0**: Price is trading above the upper VWAP band (strong bullish momentum)
• **0.8 - 1.0**: Overbought territory, potential resistance
• **0.5**: Price exactly at VWAP (equilibrium)
• **0.2 - 0.0**: Oversold territory, potential support
• **Below 0.0**: Price is trading below the lower VWAP band (strong bearish momentum)
## Trading Applications
**Trend Following**: During strong trends, breaks above 1.0 or below 0.0 often signal continuation rather than reversal.
**Mean Reversion**: In ranging markets, extreme readings (>0.8 or <0.2) may indicate potential reversal points.
**Volume Context**: Unlike traditional %B, this incorporates volume weighting, making it more reliable during high-volume periods.
## Parameters
• **Length (20)**: Period for standard deviation calculation
• **Standard Deviation Multiplier (2.0)**: Controls band width
• **Source (close)**: Price input for calculations
## Visual Features
• Reference lines at key levels (0, 0.2, 0.5, 0.8, 1.0)
• Background highlighting for extreme breaks
• Real-time values table
• Clean oscillator format below price chart
Perfect for intraday traders and swing traders who want to combine volume analysis with momentum oscillators.

8EMA/VWAP14 Oscillator w/ Trend Exhaustion Bands8EMA/VWAP14 Oscillator w/ Trend Exhaustion Bands + Performance Screener
Introducing the 8EMA/VWAP14 Oscillator with Trend Exhaustion Bands + Screener Suite - a comprehensive trading system that combines trend identification, momentum analysis, and real-time performance tracking all in one indicator. This system features a four-tier signal approach: early momentum warning dots before anything happens, confirmed entry/exit triangles when it's time to act, a dynamic trend ribbon on your price chart, and adaptive exhaustion bands that adjust to each asset's unique characteristics. The built-in performance tracker shows exactly how well your signals are working - success rates, average time to hit targets, and more - providing clear insight for confident trading decisions. Optimized for daily and weekly timeframes, this suite is suitable for both manual traders and automated strategies.
Aim of the Indicator
The 8EMA/VWAP14 Oscillator with Trend Exhaustion Bands is an advanced momentum oscillator system that combines trend identification, momentum analysis, and forward-looking performance validation. This comprehensive tool measures the percentage difference between an 8-period Exponential Moving Average and a 14-period Volume Weighted Average Price while providing multiple layers of signal confirmation through visual trend ribbons, momentum shift alerts, and adaptive exhaustion detection.
How to Interpret the Indicator
Visual Trend System: The indicator displays a dynamic ribbon between the 8EMA and 14VWAP lines on the price chart, automatically colored green when EMA8 is above VWAP14 (bullish trend) and red when below (bearish trend), providing instant trend context.
Four-Tier Signal System:
Tiny Green Dots (Below Bars): Early bullish momentum shifts when the oscillator crosses above its adaptive baseline
Green Triangles (Below Bars): Confirmed buy signals when EMA8 crosses above VWAP14
Tiny Red Dots (Above Bars): Early bearish momentum shifts when the oscillator crosses below its adaptive baseline
Red Triangles (Above Bars): Confirmed sell signals when EMA8 crosses below VWAP14
Oscillator Analysis: The separate pane displays the momentum oscillator with a dynamic zero line (thin blue) representing the recent average EMA8/VWAP14 relationship. Trend exhaustion is detected through adaptive bands - orange for potential upside exhaustion and purple for potential downside exhaustion, calculated dynamically based on the oscillator's historical range relative to its adaptive baseline.
Key Settings and Flexibility
Signal Source Customization: Choose from Open, High, Low, Close, OHLC Average, or HL Average to optimize signal sensitivity for different market conditions and trading styles.
Multi-Timeframe Capability: Enable higher timeframe analysis to use signals from longer periods while trading on shorter timeframes, significantly reducing noise and improving signal quality for more reliable entries.
Dynamic Baseline Controls: Adjust the adaptive zero line calculation period (5-100 bars) - shorter periods provide more responsive momentum detection, while longer periods offer smoother trend context and reduced false signals.
Entry Timing Options: "Bar Opening Only" mode ensures signals trigger only at confirmed bar close using realistic entry prices, eliminating mid-bar noise and providing accurate backtesting results for automated trading systems.
Adaptive Exhaustion Detection: Customize lookback periods and threshold multipliers to fine-tune exhaustion sensitivity for different volatility environments and asset classes.
Comprehensive Performance Tracking: Set custom profit targets (1-50%) and maximum holding periods to analyze forward-looking signal effectiveness with real-time success rate monitoring.
Advanced Features and Benefits
Forward-Looking Performance Analytics: Unlike traditional backtesting, this system tracks how often buy signals reach specified profit targets and measures average time to target, providing immediate validation of signal quality across different assets and timeframes.
Adaptive Baseline Technology: The dynamic zero line automatically adjusts to each asset's unique EMA8/VWAP14 relationship patterns, making momentum signals contextually relevant rather than using static thresholds that may not suit all market conditions.
Professional Entry/Exit Tracking: When "Bar Opening Only" is enabled, all performance calculations use actual tradeable prices (next bar's open) rather than theoretical mid-bar prices, ensuring realistic performance expectations.
Visual Performance Dashboard: Real-time table displaying success rate, average bars to target, fastest/slowest target achievement, and active position tracking with complete transparency about timeframe, signal source, and methodology being used.
Integrated Alert System: Comprehensive alerts for both early momentum shifts and confirmed crossover signals, enabling automated trading integration and timely manual intervention.
Best Practices for Timing Entries and Exits
Entry Timing Strategy:
Watch for Early Warning: Monitor tiny green dots as momentum builds - this is your preparation phase
Confirm with Ribbon: Ensure the ribbon color aligns with your intended direction (green for long positions)
Enter on Triangle Signal: Execute entries when confirmed buy triangles appear, using realistic bar opening prices
Avoid Exhaustion Zones: Be cautious entering when the oscillator is near orange (upper) exhaustion bands
Exit Timing Strategy:
Monitor Momentum Shifts: Red dots above bars provide early warning of potential reversals before actual sell signals
Use Exhaustion Bands: Consider partial profit-taking when oscillator reaches exhaustion zones (orange/purple bands)
Confirm with Sell Signals: Exit positions when red triangles appear, especially if preceded by bearish momentum dots
Time-Based Exits: Utilize the "Max Bars to Target" setting to avoid holding losing positions indefinitely
Risk Management Integration:
Position Sizing: Use success rate metrics to adjust position sizes - higher success rates may warrant larger positions
Multi-Timeframe Confluence: Combine daily signals with weekly context for highest probability setups
Avoid False Signals: Wait for momentum dots before triangles for stronger signal confirmation, reducing whipsaw trades
Optimal Market Conditions:
Trending Markets: Ribbon provides clear directional bias - trade in direction of ribbon color
Range-Bound Markets: Focus on exhaustion bands for reversal opportunities near dynamic support/resistance levels
Volatile Conditions: Use higher timeframe settings to filter noise and focus on more significant moves
Optimal Timeframe Usage
This indicator achieves exceptional performance on Daily timeframes and delivers superior results on Weekly timeframes. Weekly analysis is particularly powerful for position trading and swing strategies, as the adaptive exhaustion bands and momentum shifts have greater statistical significance over extended periods. The ribbon visualization becomes especially valuable on longer timeframes, clearly delineating major trend phases while filtering out intraday noise that can plague shorter-term analysis.
Alternative Applications
Multi-Timeframe Confluence System: Use weekly signals for trend direction while executing entries on daily timeframes, combining the indicator's momentum dots and triangles across different time horizons for high-probability setups.
Automated Trading Integration: The indicator's comprehensive alert system and realistic entry tracking make it ideal for automated trading platforms, with clear signal hierarchy and performance validation built into the system.
Risk-Adjusted Position Sizing: Utilize real-time success rate data and average holding period metrics to dynamically adjust position sizes based on current market effectiveness of the strategy.
Market Regime Detection: The ribbon color changes and exhaustion band interactions help identify when markets transition between trending and ranging conditions, allowing strategy adaptation accordingly.
Performance Validation Tool: Test signal effectiveness across different assets, timeframes, and market conditions before committing capital, using the forward-looking analytics to validate strategy assumptions.
Conclusion
The 8EMA/VWAP14 Oscillator with Trend Exhaustion Bands represents a comprehensive trading system that bridges the gap between manual analysis and automated execution. Its multi-layered approach provides both leading momentum indicators and lagging confirmation signals, while the adaptive baseline technology ensures relevance across different market conditions and asset classes. The integration of visual trend ribbons, performance analytics, and flexible timing controls makes it suitable for both discretionary traders seeking enhanced market insight and systematic traders requiring robust signal validation for automated strategies.

Fallback VWAP (No Volume? No Problem!) – Yogi365Fallback VWAP (No Volume? No Problem!) – Yogi365
This script plots Daily, Weekly, and Monthly VWAPs with ±1 Standard Deviation bands. When volume data is missing or zero (common in indices or illiquid assets), it automatically falls back to a TWAP-style calculation, ensuring that your VWAP levels always remain visible and accurate.
Features:
Daily, Weekly, and Monthly VWAPs with ±1 Std Dev bands.
Auto-detection of missing volume and seamless fallback.
Clean, color-coded trend table showing price vs VWAP/bands.
Uses hlc3 for VWAP source.
Labels indicate when fallback is used.
Best Used On:
Any asset or index where volume is unavailable.
Intraday and swing trading.
Works on all timeframes but optimized for overlay use.
How it Works:
If volume == 0, the script uses a constant fallback volume (1), turning the VWAP into a TWAP (Time-Weighted Average Price) — still useful for intraday or index-based analysis.
This ensures consistent plotting on instruments like indices (e.g., NIFTY, SENSEX,DJI etc.) which might not provide volume on TradingView.

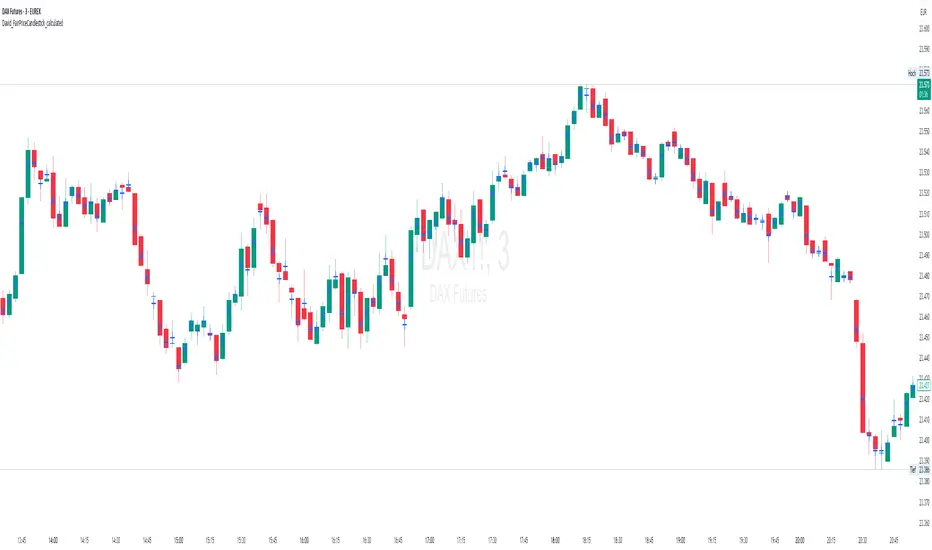
David_FairPriceCandlestick_calculatedDescription:
This indicator displays the "Typical Price" for each candle as a visual marker (cross) directly on the chart. The Typical Price is calculated as the average of the High, Low, and Close values of each bar:
(High + Low + Close) / 3
The marker provides a quick visual reference to the fair or average price level within every single candle.
Unlike a Point of Control (POC) or volume-based indicators, this script works purely with price data and is independent of volume or order flow.
Use cases:
Identify where most trading activity may have been concentrated within the candle (for price-based strategies)
Support as a reference line for mean-reversion or fair value concepts
Works on all timeframes and instruments
Customization:
You can easily change the marker style (cross, dot, triangle, etc.) and color within the script.
Enhanced Zones with Volume StrengthEnhanced Zones with Volume Strength
Your reliable visual guide to market zones — now with Multi-Timeframe (MTF) power!
What you get:
Clear visual zones on your chart — color-coded boxes that highlight important price areas.
Blue Boxes for neutral zones — easy to spot areas of indecision or balance.
Gray Boxes to show normal volume conditions, giving you context without clutter.
Green Boxes highlighting bullish zones where strength is showing.
Red Boxes marking bearish zones where weakness might be in play.
Multi-Timeframe Support:
Seamlessly visualize these zones from higher timeframes directly on your current chart for a bigger-picture view, helping you make smarter trading decisions.
How to use it:
Adjust the box width (in bars) to fit your trading style and timeframe.
Customize colors and opacity to suit your chart theme.
Toggle neutral blue and gray volume boxes on/off to focus on what matters most to you.
Set the maximum number of boxes to keep your chart clean and performant.
Why you’ll love it:
This indicator cuts through the noise by visually marking zones where volume and price action matter the most — without overwhelming your chart. The MTF feature means you’re always aligned with higher timeframe trends without switching views.
Pro tip:
Use these boxes as dynamic support/resistance areas or to confirm trade setups alongside your favorite indicators.
No complicated formulas here, just crisp, actionable visuals designed for clarity and confidence.

Neural Adaptive VWAPNeural Adaptive VWAP with ML Features is an advanced trading indicator that enhances traditional Volume Weighted Average Price (VWAP) calculations through machine learning-inspired adaptive algorithms and predictive volume modeling.
🌟 Key Features:
🧠 Machine Learning-Inspired Adaptation
Dynamic weight adjustment system that learns from prediction errors
Multi-feature volume prediction using time-of-day patterns, price momentum, and volatility
Adaptive learning mechanism that improves accuracy over time
📊 Enhanced VWAP Calculation
Combines actual and predicted volume for forward-looking VWAP computation
Session-based reset with proper daily anchoring
Confidence bands based on rolling standard deviation for dynamic support/resistance
🎯 Advanced Signal Generation
Volume-confirmed crossover signals to reduce false entries
Color-coded candle visualization based on VWAP position
Multi-level strength indicators (strong/weak bullish/bearish zones)
⚙️ Intelligent Feature Engineering
Normalized volume analysis with statistical z-score
Time-series pattern recognition for intraday volume cycles
Price momentum and volatility integration
Sigmoid activation functions for realistic predictions
📈 How It Works:
The indicator employs a sophisticated feature engineering approach that extracts meaningful patterns from:
Volume Patterns: Normalized volume analysis and historical comparisons
Temporal Features: Time-of-day and minute-based cyclical patterns
Market Dynamics: Price momentum, volatility, and rate of change
Adaptive Learning: Error-based weight adjustment similar to neural network training
Unlike static VWAP indicators, this system continuously adapts its calculation methodology based on real-time market feedback, making it more responsive to changing market conditions while maintaining the reliability of traditional VWAP analysis.
🔧 Customizable Parameters:
VWAP Length (1-200 bars)
Volume Pattern Lookback (5-50 periods)
Learning Rate (0.001-0.1) for adaptation speed
Prediction Horizon (1-10 bars ahead)
Adaptation Period for weight updates
📊 Visual Elements:
Blue Line: Adaptive VWAP with predictive elements
Red/Green Bands: Dynamic confidence zones
Colored Candles: Position-based strength visualization
Signal Arrows: Volume-confirmed entry points
Info Table: Real-time performance metrics and weight distribution
🎯 Best Use Cases:
Intraday Trading: Enhanced execution timing with volume prediction
Institutional-Style Execution: Improved VWAP-based order placement
Trend Following: Adaptive trend identification with confidence zones
Support/Resistance Trading: Dynamic levels that adjust to market conditions
