Convergenza/Divergenza di medie mobili (MACD)

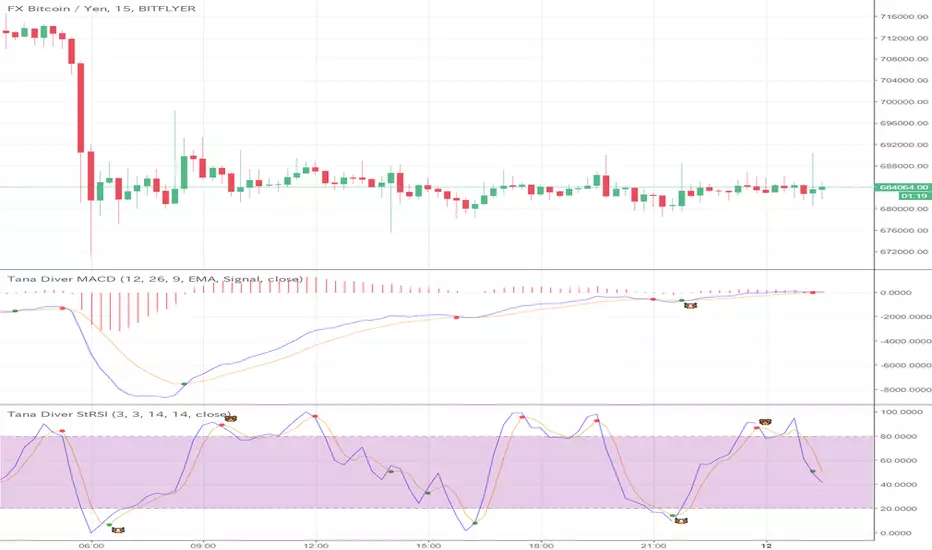
Magicked AsYouWish IMQ ComponentAn AsYouWish component of Inigo Montoya's Quest, dynamic strategy. This is not a stand alone indicator. It is instead designed/skewed to provide MTF MACD-based trade recommendations, immediately following a reversal stop-out. It's suitable for any time frame, from 1 minute to 1+day bars.
Its intended that #1 & #2 TF be set shorter than #3.

MACD Cross AlertWhen MACD crosses Sinal line, arrows are displayed above or below the bar on main chart.
You can also set the following MACD alert with this indicator.
1. When MACD crosses the signal line upwards
2. When MACD crosses the signal line downward
3. When MACD crossed zero line upward
4. When MACD crosses zero line down
MACDのクロスが発生した事を表示します。MACDがシグナルラインを交差すると、ローソク足の上下に、矢印が表示されます。
またこのインジケーターでは以下のMACDのアラートを設定することができます。
1. MACDがシグナルラインを上に交差した時
2. MACDがシグナルラインを下に交差した時
3. MACDがゼロラインを上に交差した時
4. MACDがゼロラインを下に交差した時

MACD CrossOver/CrossUnder Alert ScriptThe script let you know when to sell or buy around MACD indicator.

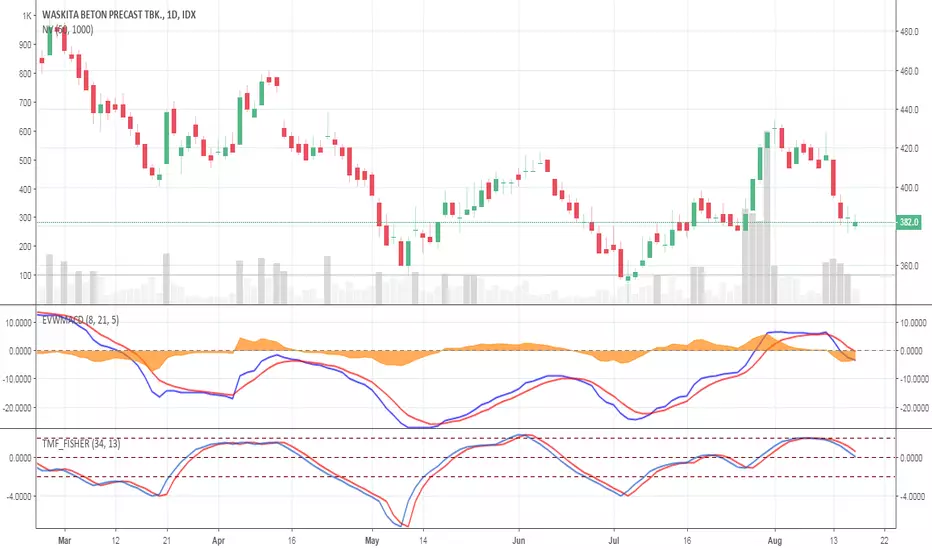
Elastic Volume Weighted MACD ( EVWMACD )The Elastic Volume Weighted MACD is a variation of standard MACD.
The Difference is that this script apply the formula of standard MACD with the Elastic Volume Weighted Moving Average.
I took the formula of EVWMA from public library coded by LazyBear.
I use EVWMACD as a trend confirmation indicator.
Just tune all lengths and parameters according to your instruments
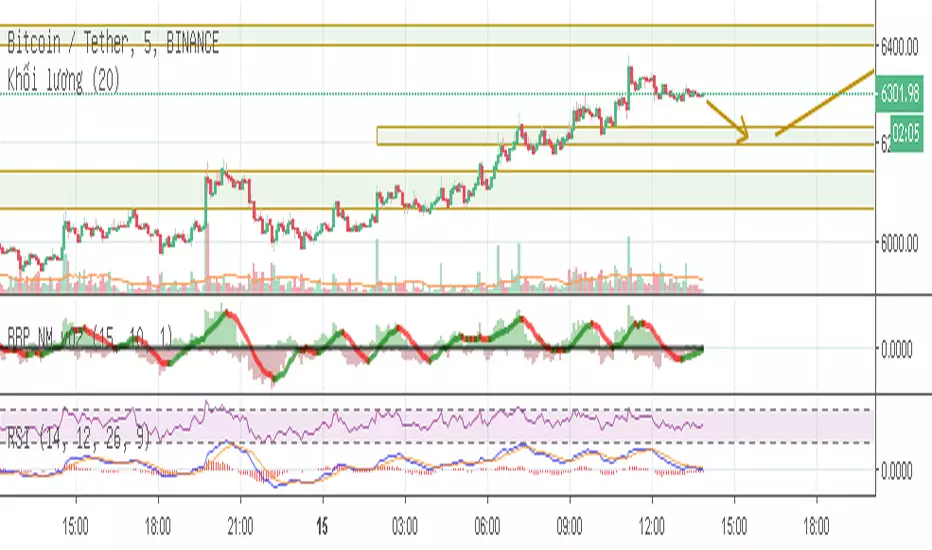
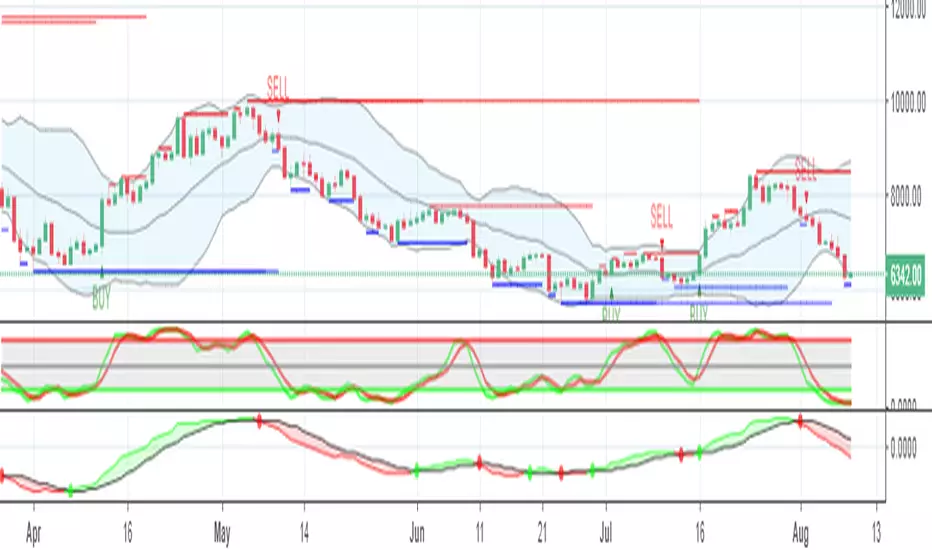
MACD for Buy & Sell signal indicatorMACD for Buy & Sell signal indicator last part of Buy and sell signal set. It was coded base on CCI source. Allow trader can read volume trade on market
1 set buy and sell signal
1- Buy & Sell signal indicator
2- RSI for Buy & Sell signal indicator
3- MACD for Buy & Sell signal indicator
*********************************************************************************************************************
Gửi anh chị trader đây là chỉ báo cuối cùng trong bộ chỉ báo tín hiệu mua bán. Là chỉ báo điều kiện sử dụng cùng với chỉ báo RSI để giúp cho nhà đầu tư đưa ra quyết định kịp thời dựa trên tổng số khối lượng gd thời điểm hiện tại

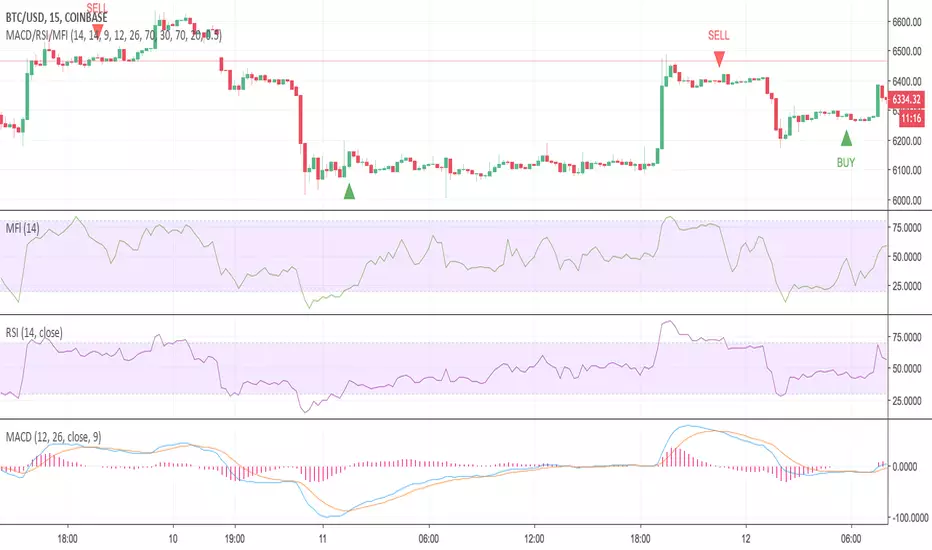
MACD/RSI/MFI with AlertsThis indicator allows you to trade RSI and MFI oversold and overbought zones with MACD confirmation. It is also possible to take an early trade by checking the " delta " (difference between the fast MACD line and the signal line) (histogram) value of the MACD.
Buy Condition
Both RSI and MFI must be in the oversold area
After that, wait for a MACD crossover
Note: At the time of MACD crossover, RSI and MFI might not still be in the oversold area. The indicator knows that they were both in the oversold area, and then waits for a MACD crossover to happen to confirm an uptrend.
Sell Condition
Both RSI and MFI must be in the overbought area
After that, wait for a MACD cross-under
Note: At the time of MACD cross-under, RSI and MFI might not still be in the overbought area. The indicator knows that they were both in the overbought area, and then waits for a MACD cross-under to happen to confirm a downtrend.
Inputs
MFI Length: Length of the Money Flow Index
RSI Length: Length of the RSI
MACD Length: Length of the MACD
MACD Fast Length: Fast Length of the MACD
MACD Slow Length: Slow Length of the MACD
RSI Overbought: Overbought boundary of the RSI
RSI Oversold: Oversold boundary of the RSI
MFI Overbought: Overbought boundary of the MFI
MFI Oversold: Oversold boundary of the MFI
Use delta to trade early?: Use this if you want to take a trade early by checking the MACD histogram
Delta: Absolute value of the MACD histogram. Whenever the "MACD Histogram" is less than the given "delta", a trade will be triggered if possible
Feel free to ask any questions you have.
Please report any bugs you found, with a screenshot of the chart. You can leave a comment or send me a DM.
Moving Average Convergence/Divergence LineMACD Line instead of MACD histogram or area. This gives more opportunities to catch divergences.
I showed regular MACD Histogram on top and then this indicator on bottom and showed with the red and green lines where you could catch multiple bearish and bullish divergences using this indicator vs a regular MACD histogram.
Send me a private message to join my trading group.
Thank you.


VMACD IndicatorVolume-Weighted MACD Indicator. You can turn volume-weighted off to get "regular" MACD, and you can change the scaling of the histogram to make it stand out more.

MACD/Histogram Divergence ToolThis MACD/Histogram indicator helps me to identify divergences and crosses without much effort.
The MACD line is green during a positive cross, and red during a negative.
My favourite feature is the following: when the histogram changes direction, the histogram bars become yellow, which should help you locate divergences without straining yourself.
Example: Upticking (Green) histogram begins to downtick, turns Yellow. Downticking (Red) histogram begins to uptick, turns Yellow as well.

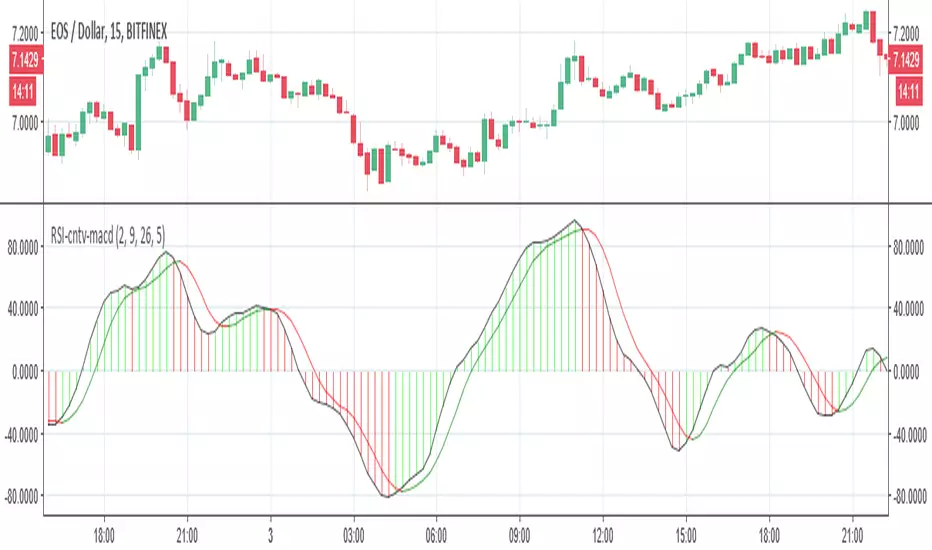
RSI-cumulative net volume as MACDSo here in this model I take the RSI-cumulative net volume and convert it to MACD
I think it look nicer then original but it just idea:)
for different time frame just change setting:)