SynthSAR ConfirmationThis indicator represents confirmation of a trend based on the PSAR indicator and includes signals from the MACD, stochastic oscillator, and awesome oscillator. It displays the points of the parabolic SAR on the chart, which help determine the direction of the trend. Additionally, the indicator allows for tracking signals based on the combined analysis of three other technical indicators: MACD, stochastic oscillator, and awesome oscillator. Furthermore, the indicator includes the ability to display buy/sell labels and signals for changing the trend direction. This is not an investment recommendation.Very effective in higher timeframes.If the MACD "macd line" crosses the "signal line" from above and the Stochastic %K line crosses the %D line from above, and the last column in the Avesome Oscillator is red, then the indicator gives a signal to sell. If the MACD "macd line" crosses the "signal line" from below and the Stochastic %K line crosses the %D line from below, and the last column in the Avesome Oscillator is green, then the indicator gives a signal to buy.
Macdivergence

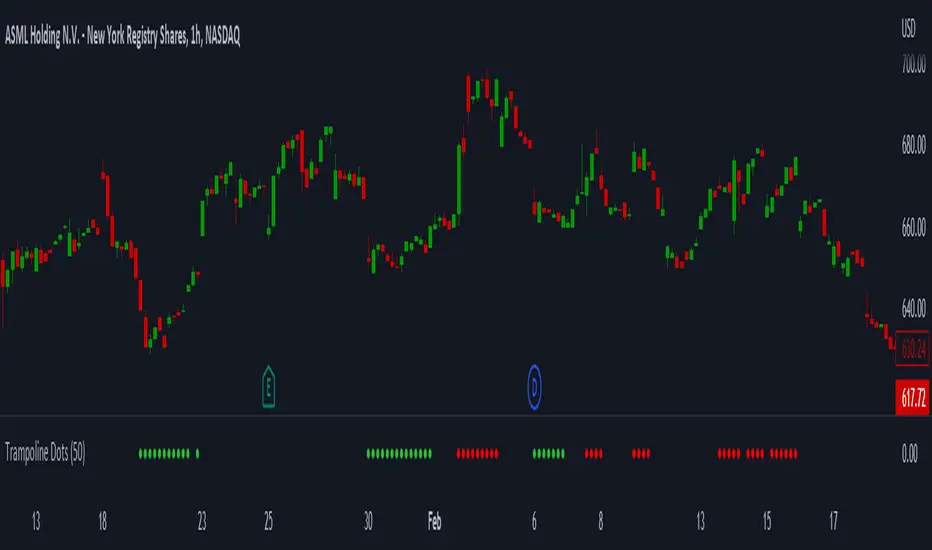
Trampoline DotsTrampoline Dots (Price Divergence)
Higher Time Frame Price Divergence:
Trampoline Dots serve as a "quick bounce" tool. These little dots will trigger whenever the higher aggregation MACD is above / below zero and the price is below / above the 50 period simple moving average. When these criteria are met, the price is usually under pressure of strong divergence, more often than not price will sharply reverse into the trend direction usually within the next few bars.
The Use of The Trampoline Dots:
This indicator can serve multiple ways. Obviously the main use case is the price divergence. These "dots" will not give you any precise & exact entry. But rather a zone of possible incoming reversal. There is no timing to it. All these dots will do is warn you about potential sharp reversal in the upcoming bars. It can be used by itself alone for sure, but the best way to utilize the dots is to use them in combination of other trend or momentum studies. The best signals are the ones that are within the larger time frame trend. Another great thing is that the visuals are really straight-forward and simple. It is either green dot or a red dot. Nothing more, nothing less. Also since the indicator is pretty small, it can be easily layered onto other studies as well which can create an additional confirmation for different patterns or setups.
Which Time Frame Are Reliable?
This indicator works on any time frame. But the most "stable" one is the daily & hourly time frame. My personal favorite is the hourly since these divergences can produce amazing entries in the daily trends (which are usually hidden on the daily chart). In the most aggresive trends, I like to see the green dots triggering around the 8 EMA and 13 EMA. Daily chart can show the daily and weekly (big divergences) that can take multiple days & weeks to resolve.
Hope it helps.
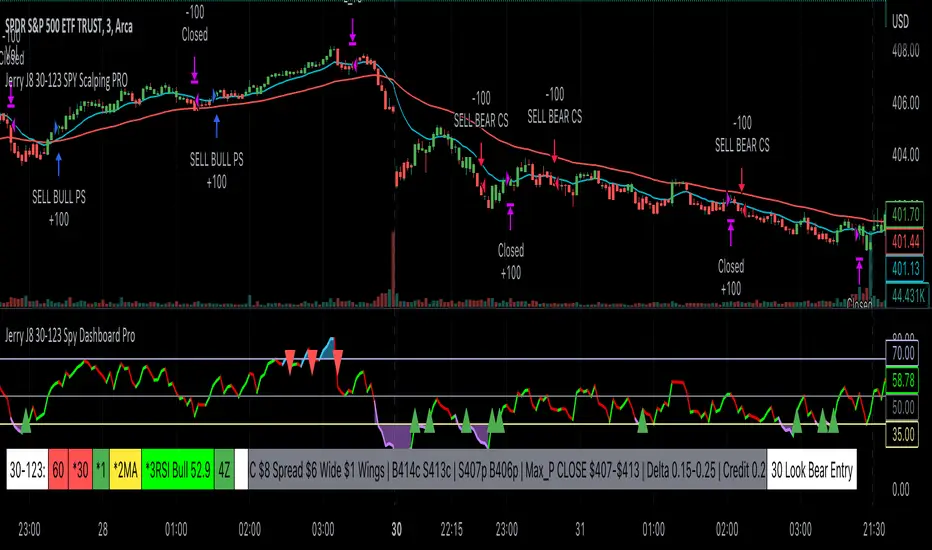
Jerry J8 30-123 Spy Dashboard ProPlease watch the J8 Scalping Tutorial Video below for a walkthrough on how these indicators work.
This script is used in conjunction with Jerry J8 30-123 SPY Scalping PRO” Indicator(which creates the buy and sell orders as a strategy). The Dashboard shows the 4 main criteria statuses from the strategy. I find the dashboard makes scalping the SPY much easier.
This study project is designed for scalping options that expire daily with bull put and bear call credit spreads on a 3 minute chart. The name 30_123 is a reference to 4 main criteria being met to give a green light for a potential trade. The criteria:
* 30 = 30 minute trend
* 1 = 3 minute trend
* 2 = Moving average criteria
* 3 = RSI criteria
4 = Secondary trend. Bonus if in sync but not a requirement.
* The strategy also utilizes momentum as a criteria but this is not shown on the dashboard.
This indicator is designed to trade options that expire daily including the SPY, IWM, QQQ, and NDX. However, it can be used with multiple symbols on a 3 minute chart.
When the 30_123 conditions are all green with all criteria are met a bull signal is created.
When the 30_123 conditions are all red with all criteria are met a bear signal is created.
This study is the dashboard that is designed to show how the main J8 strategy indicator is working and it shows which criteria have been met. Additionally there are multiple user INPUTS that you can adjust for the 4 main criteria plus inputs to help you with your credit spread criteria.
For example, if the SPY is at 400 we could have an order to sell a BULL PUT CREDIT SPREAD and I would likely sell the 398p and buy the 397p; The 398p delta would be approximately -.2. The spread position profits with any close over 398 and/or can be closed early with a bullish price move. IMPORTANT: If the SPY closed the day at $399 on the chart it would look like a loss based on the buy and sell orders but the spread would be a full profit since the close was above 398.
---- IRON CONDOR
For the SPY ticker only an iron condor label is generated when the SPY is trading sideways and meets specified criteria. When the criteria is met the Iron Condor label appears and it provides a recommendation for what option to buy and sell. The iron condor recommendations can be adjusted with user inputs.
This Indicator dashboard shows the criteria labels and colors the criteria as green if bullish and red if bearish. When the criteria are not met the dashboard shows “NO CLEAR SIGNAL”. There is also a label that shows whether you are looking for bullish or bearish positions based on the 30 minute trend.
The chart shown on the indicator is the RSI and for this indicator an RSI over 50 is bullish and under 50 is bearish. The line color shows the RSI trend. RSI OB (overbought) and OS (oversold) areas are shaded. The RSI can remain in an OB or OS state for a prolonged period and while some people use OB and OS as a reversal signal I use it as a strong trend indication and recognize it will not last forever. You can SET the OB and OS levels with inputs.
---- USER INPUTS
Paint Bars: Turns on/off the candle coloring. Default is OFF.
Iron Condor Settings: Defaults are what I use and can be used as a guide.
Criteria: Trend, moving averages, and RSI settings can all be adjusted.
---- SETUP & HINTS
Add "Jerry J8 30-123 SPY Scalping PRO” indicator to show bull and bear signals
Add "Jerry J8 MACD Optimal Entry Zone” indicator to show best MACD range for entry
I also like to add "Jerry Momentum Dream" indicator to see the momentum
With this indicator we’re looking for the 30, 1, 2, and 3 criteria to be met which increases our likelihood of success. IMPORTANT. Never automatically enter a position without reviewing the other indicators and drawing your own conclusions. You want to choose the entries that are the most appealing to you that take into account volume, time of day, and risk/reward. Positions should be closed based on your risk/reward goals.
Indicators are not a magic pill and should be used to support trading decisions, not to make them for you. Past performance is not a guarantee of future returns. The results of individual stocks/indexes with any strategy do not constitute proof they will repeat in the future.
DISCLAIMER: The information contained in our scripts/indicators/ideas does not constitute financial advice or a solicitation to buy or sell any securities of any type. Trading and investing in the stock market and cryptocurrencies involves substantial risk of loss and is not suitable for every investor. I’m NOT a financial adviser. All trading strategies are used at your own risk.
Please Use the AUTHOR’s INSTRUCTIONS link below for more information.
NOTE: The PERFORMANCE SUMMARY below does not accurately reflect the trading strategy because the entry orders generated in the strategy are based on the stock price and our actual order is a credit spread that is profitable even if the price moves against us a little bit. What could show as a loss in the strategy could be a profit in the credit spread.

Jerry J8 30-123 SPY Scalping PROPlease watch the J8 Scalping Tutorial Video below for a walkthrough on how these indicators work.
---- STRATEGY
This study project is designed for scalping options that expire daily with bull put and bear call credit spreads on a 3 minute chart. The name 30_123 is a reference to 4 main criteria being met to give a green light for a potential trade. The 4 main criteria:
*30 = 30 minute trend
*1 = 3 minute trend
*2 = Moving average criteria
*3 = RSI criteria
4 = Secondary trend. Bonus if in sync but not a requirement.
* The strategy also utilizes momentum as a criteria.
This indicator is designed to trade options that expire daily including the SPY, IWM, QQQ, and NDX.
When 30_123 conditions are all green and all criteria are met a bull signal is created.
When 30_123 conditions are all red and criteria are met a bear signal is created.
The bull and bear signals are based on the stock/index price; BUT the actual orders are for option spreads that are normally based on a delta of approximately .15 to .25.
For example, if the SPY is at 400 we could have an order to sell a BULL PUT CREDIT SPREAD and I would likely sell the 398p and buy the 397p; The 398p delta would be approximately -.2. The spread position profits with any close over 398 and/or can be closed early with a bullish price move. IMPORTANT: If the SPY closed the day at $399 on the chart it would look like a loss based on the buy and sell orders but the spread would be a full profit since the close was above 398.
This script is used in conjunction with Jerry J8 30-123 Spy Scalping Dashboard Pro indicator which is the dashboard to give a visual for the 4 main criteria and makes things easier to understand.
---- TRADING TIME FRAME
The default time frame is 10:00 - 15:57 and can be controlled by the user. I do not enter trades in the first 30 minutes since that can be a very volatile period and you can easily configure the indicator and trading time frame based on how you trade.
---- MAJOR USER INPUTS
Paint Bars: Turns on/off the candle coloring for the trend
Exits: Open orders can be closed with 3 different exit criteria and all should be left on. These exits are needed to provide multiple entry signals throughout the day. However, you want to close the spreads based on your own criteria and not on the indicator.
Criteria: Trend, moving averages, RSI settings, and trading time frames can all be adjusted.
---- SETUP & HINTS
Add "Jerry J8 30-123 Spy Scalping Dashboard Pro” indicator to show J8 criteria dashboard
Add "Jerry J8 MACD Optimal Entry Zone” indicator to show best range of entry
I also like to add "Jerry Momentum Dream" indicator to see the momentum
With this indicator we’re looking for the 30, 1, 2, and 3 criteria to be met which increases our likelihood of success. IMPORTANT. Never automatically enter a position without reviewing the other indicators and drawing our own conclusions. You want to choose the entries that are the most appealing to you that take into account volume, time of day, and risk/reward. Positions should be closed based on your risk/reward goals.
Indicators are not a magic pill and should be used to support trading decisions, not to make them for you. Past performance is not a guarantee of future returns. The results of individual stocks/indexes with any strategy do not constitute proof they will repeat in the future.
DISCLAIMER: The information contained in our scripts/indicators/ideas does not constitute financial advice or a solicitation to buy or sell any securities of any type. Trading and investing in the stock market and cryptocurrencies involves substantial risk of loss and is not suitable for every investor. I’m NOT a financial adviser. All trading strategies are used at your own risk.
Please Use the AUTHOR’s INSTRUCTIONS link below for more information.
NOTE: The PERFORMANCE SUMMARY below does not accurately reflect the trading strategy because the entry orders generated in the strategy are based on the stock price and our actual order is a credit spread that is profitable even if the price moves against us a little bit. What could show as a loss in the strategy could be a profit in the credit spread.
Volume Cross ━ (For Volume Crop) [whvntr]This fulfills a request from user: iTibu to make an oscillator to go along with one of my indicators named: " Volume Crop ━ Hidden Volume Divergence ". It essentially does the same thing, without the Midline Tool , so you can better understand where the crosses are happening. Again, the hidden MACD Divergence circles formula originated from TheLark. I converted these values to volume instead of price.
Disclaimer: using this indicator, or any indicator anywhere, involves risk when trading and isn't a guarantee of 100% accurate results.

Super 8 - 30M BTCWelcome to Super 8, the ultimate automatic trading script for Pine!
This bad boy is designed to go both long and short, and it's equipped with all the tools you need to maximize your profits. Whether you're looking to take profit, set a trailing stop, or protect yourself with a stop loss, Super 8 has you covered.
But that's not all! Super 8 is also loaded with 8 powerful indicators to help you make informed decisions. We've got the EMA, ADX, SAR, MACD, VOLUME, BOLLINGER BANDS, DONCHIAN, and ATR all working together to give you the best possible trading experience.
And if you want to take it to the next level, Super 8 also has a feature that lets you use stepped entries in normal mode or incremental 1,2,3,... to improve your average price. Plus, if you're using trailing stop, you can activate the Backtest precision to use lower timeframes.
But what's in a name? Super 8 is called that because it's just that... super! It's tailored specifically for the OKX:BTCUSDT.P pair, so you know you're getting the best possible results. it's highly adjustable and can be used with any other pair. So no matter what market you're trading in, Super 8 has got you covered.
So if you want to level up your trading game, give Super 8 a try. You won't be disappointed.
Certain Risks of Live Algorithmic Trading:
Backtesting Cannot Assure Actual Results.
The relevant market might fail or behave unexpectedly.
Your broker may experience failures in its infrastructure, fail to execute your orders in a correct or timely fashion or reject your orders.
The system you use for generating trading orders, communicating those orders to your broker, and receiving queries and trading results from your broker may fail.
Time lag at various point in live trading might cause unexpected behavior.
The systems of third parties in addition to those of the provider from which we obtain various services, your broker, and the applicable securities market may fail or malfunction.

MACD Optimizer Pro [Kioseff Trading]Massive update! This script now includes 12 different moving averages and 30+ built-in technical indicators to enhance your trading strategy optimization! (:
This script (MACD Optimizer Pro) allows the user to optimize and test hundreds of MACD strategies, simultaneously, in under 40 seconds. Of course, theoretically, an unlimited number of trading strategies can be tested with the MACD Optimizer Pro. After the optimization period - the MACD Optimizer Pro will show the most profitable MACD strategy or, should you choose, the highest win-rate MACD strategy or the most-efficient MACD strategy!
Optimization results can be backtested and verified using the native TradingView backtester - which is included in the MACD Optimizer Pro - and made easy to use! This feature makes settings alerts a simple practice!
Features
Test hundreds of MACD strategies, simultaneously, in under 40 seconds.
Optimize long MACD strategies and short MACD strategies.
12 different built-in moving averages included to improve your MACD strategy.
30+ built-in technical indicators to improve your MACD strategy.
Runs as a strategy script - profit factor, PnL , win-rate, number of trades, max drawdown, equity curve and other pertinent statistics shown.
Alerts
Optimize any MACD setting
Profit targets, trailing stops, fixed stop losses, and a binary MACD strategy can all be tested.
Strategies can be optimized for highest win rate, highest net profit, most efficient profit.
Limit orders can be simulated.
External indicators can be used for optimization i.e. your own, custom-built indicator, an indicator from your favorite author, or almost any publicly available
TradingView indicator.
Date range for optimization and backtesting are configurable.
Explanation
The image above shows a list of configurations for the optimizer. You can
You can test hundreds of different MACD settings in under 40 seconds on any timeframe, asset, etc.
The image above shows additional settings to filter the outcome of your optimization testing. Additionally, you can test an unlimited number of profit targets and stop losses!
You can add one of several built-in TradingView indicators to filter trade entries.
The image above shows all built-in moving averages and TradingView indicators that can be incorporated into your MACD strategy.
Additionally, you can add your own, custom indicator to the optimization test, your favorite indicator by your favorite author or almost any publicly available indicator on TradingView.
The image above shows the settings section in which you can implement this feature.
The image above shows an example of the custom indicator feature! In this instance, I am using the public indicator titled "Self-Optimizing" RSI and requiring it to measure below a level prior to entry! Almost any custom indicator, your favorite indicator, etc. is compatible with this feature!
The MACD Optimizer has improved user friendliness over previous versions. The optimizer can be as simple or complex as you'd like - capable of handling both "easy" and "difficult" tasks at your discretion.
Additionally, you can configure the optimizer to prioritize MACD strategies that earn profit most efficiently!
The image above shows this feature in action.
You can also configure the optimizer to prioritize MACD strategies that achieve the highest win rate!
The image above shows this feature in action.
Instructions
The instructions below show a rudimentary approach to using the optimizer.
1. Build your strategy in the settings.
You should also disable the "Run a Backtest" feature to improve load times during optimization.
The image above shows my custom strategy settings.
Now that you've got some data on your chart - you should try "Freezing" the "Smoothing" setting for MACD . When doing this, the optimizer will test hundreds of MACD settings with a fixed "Smoothing" setting. Try using the best "Smoothing" setting you were able to find for your initial testing.
2. Take the best "Smoothing" setting and test various MACD and Signal Lengths.
The image above shows me configuring the MACD Optimizer to test different MACD line lengths and Signal line lengths with a fixed "smoothing" setting.
From the results, we can see that there are better MACD settings than what was shown in our initial test!
With this information we can execute a TradingView backtest.
3. Execute a TradingView Backtest.
You must enable the "Run a Backtest" feature to perform a TradingView backtest. Additionally, it's advised to enable the "STOP OPTIMIZATION" feature when performing a TradingView backtest. Enabling this feature will improve load times for the backtest to only a few seconds (since the optimizer won't look for the best setting when this feature is enabled).
The image above shows completion of the process!
From here, you can perform further testing, set alerts, etc.
Backtest Settings Shown
Initial Capital: The initial capital used for the shown backtests is $3,500 USD. Set the initial capital to replicate your true starting capital (: PnL for the MACD strategies (listed in table) is calculated using a starting capital of $10,000 USD.
Slippage: The slippage settings for the displayed backtest was set to 2 ticks.
Commission: Commission was adjusted to 0.1%.
Verify Price for Limit Orders was set to 2 ticks.
Optimization
Trading system optimization is immensely advantageous when executed with prudence.
Technical-oriented, mechanical trading systems work when a valid correlation is methodical to the extent that an objective, precisely-defined ruleset can consistently exploit it. If no such correlation exists, or a technical-oriented system is erroneously designed to exploit an illusory correlation (absent predictive utility), the trading system will fail.
Evaluate results practically and test parameters rigorously after discovery. Simply mining the best-performing parameters and immediately trading them is unlikely a winning strategy. Put as much effort into testing strong-performing parameters and building an accompanying system as you would any other trading strategy. Automated optimization involves curve fitting - it's the responsibility of the trader to validate a replicable sequence or correlation and the trading system that exploits it.
Thanks for checking this out!
Script a pagamento

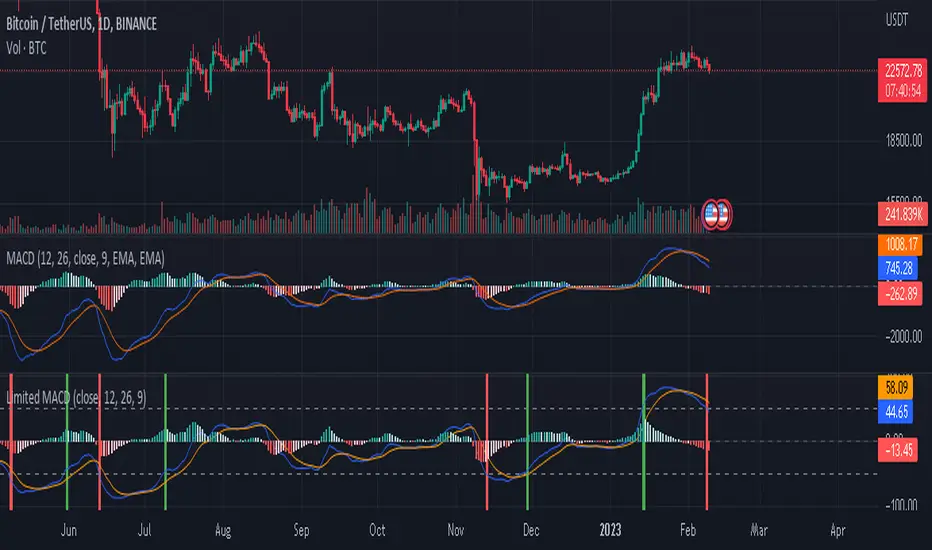
Limited MACDwhat is "Limited MACD"?
it is macd but it has some useful additional features.
what it does?
it takes limited values ??just like rsi. The highest value it can take is 100 and the lowest value is -100. this way it gets the same highs and lows for different symbols and time slots. which means we can set overbought and oversold values ??with it. he also paints candles according to their values. The closer the price is to the oversold values, the more red, and the closer to the overbought values, the greener.
how it does it?
macd values ??are limited by dividing by extreme values. The macd value is used as the variable for the color.rgb function, this is used to get a different color for each macd value.
how to use it?
The variables in the settings section are the same as standard macd.
Use the colors to identify overbought and oversold zones and to predict possible price reversal points. also the indicator will mark possible turning points. other than that, its use is similar to standard macd and its limits are up to your imagination.
four hour:
one hour:
five minute:
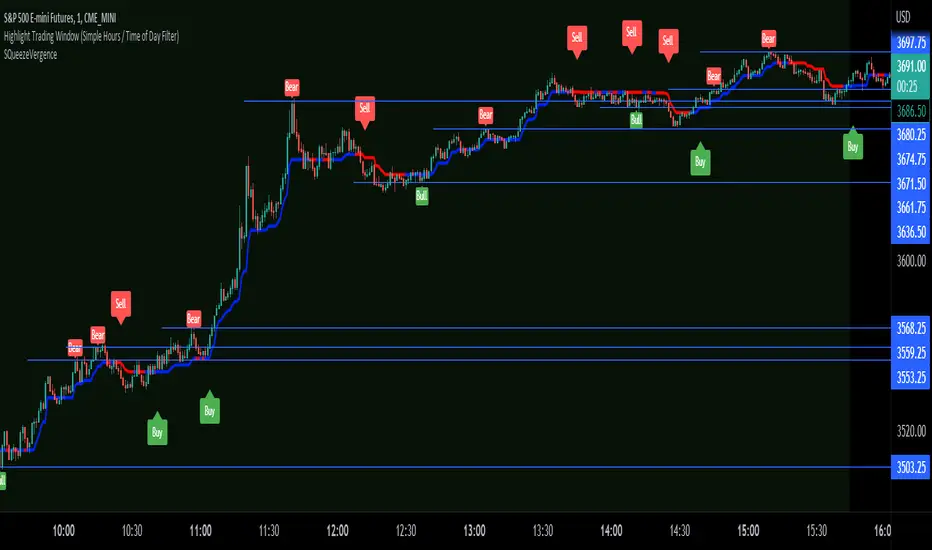
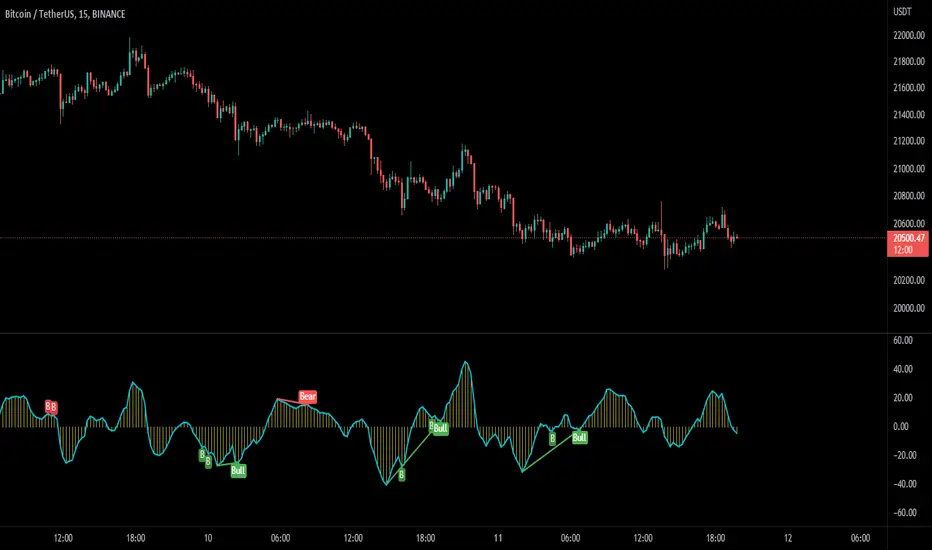
SQueezeVergenceThis is my SQueezeVergence indicator. It fires Buy and Sell signals based on squeeze momentum and trend. **It also creates Bull and Bear signals based on MACD divergence which should only be used as areas of support and resistance being as these signals repaint based on a 5 candle look back of pivots.** All settings are editable for better use. The default settings are what I use on the 1 Minute chart of ES to scalp. This is a simple indicator to help me get alerts on when I need to scalp. The divergence signals work well for areas of significance. I like to watch for breaks of these levels along with support and resistance. I hope this helps.
TomSeb StrategyRSI & MACD based. The parameters can be fine tuned to suit the symbol. 0 and 2 are default parameters which work for most symbols.


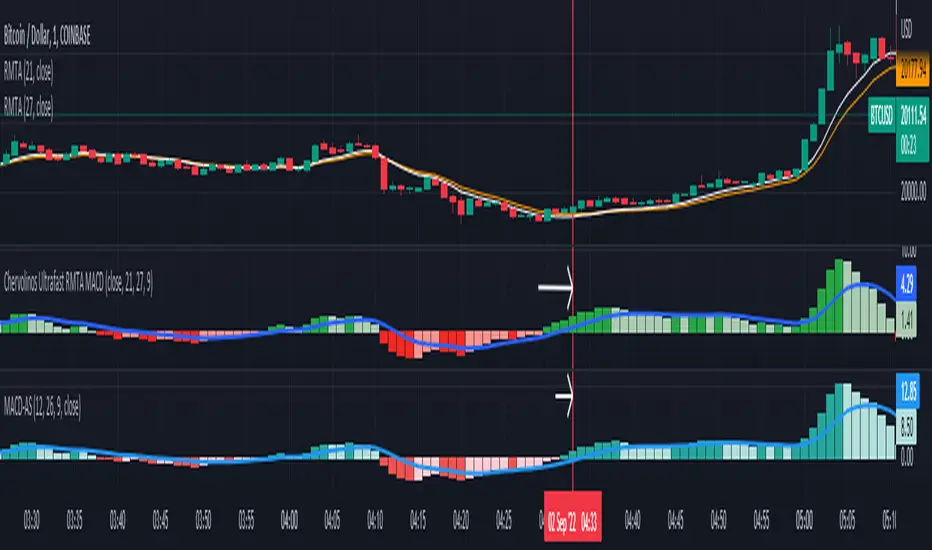
Chervolinos Ultrafast RMTA MACDDescription of a classic MACD:
MACD, short for moving average convergence/divergence, is a trading indicator used in technical analysis of stock prices, created by Gerald Appel in the late 1970s. It is designed to reveal changes in the strength, direction, momentum, and duration of a trend in a stock's price. The MACD indicator (or "oscillator") is a collection of three time series calculated from historical price data, most often the closing price. These three series are: the MACD series proper, the "signal" or "average" series, and the "divergence" series which is the difference between the two. The MACD series is the difference between a "fast" (short period) exponential moving average (EMA), and a "slow" (longer period) EMA of the price series. The average series is an EMA of the MACD series itself. The MACD indicator thus depends on three time parameters, namely the time constants of the three EMAs. The notation "MACD" usually denotes the indicator where the MACD series is the difference of EMAs with characteristic times a and b, and the average series is an EMA of the MACD series with characteristic time c. These parameters are usually measured in days. The most commonly used values are 12, 26, and 9 days, that is, MACD. As true with most of the technical indicators, MACD also finds its period settings from the old days when technical analysis used to be mainly based on the daily charts. The reason was the lack of the modern trading platforms which show the changing prices every moment. As the working week used to be 6-days, the period settings of represent 2 weeks, 1 month and one and a half week. Now when the trading weeks have only 5 days, possibilities of changing the period settings cannot be overruled. However, it is always better to stick to the period settings which are used by the majority of traders as the buying and selling decisions based on the standard settings further push the prices in that direction.
Description of the new Ultrafast RMTA MACD:
Ultrafast RMTA MACD, short for moving average convergence/divergence, is a trading indicator used in technical analysis of stock prices, created by Chervolino. It is designed to reveal changes in the strength,
direction, momentum, and duration of a trend in a stock's price. The RMTA MACD indicator (or "oscillator") is a collection of three time series calculated from historical price data, from the closing price.
The RMTA MACD based on the THE RECURSIVE MOVING TRENDLINE SYSTEM technical.traders.com
and is series is the difference between a "fast" (short period) Recursive Moving Trend Average, and a "slow" (longer period) Recursive Moving Trend Average of the price series. The average series is an EMA of the MACD series itself.
The result is a non laging indicator, depends on the settings.
special thanks to
everget
LonesomeTheBlue
MACD Divergence low repaintjiuc:
jiuc:
This MACD Divergence indicator can show your more acurrate divergence. It won't show you the divergence if the signal lines or MACD lines had crossed the zero line during the price get lower lower and macd get higher higher etc.
Used two range to calculate divergence. which can provide more divergence signals.

MACD + RSI with Trade SignalsThis indicator by default comes with the MACD shown but can be switched to show the RSI instead. Settings for each indicator can also be customized as well as Buy/Sell signals given based on pull back crossovers that follow the 200 EMA of the price Chart. There's an above/below middle fill option you can use but I tend not to but I know some traders like to see when an oscillator is above/below the middle and use it as a trend diretion. By the way, the fourth setting for the MACD (which is 2 by default) is the size of the histogram.
Buy Signal = Price is above the 200 EMA. Current or previous MACD or RSI line is/was below middle line and now crossed above the signal line.
Sell Signal = Price is below the 200 EMA. Current or previous MACD or RSI line is/was above middle line and now crossed below the signal line.
There are alerts for each signal as well (MACD and RSI, both buy and sell).
Feel free to leave a comment regarding issues or suggestions for this indicator or ideas for the next one I should do :)

MACD DEMA by ToffMACD DEMA by Toff
converted to version 5
Changed Histogram formatting
Changed MACD plot to indicate macd direction change
//@version=5
//by ToFFF converted to version 5, changed histogram formating changed macd plot to show macd direction changed with lighter color
indicator('MACD DEMA', timeframe = "", timeframe_gaps=true)
sma = input(12,title='DEMA Short')
lma = input(26,title='DEMA Long')
tsp = input(9,title='Signal')
lines = input(true,title="Lines")
col_grow_above = input(#26A69A, "Above Grow", group="Histogram", inline="Above")
col_fall_above = input(#B2DFDB, "Fall", group="Histogram", inline="Above")
col_grow_below = input(#FFCDD2, "Below Grow", group="Histogram", inline="Below")
col_fall_below = input(#FF5252, "Fall", group="Histogram", inline="Below")
col_macd = input(#2962FF, "MACD Line ", group="Color Settings", inline="MACD")
col_signal = input(#FF6D00, "Signal Line ", group="Color Settings", inline="Signal")
col_macd_i = #0000FF
col_macd_d = #66FFFF
slowa = ta.ema(close,lma)
slowb = ta.ema(slowa,lma)
DEMAslow = ((2 * slowa) - slowb)
fasta = ta.ema(close,sma)
fastb = ta.ema(fasta,sma)
DEMAfast = ((2 * fasta) - fastb)
MACD = (DEMAfast - DEMAslow)
signala = ta.ema(MACD, tsp)
signalb = ta.ema(signala, tsp)
signal = ((2 * signala) - signalb)
hist = (MACD - signal)
//swap1 = MACDZeroLag>0?green:red
plot(hist,style=plot.style_columns, color=(hist>=0 ? (hist < hist ? col_grow_above : col_fall_above) : (hist < hist ? col_grow_below : col_fall_below)),title='HIST')
p1 = plot(lines?MACD:na,style = plot.style_line, color=(MACD < MACD) ? col_macd_i : col_macd_d , linewidth =3,title='MACD')
p2 = plot(lines?signal:na, color=col_signal, linewidth =2,title='Signal')
hline(0)

MACD Potential Divergence - FontiramisuIndicator showing potential momentum divergences on MACD Momentum.
The problem with the classic divergence is that when the signal appears, it is sometimes too late to enter a trade .
The potential divergence corrects this problem by signaling the beginning of a potential divergence .
MACD is a momentum indicator that offers relevant insights with divergences.
Potential divergences are indicated with the letter B and a red color for Bearish Div or Green color for Bullish Div .
Potential divergence is confirmed when the line and the label "Bear"' or "Bull" appear.
BenMACD Wilders LTF ScriptSo the script... some details!
What I've created is a MACD Wilders based study. By using this study, in TradingView you can take guesswork out of the "curls" and "I think it's curling up? Let me check the blue line and subtract...". Screw all that. It alerts you with big red arrows and big green arrows, and a banner and a message. And it makes sounds. Alert for bullish and a different sound for bearish.
It also has a confirmation component.
If you don't think it's worth it I'll gladly refund your $. I also help you set it up and answer any questions you have.

MACD Volume S2 By Gammaprod>> How to use this indicator :
1. Set your teadingview theme to dark theme.
2. My indicator is valid for forex, stock and but more valid for crypto.
3. Use three timeframe for more validation (choose between those, that fit to your trading style) :
- Timeframe 1m, 5m, and 15m for Scalping
- Timeframe 30m, 1h and 4h for Intraday
- Timeframe 4h, 1D and 1W for Swing Trading
4 . Always use THREE INDICATORS FROM GAMMAPROD, those three indicators is back to back each other, by the way, I only made those three indicators only (for now) :
- Trendlines Boll Ichi Crypto by Gammaprod
- Stoch RSI Divs Zone Crypto by Gammaprod
- MACD Volume Crypto by Gammaprod
>> How to setting :
1. Trendlines Boll Ichi Crypto by Gammaprod
A. Support and Resistence
- Well if you familiar with this indicator you can add it, but recommended for Timeframe 30m or more
B. Trendlines Primary or Trendlines Secondary
- Timeframe 1m you DON'T NEED Trendlines Primary or Trendlines Secondary
- Timeframe 5m you DON'T NEED Trendlines Secondary, but you CAN ADD Trendlines Primary if you fell it helpful (for me, it is helpful to find where the candles start or the end trend or a consolidation or where the candles will surpass a resistance or a support).
- Timeframe 15m you DON'T NEED Trendlines Secondary, DEFENITELY add Trendlines Primary it will help to find where the candles stop or a consolidation or where the candles will surpass a resistance or a support).
- Timeframe 30m or more, DEFENITELY NEED BOTH Trendlines Primary and Secondary Trendlines, it will help to find where the candle stop or consolidation or where the candle will surpass a resistance or support).
C. Bolinger, Ichimoku Cloud and Lagging Span
- Please DON'T CHANGE IT at all, it's really helpful to know when and where to make an entry decesion or a trend or a consolidation, if you don't understand how to read it, you better to learn it first (on "how to read" section and "How to OPEN position" the section below)
2. Stoch RSI Divs Zone Crypto by Gammaprod (DON'T CHANGE IT)
3. MACD Volume Crypto by Gammaprod (DON'T CHANGE IT)
>> How to read :
1. Sell or Buy Priority :
A. Buy Priority
- Color background on macd and stoch rsi is pink or purple sell is the priority, (if you're not sure to buy, just wait until the best moment to sell)
B. Buy Priority
- Color background on macd and stoch rsi Teal or light green buy is the priority, (if you're not sure to sell, just wait until the best moment to buy)
C. Indecision / Golden Moment
- Color background on stoch rsi yellow is indecision / golden moment of reversal pattern (wait until it formed background only on Stoch RSI), please becareful at this moment.
2. Trend / Consolidation :
A. BULLISH trend
- When Stoch RSI and MACD have teal or light green background that's means BULLISH trend, better to confirm by the candle is above green cloud and lagging span (red line) is also above the candle.
B. BEARISH trend
- When Stoch RSI and MACD have the Pink or purple background that's means BEARISH trend, better to confirm by the candle is above purple cloud and lagging span (red line) is also below the candle.
C. CONSOLIDATION
- When Stoch RSI have the mix background that's means CONSOLIDATION, better to confirm by the candle is in or near to green / purple cloud and lagging span (red line) is also on the candle.
3. Special Mark
A. Ideal Bullish :
- Near line 20 and green / teal background = When Stoch RSI have the char R / H on lime color label, that's means divergence or hidden divergence for buy position, if you not see this label that's means just a standard confirmation for buy
B. Not an Ideal Bullish :
- Near line 80 and green / teal background = if this happens make sure you know what happen, it could be a false signal or bullish continual pattern
C. Ideal Bearish :
- Near line 80 and pink / purple background = When Stoch RSI have the char R / H on lime color label, that's means divergence or hidden divergence for buy position, if you not see this label that's means just a standard confirmation for sell position.
D. Not an Ideal Bearish:
- Near line 20 and pink / purple background = if this happens make sure you know what happen, it could be a false signal or bearish continual pattern
E. The Beginning of Reversal (from BEARISH to BULLISH) :
- When Stoch RSI line shaping GREEN position is near 20.
- MACD lines still PINK, position lines is UNDER the HISTOGRAM, but the HISTOGRAM start to SHAPE FALL PINK (light pink) and the BACKGROUND still PINK / PURPLE.
- Position CANDLES NEAR BLUE line, NEAR PURPLE CLOUD, and lagging span (red line) STILL ON the area candle. (it used to be confirmed with the golden moment).
F. The Beginning of Reversal (from BULLISH to BEARISH) :
- When Stoch RSI line shaping PINK position is near 80.
- MACD lines still GREEN, position lines is ABOVE the HISTOGRAM, but the HISTOGRAM start to SHAPE FALL GREEN (light green) and the BACKGROUND still TEAL / GREEN.
- Position CANDLES NEAR WHITE line, NEAR TEAL CLOUD, and lagging span (red line) STILL ON the area candle. (it used to be confirmed with the golden moment).
G. False Signals, or It could be a Golden Moment (better to see it on TF 15 or bigger):
- Near line 20 or 80 and yellow background = When Stoch RSI have the char R / H on color label, that's means divergence or hidden divergence for buy / sell position, if you not see this label that's means just a standard confirmation for buy / sell depends on where the Stoch RSI line if near 20 that's means buy, near 80 means sell
>> How to OPEN position:
A. Bullish
1. Trendlines Boll Ichi Crypto by Gammaprod
- The candles above the green cloud.
- Lagging span (red line) above the candles.
- then open buy near yellow line (the first option) / blue line (the second option) (always confirm the position with two other indicators below).
2. Stoch RSI Divs Zone Crypto by Gammaprod
- Teal or Green background.
- The lines is shaping green.
- Better if on the bottom (at a range 20).
3. MACD Volume Crypto by Gammaprod
- Teal or Green background.
- The lines is shaped or shaping green.
- Better if at the green histogram.
B. Bearish
1. Trendlines Boll Ichi Crypto by Gammaprod
- The candles below the purple cloud.
- Lagging span (red line) below the candles.
- then open buy near yellow line (the first option) / white line (the second option) (always confirm the position with two other indicators below).
2. Stoch RSI Divs Zone Crypto by Gammaprod
- Pink or purple background.
- The lines are shaping pink.
- Better if the line on the top (at a range 80).
3. MACD Volume Crypto by Gammaprod
- Pink or purple background.
- The lines are shaped or shaping green.
- Better if at the pink histogram.
C. Consolidation
1. Trendlines Boll Ichi Crypto by Gammaprod
- The candles on the cloud (green or purple).
- Lagging span (red line) on the candles.
- then open buy near the white or blue line (always confirm the position with two other indicators below).
2. Stoch RSI Divs Zone Crypto by Gammaprod
- Mix background specially on a timeframe 15m or more.
- The line move fast up and down.
- Better if on the bottom or the top of the lines (at a range 20 or 80).
3. MACD Volume Crypto by Gammaprod
- Changing the background.
- The line is near the middle line.
- Have small Histogram.
>> The secret ingridient is comparing the timeframe :
The example scalping (Timeframe 1m, 5m and 15m)
- TF 1m is for making an open position.
- TF 5m is for making a judgement of the trend market.
- TF 15m is to confirm that judgement from TF 5m, be careful if it not similar then it used to be a consolidation or the beginning of the reversal.
There's a lot a way to open the position than above information that i gave it to you, but consider there are a limit char on this column, I hope it will help your trading and make a more profit on it.

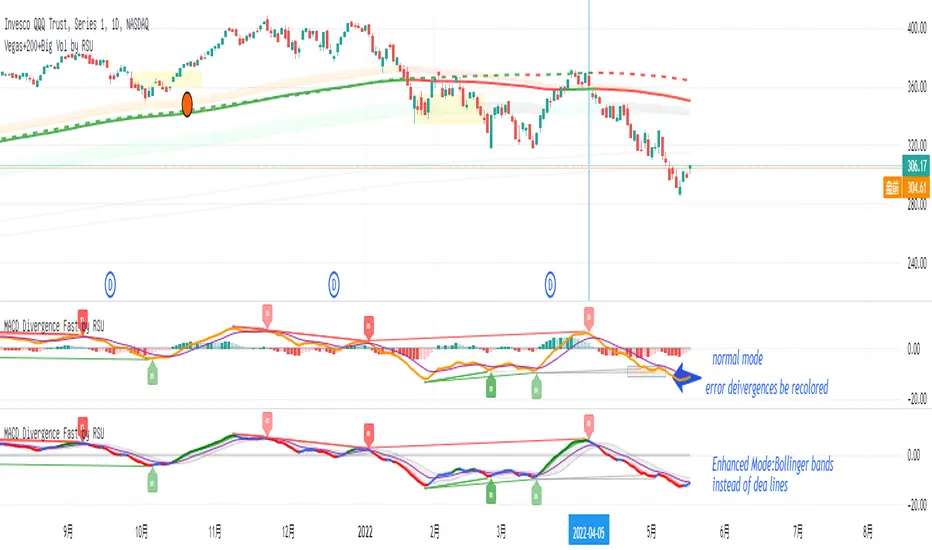
MACD Divergence Fast by RSUAdvantages:
1. When MACD-diff line(orange color) is at a high point, once it falls by 1 k line, it will detect the divergence from the previous high point. This can quickly find the divergence that has taken effect and help you quickly capture the trend before a sharp decline or rise.
2. This indicator detects the previous high and the previous low of 5, 10, 20, 40, 60 lengths at the same time, instead of only detecting a fixed length, so that more divergences can be found.
Notice:
Because it is a quick divergence detection, it is recommended to confirm that the divergence takes effect after the current k is completely closed first. I have identified this state in the indicator as "k not end".
Disadvantages and Risks:
Since it is a quick discovery, there will be error identification. Error divergences will recolor to grey.
Suggestion:
Use “RSI Divergence Fast by RSU” at the same time, because RSI divergence usually occurs before macd, if the position diverges at the same time, the probability of success will increase.
Please do not:
Don't go short in the uptrend, don't go long in the downtrend.
Top divergences that occur because of a strong uptrend are usually only temporary pullbacks. Bottom divergences in persistent declines are also temporary rallies. Do not attempt to trade such low-return trades.
It is recommended to use the divergence indicator when the stock price has made a new high and retraced, and once again made a new high, because this often leads to the end of the trend.
Divergence how to use:
1. After the previous K line was completely closed, a bottom divergence was found.
2. Open an long order at the beginning of the second bar, or as close to the bottom as possible (because the stop loss will be smaller).
3. Break the stop loss price below the previous low where the divergence occurred, which already means that the divergence is wrong.
[blackcat] L3 Faster MACDLevel 3
Background
I am seeking a way to make MACD faster
Function
By using stoch, but with MACD method, a faster MACD is made. short term faster kd is used for macd lines. long term kd is used for histogram, which can counteract the histogram grade gap caused by tradtional MACD.
Remarks
This is a Level 1 free and open source indicator.
Feedbacks are appreciated.

The Brain Trust Presets Strategies [BTC / ETH] [PrismBot] [Lite]This strategy contains 9 different timeframe strategies (2 strategy types with pre-adjusted filter options for the different timeframes) tailored to BTC ( Bitcoin ) and ETH ( Ethereum ) on Binance. While I've listed these prebuilt strategies for specific timeframes, they are versatile enough to be checked and tested on other timeframes, and exchanges as well. I have been careful to avoid any curvefitting or overfitting. Included is useful default order settings, but we wanted to ensure you, the user, has control over the order settings for your own equity and trading.
These strategies are created, tailored, tested, and actively used by me.
It is up to you to do your own due diligence when testing these strategies on your exchange, and for your use, and PrismBot bears no responsibility for losses from the use of these strategies.
These strategies employ a variety of methods. Notable inclusions are other live strategies of mine including but not limited to:
ADX + MACD
RSI
Consolidations
Bull Bear Power
Volume Calculations
Open Interest Data
All of these setups include trend trading methods intended to maximize profitability in strong trending markets, and filters deployed to prevent failures in consolidation, though nothing is failproof.
You can control your leverage, quantity calculations, and other order settings. However, all other strategy input parameters are controlled by the strategy selectors.
Some strategies use 1.5 to 1 Risk to Reward ratio while others use 1:1.
How we execute trades for each strategy:
For 10m and 45m
we use a variety of settings for a Normalized MACD and ADX indicator. The thesis is we detect Normalized MACD crossovers at specific values and only allow trading of the strategy when the ADX is above a specific value.
For 15m, 1H, and 45m
we utilize the RSI crossovers of overbought and oversold and use the RSI moving average to filter trades. The thesis is we detect overbought for long and oversold for short.
For each strategy we use additional filters such as Bull Bear Power, Volume Flow, and Open Interest calculations to simply validate a trade.
Automatic Mode
In automatic mode, we detect your timeframe and current coin chart to decide one of the strategies from our database. If you want to manually select a different strategy or try the strategies on different cryptocurrencies, you can disable automatic mode entirely.

MACD of Aggregated Buy/Sell Pressure - InFinitoModified & Updated script from MARKET VOLUME by Ricardo M Arjona @XeL_Arjona that Includes Aggregated Volume
Aggregation code originally from Crypt0rus
***The indicator can be used for any coin/symbol to aggregate volume , but it has to be set up manually***
***The indicator can be used with specific symbol data only by disabling the aggregation option, which allows for it to be used on any symbol***
- Calculated based on Aggregated Volume instead of by symbol volume . Using aggregated data makes it more accurate and allows to compare volume flow between different kinds of markets (Spot, Futures , Perpetuals, Futures+Perpetuals and All Volume ).
- As well, in order to make the data as accurate as possible, the data from each exchange aggregated is normalized to report always in terms of 1 BTC . In case this indicator is used for another symbol, the calculations can be adjusted manually to make it always report data in terms of 1 contract/coin.
Buy to Sell Convergence / Divergence by @XeL_Arjona:
"It's a simple adaptation of the popular "Price Percentage Oscillator" or MACD but taking Buying Pressure against Selling Pressure Averages, so given a Positive oscillator reading (>0) represents Bullish dominant Trend and a Negative reading (<0) a Bearish dominant Trend. Histogram is the diff between RAW Volume Pressures Convergence/Divergence minus Normalized ones (Signal) which helps as a confirmatory."
Things to look for:
- Divergences: This indicator can very useful to spot tops and bottoms through divergences

K's Reversal Indicator IK's reversal indicator I is a special combination between Bollinger bands and the MACD oscillator. It is a contrarian indicator that depends on the following conditions:
• A buy signal is generated whenever the current market price is below the 100-period lower Bollinger band while simultaneously, the MACD value must be above its signal line. At the same time, the previous MACD value must be below its previous signal line.
• A sell (short) signal is generated whenever the current market price is above the 100-period upper Bollinger band while simultaneously, the MACD value must be below its signal line. At the same time, the previous MACD value must be above its previous signal line.
The way to use K's reversal indicator is to combine it with your already long/short bias in a sideways/range market in order to maximize the probability of success.
Limitations of the indicator include the following:
• There are no clear exit rules that work well on average across the markets. Even though K’s reversal indicator gives contrarian signals, it does not show when to exit the positions.
• As with other indicators, it underperforms on some markets and is not to be used everywhere.
• False signals tend to occur during trending markets but there is no proven way to detect a false signal.
