90 Minute Cycles + MTFCredit goes to LuxAlgo for the inspiration from 'Sessions' which allowed users to analyse specific price movements within a user defined period with tools such as trendline, mean and vwap.
Settings
Sessions
Enable Session: Allows to enable or disable all associated elements with a specific user set session.
Session Time: Opening and closing times of the user set session in the hh:mm format.
Range: Highlights the associated session range on the chart.
Ranges Settings
Range Area colour: Set each range to a specific colour.
Range Label: Shows the session label at the mid-point of the session interval.
Usage
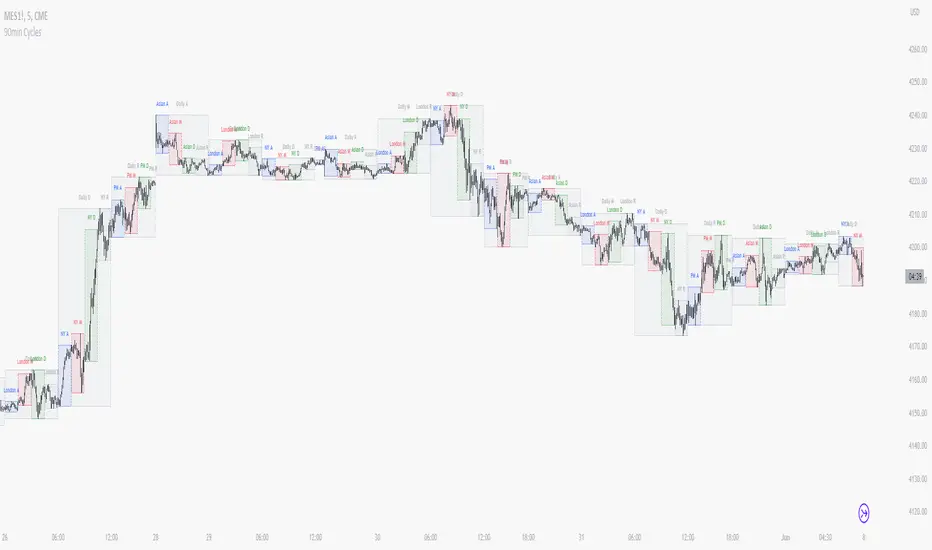
By breaking 24hrs in quarters, starting with an Asian range of 18:00 NY time you can visualise the principles of Accumulation, Manipulation, Distribution and Rebalance. Know as AMD or PO3 (Power of Three), the principle is that the Manipulation phase will break above or below the Accumulation, before moving in an apposing direction and then rebalancing. This only works when there is a higher timeframe PD array or liquidity to support an apposing move.
Further to the daily quarters, each one can then be broken down again into 90min cycles. Again, each represents AMD, allowing the user an opportunity to watch for reversals during the 90min manipulation phase.
Note: Ensure the Asian Cycle always begins at 18:00 NY time.
The example shows that the 90min cycle occurs, followed by an apposing move away in price action
Here is the Daily cycle, highlighting the Manipulation phase.
Enjoy!
Manipulation
ICT Macros [LuxAlgo]The ICT Macros indicator aims to highlight & classify ICT Macros, which are time intervals where algorithmic trading takes place to interact with existing liquidity or to create new liquidity.
🔶 SETTINGS
🔹 Macros
Macro Time options (such as '09:50 AM 10:10'): Enable specific macro display.
Top Line , Mid Line , Bottom Line and Extending Lines options: Controls the lines for the specific macro.
🔹 Macro Classification
Length : A length to detect Market Structure Brakes and classify macro type based on detection.
Swing Area : Swing or Liquidity Area selection, highest/lowest of the wick or the candle bodies.
Accumulation , Manipulation and Expansion color options for the classified macros.
🔹 Others
Macro Texts : Controls both the size and the visibility of the macro text.
Alert Macro Times in Advance (Minutes) : This option will plot a vertical line presenting the start of the next macro time. The line will not appear all the time, but it will be there based on remaining minutes specified in the option.
Daylight Saving Time (DST) : Adjust time appropriate to Daylight Saving Time of the specific region.
🔶 USAGE
A macro is a way to automate a task or procedure which you perform on a regular basis.
In the context of ICT's teachings, a macro is a small program or set of instructions that unfolds within an algorithm, which influences price movements in the market. These macros operate at specific times and can be related to price runs from one level to another or certain market behaviors during specific time intervals. They help traders anticipate market movements and potential setups during specific time intervals.
To trade these effectively, it is important to understand the time of day when certain macros come into play, and it is strongly advised to introduce the concept of liquidity in your analysis.
Macros can be classified into three categories where the Macro classification is calculated based on the Market Structure prior to macro and the Market Structure during the macro duration:
Manipulation Macro
Manipulation macros are characterized by liquidity being swept both on the buyside and sellside.
Expansion Macro
Expansion macros are characterized by liquidity being swept only on the buyside or sellside. Prices within these macros are highly correlated with the overall trend.
Accumulation Macro
Accumulation macros are characterized by an accumulation of liquidity. Prices within these macros tend to range.
The script returns the maximum/minimum price values reached during the macro interval alongside the average between the maximum/minimum and extends them until a new macro starts. These levels can act as supports and resistances.
🔶 DETAILS
All required data for the macro detection and classification is retrieved using 1 minute data sets, this includes candles as well as pivot/swing highs and lows. This approach guarantees the visually presented objects are same (same highs/lows) on higher timeframes as well as the macro classification remain same as it is in 1 min charts.
8 Macros can be displayed by the script (4 are enabled by default):
02:33 AM 03:00 London Macro
04:03 AM 04:30 London Macro
08:50 AM 09:10 New York Macro
09:50 AM 10:10 New York Macro
10:50 AM 11:10 New York Macro
11:50 AM 12:10 New York Launch Macro
13:10 PM 13:40 New York Macro
15:15 PM 15:45 New York Macro
🔶 ALERTS
When an alert is configured, the user will have the ability to be notified in advance of the next Macro time, where the value specified in 'Alert Macro Times in Advance (Minutes)' option indicates how early to be notified.
🔶 LIMITATIONS
The script is supported on 1 min, 3 mins and 5 mins charts.
🔶 RELATED SCRIPTS

SFC MTF CandlesMost technical traders in the foreign exchange market, whether they are novices or seasoned pros, have come across the concept of multiple time frame analysis in their market educations.
Multiple time-frame analysis involves monitoring the same currency pair across different frequencies (or time compressions). While there is no real limit as to how many frequencies can be monitored or which specific ones to choose, there are general guidelines that most practitioners will follow.
Typically, using three different periods gives a broad enough reading on the market, while using fewer than this can result in a considerable loss of data, and using more typically provides redundant analysis.
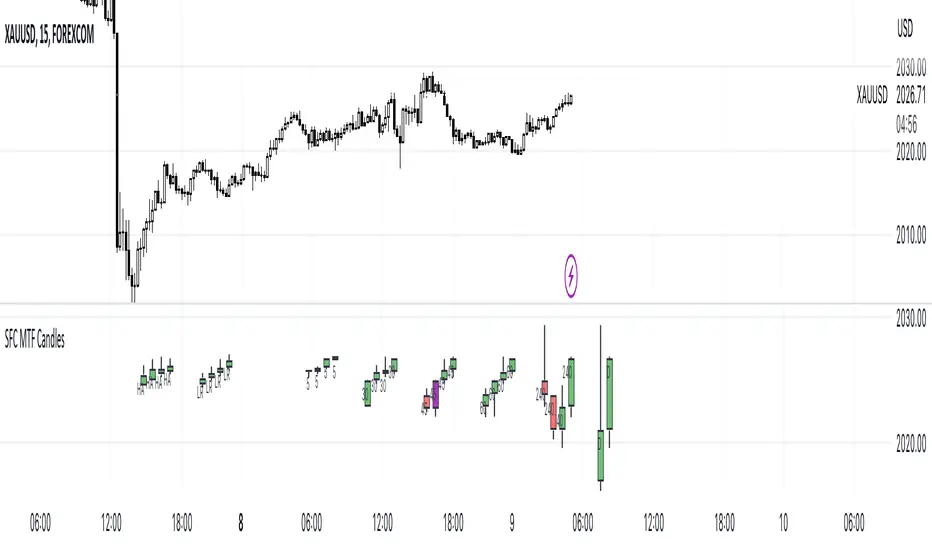
This indicator helps traders to visualise the last few candles on many time frames.
For manipulation traders I have added the ability to see the current manipulation on different time frames. When such a candle is created, its colour changes to purple.
The Heikin-Ashi technique averages price data to create a Japanese candlestick chart that filters out market noise.
Heikin-Ashi charts, developed by Munehisa Homma in the 1700s, share some characteristics with standard candlestick charts but differ based on the values used to create each candle. Instead of using the open, high, low, and close like standard candlestick charts, the Heikin-Ashi technique uses a modified formula based on two-period averages. This gives the chart a smoother appearance, making it easier to spots trends and reversals, but also obscures gaps and some price data.
Linear regression attempts to model the relationship between two variables, with a given collection of data values.
Linear regression is a very common and useful technique for following the trend. This technique is applied to candles in order to filter out false movements.
Heikin Ashi and Linear Regression candles are helpful for more conservative traders. If they are not sure about the direction, they can wait for these candles to change colour (direction) as an extra confirmation.
Features:
- Up to 6 time frames
- Up to 4 MTF bars
- Heikin Ashi candles (current time frame) - x4
- Linear Regression candles (current time frame) - x4
Settings
- Time frames on/off
- Selection how many bars to display from each time frame (max 4)
- Adjustment of distance between candles
- Adjusting the position of the candles
- Heikin Ashi candles on/off
- TLinear regression candles on/off
- Linear regression candle length adjustment
How to use the indicator:
Traders can visualise different candles in order to observe the chart better and faster.
All they have to do is activate the group of candles they want and set it up according to their preferences.
Due to the complexity of the code, there is a 1s delay when all features are enabled. To eliminate the lag, deactivate some of the features
It is recommended to have a maximum of 3 time frames activated during the high impact news, as the price changes very quickly.
HTF Power of Three°Power of Three ( PO3 ) is one of the many concepts introduced by the Inner Circle Trader and inspired by Larry Williams.
The PO3 represents a three staged Smart Money campaign: Accumulation , Manipulation , and Distribution .
ICT traders assume that this pattern represents how any candle is built.
“This is applicable to every time measurement, as long as you have a beginning time, the highest value, the lowest value, and an ending in terms of measuring time.”
Consider the development of a Bullish Candle over Time:
– Candle Open (initial value price, prior to dynamic imbalance)
– Accumulation of longs around the opening price
– Manipulation where short liquidity is engineered and long liquidity is neutralized
– Range Expansion (dynamic price imbalance)
– Distribution pairing long exits with pending buy interest
– Candle Close (ending value price, post dynamic imbalance)
The same goes for the development of Bearish Candles, in reverse.
The HTF Power of Three° Indicator allows to monitor the selected Higher Timeframe Candle in real time:
– See where its Open, High, and Low are in the current lower resolution with high precision
– Know when it's supposed to Close by monitoring its own countdown (if below 1D)
– Note its Low to High range to gain a deeper understanding of LTF market profiles
– Study and backtest PO3 in Replay Mode with ease
– Trade PO3 with confidence without needing multiple layouts
This becomes very useful when studying, and especially using, PO3. One can use this as a tool to build narrative, as well as spotting important institutional levels.
You can also monitor more than one HTF PO3 at the time by stacking multiple instances of the indicator:
This works on any timeframe, even the seconds charts!
Note: if you select too high of a PO3 timeframe while on LTF you might receive an error due to TrandingView's data availability on that chart – this can also depend on your TradingView Plan.

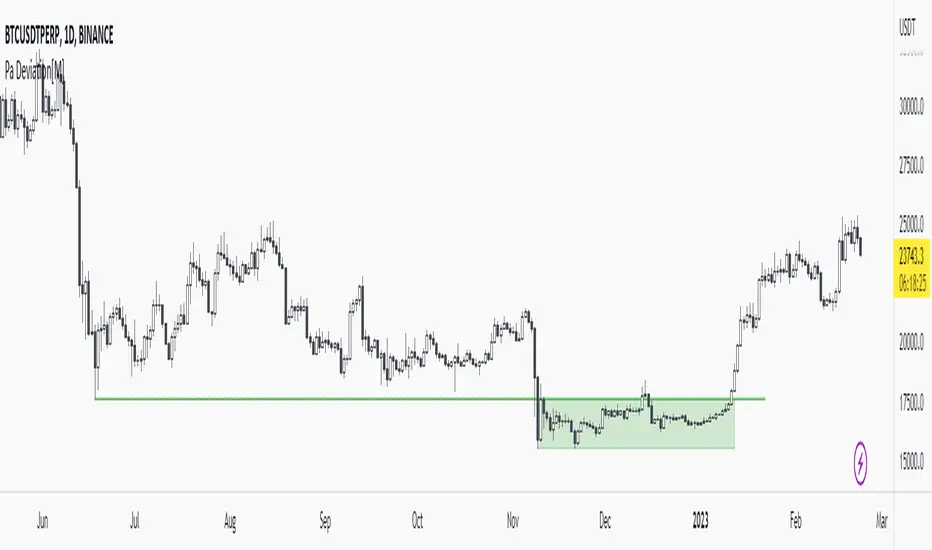
Pa Deviation[M]Hello everyone,
First of all, what is deviation?
It can be said that the price goes down (or goes out) under the past pivot zone and enters the range again after lingering for a while. (I think so)
I think there is a sign of trend reversal as it hunts the stops below (or above) the pivot zone as well. (RektProof also has a strategy for this.)
In this indicator, I determined the deviation limits with the atr of the pivot regions. For example, the deviation area (pivot zone - atr) must be greater than. It should also make a grand entrance into the range.
Let me tell you a little about the settings:
Pivot Length: It is the value entered for determining the pivot regions. For example, if the pivot length is 5, the low must be less than the past 5 lows and the next 5 lows.
Minimum Bar: The value that determines the minimum bar of the deviation area. For example, if the minimum bar is 4, the indicator will show deviation areas consisting of minimum 4 bars.
Example Deviation:
1.Pivots and Pivot Lines
As you can see in the image, there are many pivot points. Let's take the lowest pivot point and draw an imaginary line. This is our pivot line
2.Deviation
As you can see, an accumulation has occurred under our pivot line. If the price goes above our pivot line again, it will be a deviation.
3.Return to Range
Voila! Price accumulated below the pivot line and splendidly rose above the pivot line. This is the deviation area for us now.
Other Examples:
SFC Smart Money Manipulation - Liquidity, StructureThis indicator shows very important information about the market.
Features:
- Market structure
- Important Ranges
- Liquidity
- Trading session
- Daily Checklist
Market structure
Market structure is the behaviour, condition, and current flow of the market. It highlights support and resistance levels, swing highs, and swing lows. A trend is simply a consistent direction of price movement over time. Market structure can tell you if the market is trending or not.
Market structure is a lagging indicator, because Highs and Lows must to be created in order to define the structure properly. The structure provide the most important information about the market.
Market structure can provide early signals about the trend.
- If the structure continues to break in the same direction, it means that the trend is healthy and will continue (BoS).
- If the structure break in the opposite direction, means that the trend may reverse or pause for a while (CHoCH).
Important ranges
- Asia Range - it is important intraday range and can provide early information if the day will be bullish or bearish.
- Most recent High/Low - determine the last swing
- Premium/ Discount zone with Fibonacci levels - the institutions always want to buy in discount and sell in premium.
Liquidity
Areas where a lot of traders get into the market and theirs stop losses are obvious. So the banks will manipulate the price to clear these stop losses, before price go in real direction. The banks will always hunt the liquidity.
The major liquidity is:
- Doji candle - displayed
- Double/Triple Highs or Lows - displayed
- Fair value gaps - displayed
- Imbalances - displayed
- Trend lines
- Big wicks
Trading Sessions
Price and Time theory is very significant in Smart Money Concept. The banks do not just place orders chaotically. They place it in specific time.
The indicator shows the Asia, London and New York intraday sessions and the kill zones.
Kill Zone - most manipulated time in the day, where institutions try to wipe out the retail traders and establish the true move.
Daily Checklist
Simple, but very useful checklist. It shows the most important daily steps in order qualitative analysis to be created.
How to use
1) Use the swing highs and lows and check the current structure.
2) Look where is the major liquidity. By default orange colour. When liquidity is retested from the price ,it change the colour from orange to gray. Retested liquidity is no more significant for the banks.
3) Use the important ranges to define the pullbacks or reversals or trading ranges.
4) Use the trading sessions and kill zones to place orders in the right time.
5) Use the "daily checklist" every day - step by step. It helps trader to analyse the current market.
Settings
-Show pivots, Pivot confirmation candles, Equal Highs/Lows sensitivity
-Show structures breaks
-Show most recent high/low
-Show Asia range
-Show premium/discount zone with Fibonacci levels
-Show liquidity, Colour of liquidity, Color of retested liquidity, Doji settings
-Show Trading sessions
-Show daily checklist

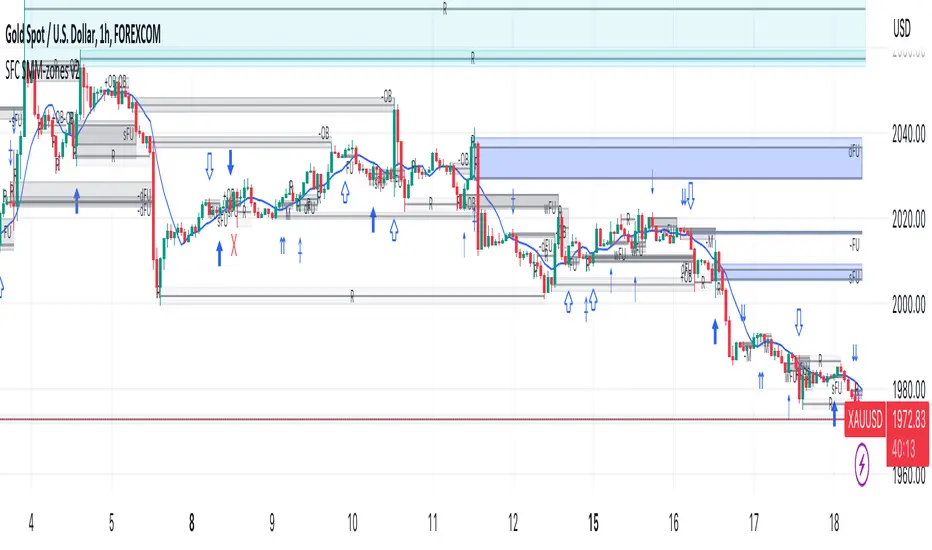
SFC Smart Money Manipulation - MTF ZonesThis indicator shows the most important manipulated zones - true support and resistance.
The indicator can show the zones from different time frames - 1H, 4H, D and the current TF.
Order Block definition - small candle or few consecutive candles, where banks place buy and sell orders in order to manipulate the price. After price is manipulated and moved in one direction, the banks are in draw down, that is why they manipulate the price one more time before the true move, retesting these candles (closing losing positions).
FU candles
FU candles are most manipulated candles and create very strong reaction zones. These are the true zones, where the banks place their orders.
Why they are so strong? The answer is very simple - these candles clear the liquidity from the previous ones. After the liquidity is cleared ( all stop losses/pending orders are triggered), price reveal the true direction and move very fast.
FU candles are type of Order Blocks - the most powerful one.
Because the most volume is in the body of the order block. The indicator shows not only the FU candle, but the body of the order block.
There are two types of FU candles :
(only full FU candles are displayed as zones, because they are much significant)
1) Full fu, where the current candle completely engulf the previous one, after taking the liquidity. (displayed as F)
2) Current candle only take liquidity from the previous one, but failed to engulf it. (displayed as A)
9 day simple moving average is also displayed. When the price form Fu candle above/under the MA, there is a better chance for reversal.
When FU candles are retested the transparency will change, showing that the zones may have less impact.
Order Blocks
Only the current order blocks are displayed. Price react very often from the 50% level, that is why this level is also displayed.
Rejections
Rejections are doji candles or candles with big wicks. These rejections very often lead to reversals or deep pullbacks. But before the true move, price test the rejection levels. The retest is not always, but very often of the 50% of the wick.
The rejections are very important price zone.
The indicator can show the zones from different time frames - 1H, 4H, D and the current TF. When wicks are retested the transparency and colour will change, showing that the wicks may have less impact or no more impact.
Settings
-The colour and transparency of the zones can be changed.
- Multi time frames zones could be disabled.
- Doji settings
- Length of the moving average
How to use
If price reach one of the displayed zones. The trader should be prepared for price reaction. This reaction could lead to reversal, pull back or trading range.
The trader should have bias from the higher time frames and watch for signs of manipulations on smaller time frames.
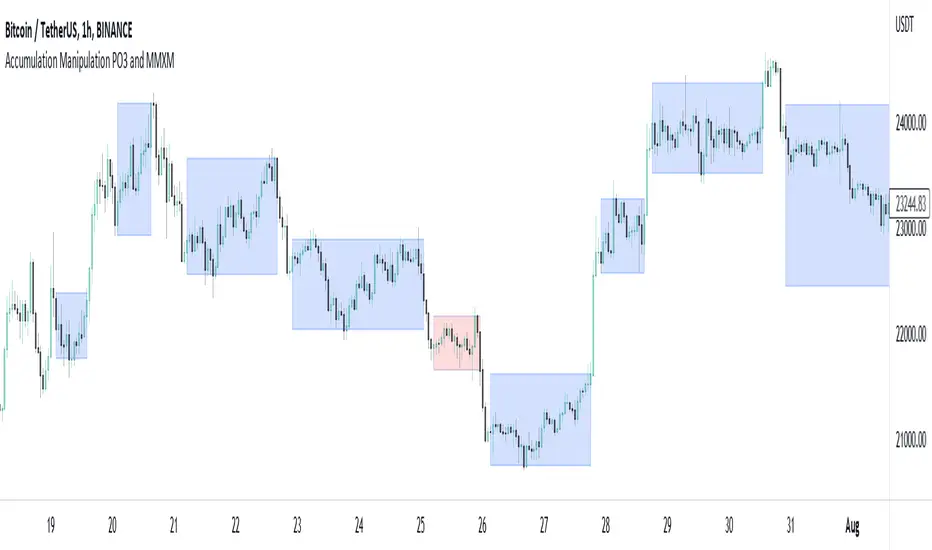
Accumulation Manipulation PO3 and MMXMMuch is said about the market maker or manipulation of price, but there aren't many indicators that try to show this, until now.
Using an easily customisable, but intelligent algorithm, this indicator tries to find and highlight when price is 'ranging', or 'accumulating'. It does this by looking at changes in price and quantifying the strength of the change, based on current and historical changes, and can therfore decide if price is staying in range or breaking out. By showing this on the chart several approaches can be taken.
Simply, you can trade within the range, and also trade breakouts of the range, knowing that price will react at these range 'levels'.
Alternatively, you can use the accumulation boxes to try and identify MMXM models, that is Market Maker Buy and Market Maker Sell Models, where price moves in phases of consolidation, smart money reversal and re-accumulation.
Finally, using the manipulation detection option, you can try to identify when a sudden change in price is actually manipulation by institutions, and plan to trade the distribution phase accordingly. This accumulation, manipulation, distribution is also known as Power of 3, PO3.
This indicator does not try to teach any of these ideas, only help to visualise them on the chart, and as such should not be considered financial advice.
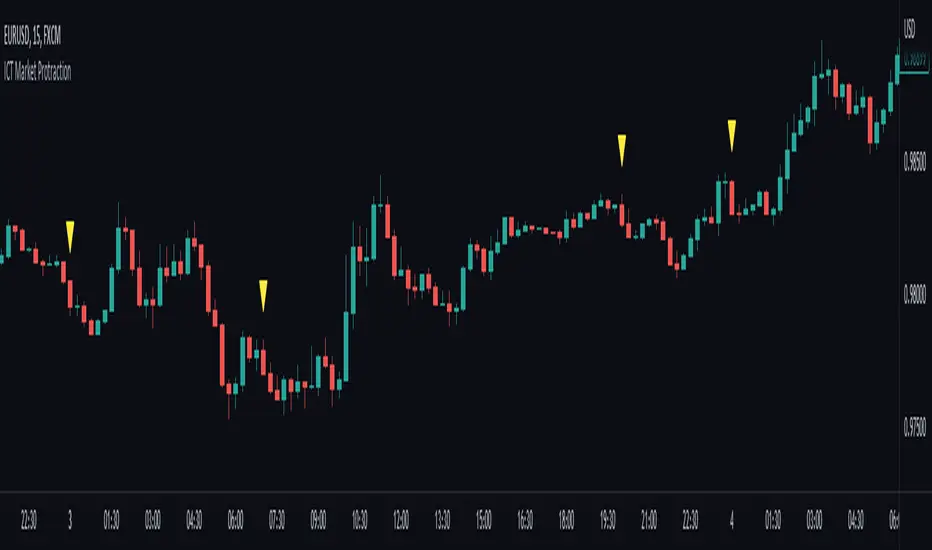
ICT Market Protraction (0:00, 7:00, 20:00 NY time highlight)Market protraction, as defined by ICT, is a time-specific reoccurring impulse move in forex markets. It is designed for market manipulation and will go in the opposite direction of the following trend.
My indicator will add a shape above/below the candle if it fits the time criteria.
I recommend to watch: ICT Mentorship Core Content - Month 1 - Impulse Price Swings & Market Protraction on Youtube
KVKZKVKZ = KV'S KILLZONES
This Indicator, break the charts into session: ASIAN, LONDON, NEW YORK.
-The 1st two vertical lines (red) indicates the ASIAN RANGE
-The 2nd two vertical lines (red & green) indicates the LONDON session
-The 3rd two vertical lines (green & blue) indicates the NEW YORK session
-The will be no trading in between the two red vertical lines
-A fake move is expected to happen in between the 2nd red vertical line and green line, this fake move is known as the JUDAS SWING by ICT, you can YouTube Judas Swing and check out his concepts
-There are two automatically moving horizontal lines (orange), that plots the ASIAN high and lows, these levels are expected to be manipulated in the London session, and this is called the Judas Swing
-the purple lines are known as Institution Zones, basically just levels 30pips above and below the ASIAN range
-this indicator works well with GBPUSD, EURUSD, USDCHF
-this indicator doesn’t work well with USDJPY, AUDUSD, NZDUSD
INPUTS:
HOUR 1: 17
MIN 1 : 0
HOUR 2: 0
MIN 2 : 0
HOUR 3: 6
MIN 3 : 0
HOUR 4: 12
MIN 1 : 0
THIS INDICATOR IS NOT A HOLY GRAIL, BUT IF YOU CAN READ PRICE ACTION WELL, THESE SESSIONS BREAK DOWN COULD BE VERY USEFULL.
Extras:
dot = dotted lines
dsh = dashed lines
sol = solid lines
NOTE: time has to be set to NY time.

Volume Pressure AnalysisVolume Pressure Analysis is a new concept I have been working on designed to show the effort required to move price. An ideal tool for confirming trends or locating reversals early. This indicator can highlight whale action and market manipulation. It calculates volume vs volatility and displays the results as a meter:
Above 0 shows how easy price action is traveling, the bigger these bars the less volume and effort is required to push price. These are indicated with a teal or red arrows and can confirm the beginning or continuation of a trend. This is the natural direction the chart wants to travel at that time.
Below 0 shows how hard price is to move. The bigger these bars the more volume and effort is required to push price. When whales and market makers push price against its will these bars will get bigger.
Yellow arrows signal pressure in that direction and excessive amounts of volume is required to move price. These signals can lead to reversal/ pivot points as price action struggles to continue its trend. These signals can be turned on in settings or use the overlay version of this script to display signals on chart. This is a very powerful tool when used with relative volume.

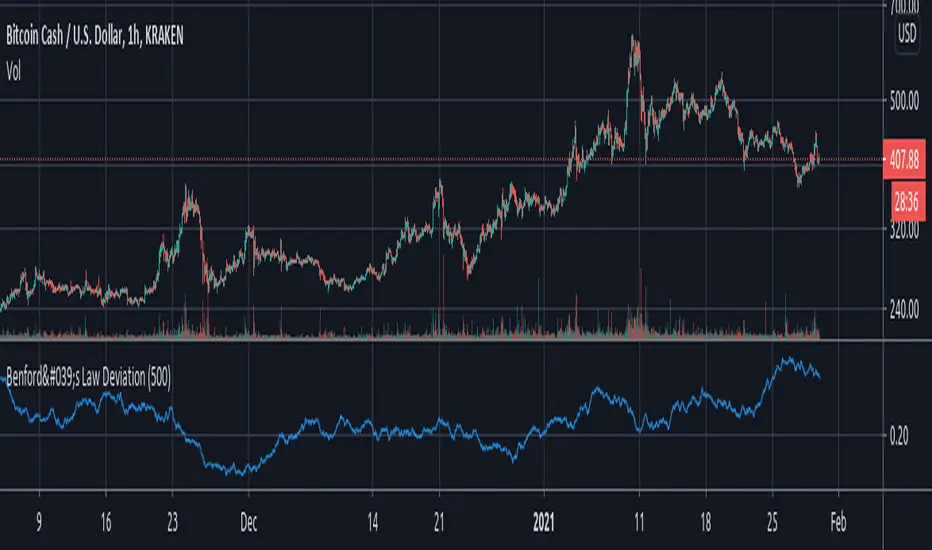
Benford's Law DeviationThis Study uses Benford's Law , which states that unmanipulated numerical real-life data sets should contain a certain distribution of leading digits. This Mathematical Law may be useful to identify whether there is market-manipulation going on and to which degree. The higher the value the script outputs, the higher the deviation from the expected leading-digit distribution - indicating a possibly higher probability of market manipulation going on. The script fetches the leading digits of the volume and percentage price change and calculates their distribution to compute the deviation from the expected distribution according to Benford's Law.
String Manipulation Framework [PineCoders FAQ]█ OVERVIEW
This script provides string manipulation functions to help Pine coders.
█ FUNCTIONS PROVIDED
f_strLeft(_str, _n)
Function returning the leftmost `_n` characters in `_str`.
f_strRight(_str, _n)
Function returning the rightmost `_n` characters in `_str`.
f_strMid(_str, _from, _to)
Function returning the substring of `_str` from character position `_from` to `_to` inclusively.
f_strLeftOf(_str, _of)
Function returning the sub-string of `_str` to the left of the `_of` separating character.
f_strRightOf(_str, _of)
Function returning the sub-string of `_str` to the right of the `_of` separating character.
f_strCharPos(_str, _chr)
Function returning the position of the first occurrence of `_chr` in `_str`, where the first character position is 0. Returns -1 if the character is not found.
f_strReplace(_src, _pos, _str)
Function that replaces a character at position `_pos` in the `_src` string with the `_str` character or string.
f_tickFormat()
Function returning a format string usable with `tostring()` to round a value to the symbol's tick precision.
f_tostringPad(_val, _fmt)
Function returning a string representation of a numeric `_val` using a special `_fmt` string allowing all strings to be of the same width, to help align columns of values.
`f_tostringPad()`
Using the functions should be straightforward, but `f_tostringPad()` requires more explanations. Its purpose is to help coders produce columns of fixed-width string representations of numbers which can be used to produce columns of numbers that vertically align neatly in labels, something that comes in handy when, for example, you need to center columns, yet still produce numbers of various lengths that nonetheless align.
While the formatting string used with this function resembles the one used in tostring() , it has a few additional characteristics:
• The question mark (" ? ") is used to indicate that padding is needed.
• If negative numbers must be handled by the function, the first character of the formatting string must be a minus sign ("-"),
otherwise the unary minus sign of negative numbers will be stripped out.
• You will produce more predictable results by using "0" rather than "#" in the formatting string.
You can experiment with `f_tostringPad()` formatting strings by changing the one used in the script's inputs and see the results on the chart.
These are some valid examples of formatting strings that can be used with `f_tostringPad()`:
"???0": forces strings to be four units wide, in all-positive "int" format.
"-???0": forces strings to be four units wide, plus room for a unary minus sign in the first position, in "int" format.
"???0.0": forces strings to be four units wide to the left of the point, all-positive, with a decimal point and then a mantissa rounded to a single digit.
"-???0.0?": same as above, but adds a unary minus sign for negative values, and adds a space after the single-digit mantissa.
"?????????0.0": forces the left part of the float to occupy the space of 10 digits, with a decimal point and then a mantissa rounded to a single digit.
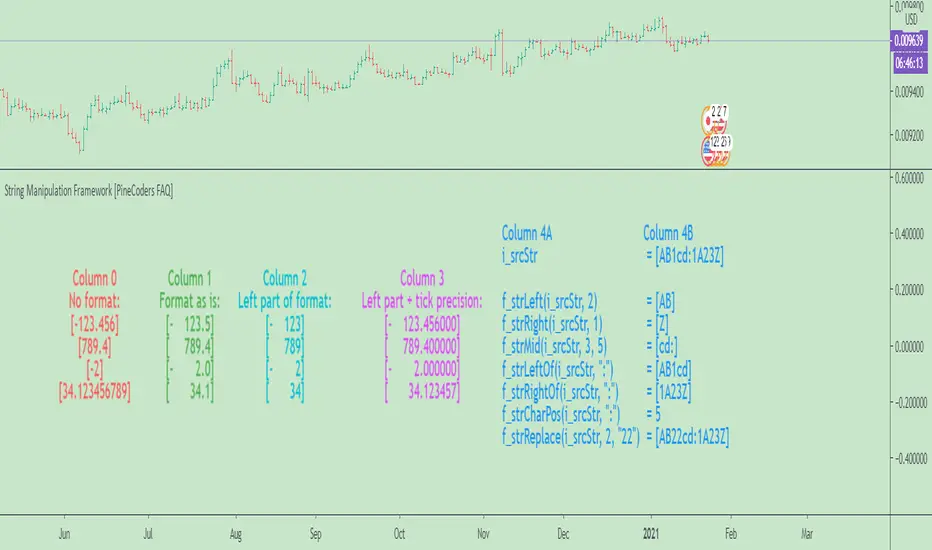
█ CHART
The information displayed by this indicator uses the values in the script's Inputs, so you can use them to play around.
The chart shows the following information:
• Column 0 : The numeric input values in a centered column, converted to strings using tostring() without a formatting argument.
• Column 1 : Shows the values formatted using `f_tostringPad()` with the formatting string from the inputs.
• Column 2 : Shows the values formatted using `f_tostringPad()` but with only the part of the formatting string left of the decimal point, if it contains one.
• Column 3 : Shows the values formatted using `f_tostringPad()` but with the part of the formatting string left of the decimal point,
to which is added the right part of the `f_tostringPad()` formatting string, to obtain the precision in ticks of the symbol the chart is on.
• Column 4 : Shows the result of using the other string manipulation functions in the script on the source string supplied in the inputs.
It also demonstrates how to split up a label in two distinct parts so that you can vertically align columns when the leftmost part contains strings with varying lengths.
You will see in our code how we construct this column in two steps.
█ LIMITATIONS
The Pine runtime is optimized for number crunching. Too many string manipulations will take a toll on the performance of your scripts, as can readily be seen with the running time of this script. To minimize the impact of using string manipulation functions in your scripts, consider limiting their calculation to the first or last bar of the dataset when possible. This can be achieved by using the var keyword when declaring variables containing the result of your string manipulations, or by enclosing blocks of code in if blocks using barstate.isfirst or barstate.islast .
█ NOTES
To understand the challenges we face when trying to align strings vertically, it is useful to know that:
• As is the case in many other places in the TadingView UI and other docs, the Pine runtime uses the MS Trebuchet font to display label text.
• Trebuchet uses proportionally-spaced letters (a "W" takes more horizontal space than an "I"), but fixed-space digits (a "1" takes the same horizontal space as a "3").
Digits all use a figure space width, and it is this property that allows us to align numbers vertically.
The fact that letters are proportionally spaced is the reason why we can't vertically align columns using a "legend" + ":" `+ value structure when the "legend" part varies in width.
• The unary minus sign is the width of a punctuation space . We use this property to pad the beginning of numbers
when you use a "-" as the first character of the `f_tostringPad()` formatting string.
Our script was written using the PineCoders Coding Conventions for Pine .
The description was formatted using the techniques explained in the How We Write and Format Script Descriptions PineCoders publication.
█ THANKS
Thanks to LonesomeTheBlue for the `f_strReplace()` function.
Look first. Then leap.
Detect Sequential Trading - Bot DetectorDetect Sequential Trading - Bot Detector.
This tool requires access to volume data .
There are many trading bots out there, that trade 24/7 .
The detector can be used to understand how the bots are configured - to push the market up or down .
Alerts can be set to fire whenever a bot pattern is detected .
They must be configured to run Once per Bar .
It works well with range charts (1R) .
It would work best on 1 second charts or tick charts (currently, TradingView's alert system doesn't work with second charts).
The alternative would be 1 minute charts .
It can be used on higher timeframes but may be less effective.

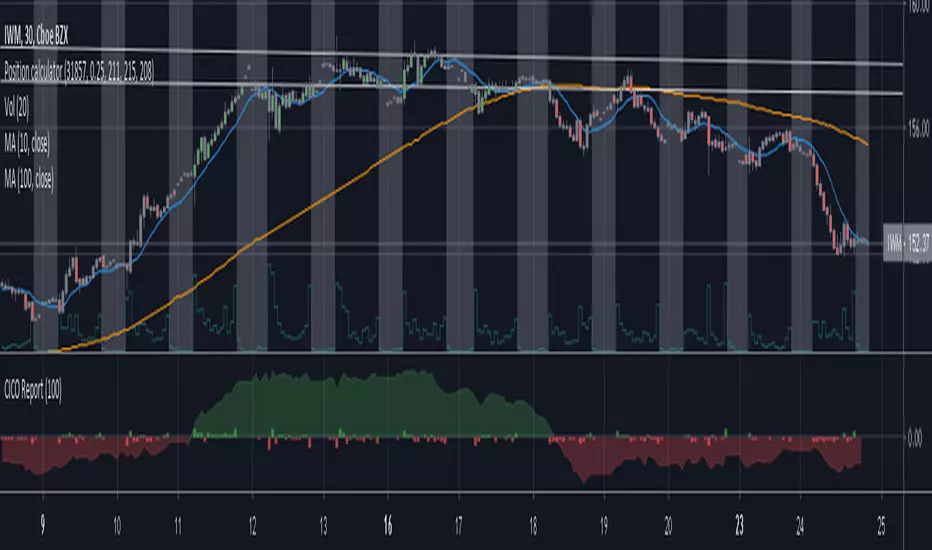
Cash in/Cash out Report (CICO) - Quiets market noiseThe cash in/cash out report (CICO for short) was built with the intent to quiet the market noise. The blunt way to say it, this indicator quiets the market manipulators voice and helps the retail investor make more money. I believe money is better of in the 99% hands versus the greedy hoarding that is currently going on. There are dozens of companies in the SP500 that have the same tax rate as unborn babies, nada. These hoarders also have machine learning high frequency trading bots that purposely create fear and anxiety in the markets. When all of the major markets move at the exact same time of day on frequent occasions, I see red flags. I recommend looking into Authorized participants in the ETF market to understand how the markets can be manipulated, specifically Creation and Redemption.
Enough of my rant. This indicator is open source. Directions on how to use the indicator can be found within the code. The basic summary is, clear your charts to bare minimums. Make the colors gray on all candles. Then apply this indicator. The indicator will color the "buy" and "sell" signals on the chart. Keep in mind, markets are manipulated to create fear in the retail investors little heart and can change drastically at any second. This indicator will show real time changes in running sum into and out of the market, it is estimated by average prices and not exact.
Once the chart is all greyed out and the indicator is applied you will see an area colored red and green. What this indicator does is takes a running sum of the new money into and out of the market. It takes the average of the high and low price times the volume. If the price is going up the value is positive, going down will be negative. Then the running sum is displayed. The area section is the running sum and the column bars are each value. When a market is steadily increasing in value you will see the large green area grow. When markets shift, values and display will change in color and vector. Full descriptions are available within the script in the comment sections.
I hope this help you make more money. If this helps you grow profits, give it a like!
Happy investing 99%er!
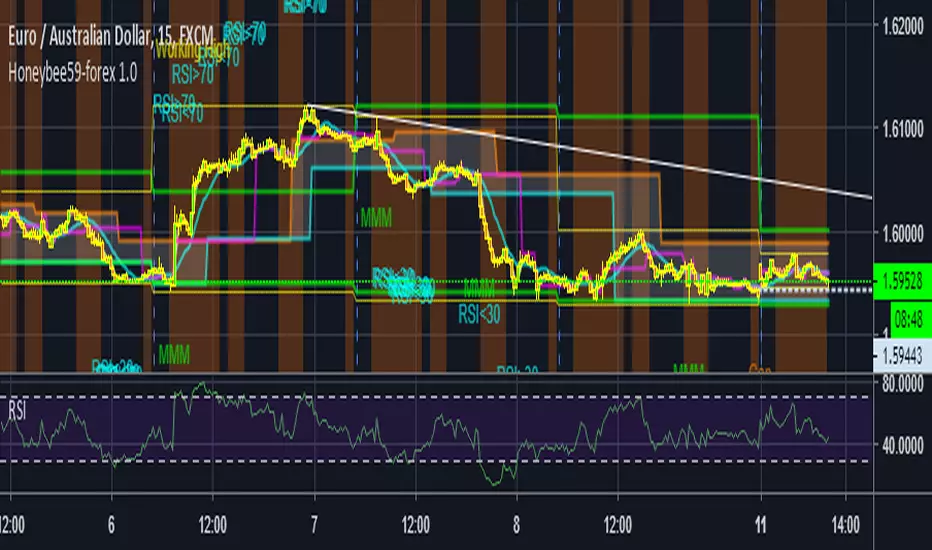
Honeybee59-forex 2.0Honeybee59-forex 2.0 for TradingView gives you abilities to see the stories hiding in the graphs of forex, and crypto currency markets. It counts CC59 and creates respectable support and resistance levels as well as marks and reminds you about important parameters that are happening in the graph so that you will not forget to consider them before placing orders. This set of tools is a simplified version of Graph Reader Pro for TradingView customized for planning your investments in forex. These parameters include:
* Automatic CC59 counting that compares the close of the right price bar to that of left price bar in a group of 5 consecutive bars (ignoring 3 bars in the middle). If the right bar closed higher, the count positive number would be printed above the bar. If the right bar closed lower, the count negative number would be printed below the bar. Nine consecutive series of up counts will define the lowest price as CC59 support light blue line and nine consecutive series of down counts will define the highest price as CC59 resistance orange line. The counted numbers, support and resistance lines are automatically printed on the graph if enabled.
* Draw a reconfigurable simple moving average ( MySMA ) white line. The default setting is SMA3.
* Draw the high and low of the previous day green lines, if enabled. The Previous Day's High and Low are often used as reversal levels in the few future days.
* Draw a popular SMA13 red line.
* Draw a Pullback level pink line near the beginning of a possible new trend.
* Draw High Of the Day and Low of the Day yellow lines for the most recent high and low levels of today.
* Paint the background areas with active Forex trading of Asian, London, and New York sessions, if enabled.
* Print "Working High" and "Working Low" when the price hits previous day's High and Low levels.
* Print "MMM" when there is a possible Market Maker's Manipulation (price bar range is larger than recent average value by a reconfigurable factor, 3 times by default).
* Print "RSI>70" and "RSI<70" for RSI (14) that crosses above 70 % and below 70 %.
* Print "RSI<30" and "RSI>30" for RSI (14) that crosses below 30 % and above 30 %.
* Print "Max" and "Min" for local maximum and local minimum bars.
* Print "Gap" when there is a gap between neighboring price bars. The opened gaps are often closed later on. Hence, they are milestones for the price to come back and close them up.
* Print "MACD>Sig" and "MACDMySMA" and "C Dark".
For free TradingView plan, you can add two more indicators to the chart. That means you may add RSI and MACD indicators with same parameters as those setup in Honeybee59-forex to your graph. DrGraph regularly publishes his educational ideas on using features provided in Honeybee59-forex for profitable investments. You can follow him for how to use the tools in trading forex, and crypto currencies.

Honeybee59-forex 1.0Honeybee59-forex 1.0 for TradingView gives you abilities to see the stories hiding in the graphs of forex, and crypto currency markets. It counts CC59 and creates respectable support and resistance levels as well as marks and reminds you about important parameters that are happening in the graph so that you will not forget to consider them before placing orders. This set of tools is a simplified version of Graph Reader Pro for TradingView customized for planning your investments in stocks. This set of tools is a simplified version of Graph Reader Pro for TradingView customized for planning your investments in forex. These parameters include:
* Automatic CC59 counting that compares the close of the right price bar to that of left price bar in a group of 5 consecutive bars (ignoring 3 bars in the middle). If the right bar closed higher, the count positive number would be printed above the bar. If the right bar closed lower, the count negative number would be printed below the bar. Nine consecutive series of up counts will define the lowest price as CC59 support line and nine consecutive series of down counts will define the highest price as CC59 resistance line. The counted numbers, support and resistance lines are automatically printed on the graph if enabled.
* Draw a reconfigurable simple moving average ( MySMA ) yellow line. The default setting is SMA3.
* Draw the high and low levels of the previous day (green), if enabled. The Previous Day's High and Low are often used as reversal levels in the few future days.
* Draw a popular SMA13 line (light blue).
* Draw a Pullback level line (pink) near the beginning of a possible new trend.
* Draw High Of the Day and Low of the Day (yellow) for the most recent high and low levels of today.
* Paint the background areas with active Forex trading of Asian, London, and New York sessions, if enabled.
* Print "Working High" and "Working Low" when the price hits previous day's High and Low levels.
* Print "MMM" when there is a possible Market Maker's Manipulation (price bar range is larger than recent average value by a reconfigurable factor, 3 times by default).
* Print "RSI>70" and "RSI<70" for RSI(14) that crosses above 70 % and below 70 %.
* Print "RSI<30" and "RSI>30" for RSI(14) that crosses below 30 % and above 30 %.
* Print "Max" and "Min" for local maximum and local minimum bars.
* Print "Gap" when there is a gap between neighboring price bars. The opened gaps are often closed later on. Hence, they are milestones for the price to come back and close them up.
* Print "MACD>Sig" and "MACDMySMA" and "C Dark".
For free TradingView plan, you can add two more indicators to the chart. That means you may add RSI and MACD indicators with same parameters as those setup in Honeybee59-forex to your graph. DrGraph regularly publishes his educational ideas on using features provided in Honeybee59-forex for profitable investments. You can follow him for how to use the tools in trading forex, and crypto currencies.
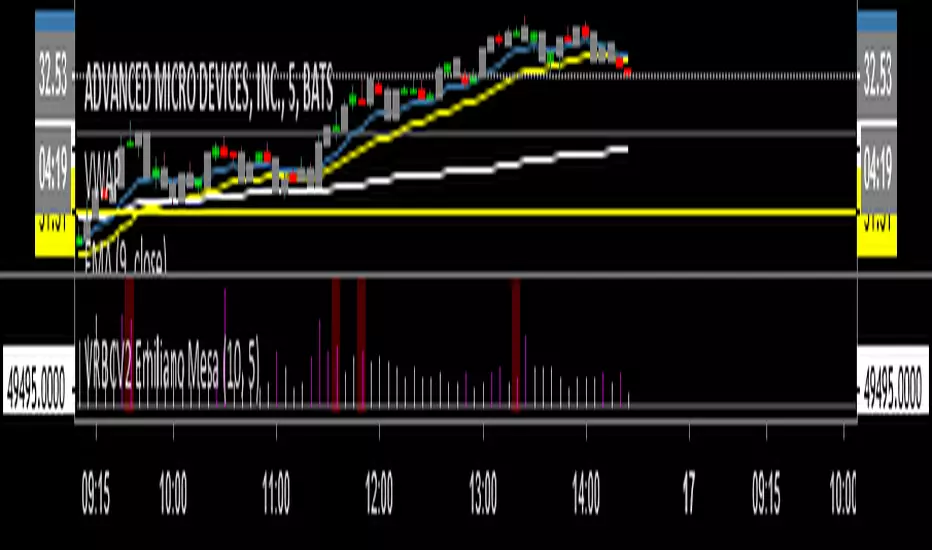
Manipulation IndicatorThis indicator is based on SMA, EMA, Volume, Price Action and more! All in order to find where the BIG BEARS & BIG BULLS are at! This big fishes are able to add huge ammounts of volume in the direction they want, and move the prices. Fact is this indicator shows if the big fish is either a bull or a bear, best entries, targets, exits, and more!
Trade with the trend, not against it
Emiliano Mesa Uribe
Inquires: emilianomesauribe2000@live.com
How it Works?
When the oscillator turns the background red a BIG BEAR has been found. When it turns Green a powerfull bull has been found, furthermore the blue histogram shows high ammount of volume.
The indicator has been tested on 5 min stocks. And with the default values.