High Low Index SPY Top 40Modification from original code for "High Low Index" by © LonesomeTheBlue
- Made modification specifically for Top 40 AMEX:SPY holdings
- Added Market sentiment histogram (Total count green vs red), and SMA line for it
- Added arrows for peaks and dips on High Low Index and Market Sentiment MA
Idea behind this indicator is that SPY should follow the overall sentiment of its top holdings. I believe this bring great value to SPY traders.
Enjoy~!
Marketsentiment

Volume Profile and Volume Indicator by DGTVolume Profile (also known as Price by Volume) is an charting study that displays trading activity over a specified time period at specific price levels. It is plotted as a horizontal histogram on the finacial isntrumnet's chart that highlights the trader's interest at specific price levels.
The histogram is used by traders to predict areas of support and resistance. Price levels where the traded volume is high could be assumed as support and resistance levels.
Price may experience difficulty moving above or below areas with large bars. Usually there is a great deal of activity on both the buy and sell side and the market stays at that price level for a great deal of time
It is advised to use volume profile in conjunction with other forms of technical analysis to maximize the odds of success
Light version of Volume Profile is added to Price Action - Support & Resistance by DGT

Moving Average Suite + VWAP + TICKThis indicator combines some of the commonly used moving averages, VWAP, and TICK sentiment, all of which are useful for all types of trading
By default, this indicator includes:
- 21/50/100/200 period smoothed simple moving average
- great for determining trends
- also act as support / resistance line for price
- 9 period exponential moving average
- fast trend / direction indicator
- Volume Weighted Average Price
- no explanation required
- $TICK sentiment as background fill
- overall market sentiment and direction
- +/- 500 levels are colored green/red and are usually indication of institutional order flow --> critical for trading indexes such as SPY or QQQ
- deep green/red background indicates +/-1000 on the $TICK, which are usually associated with overbought or oversold

BTC Health (OHLC and TEMA)The "health" (ie, price trend) of Bitcoin has a major influence on the whole cryptocurrency market. Therefore, it can be useful to check the price and trend of BTC prior to entering a new position. This indicator displays BTC candles plus a fast & slow TEMA below the primary chart, so you can check how BTC is behaving.
BTC quote is from BINANCE, using the timeframe of the main chart. TEMA periods can be customized.

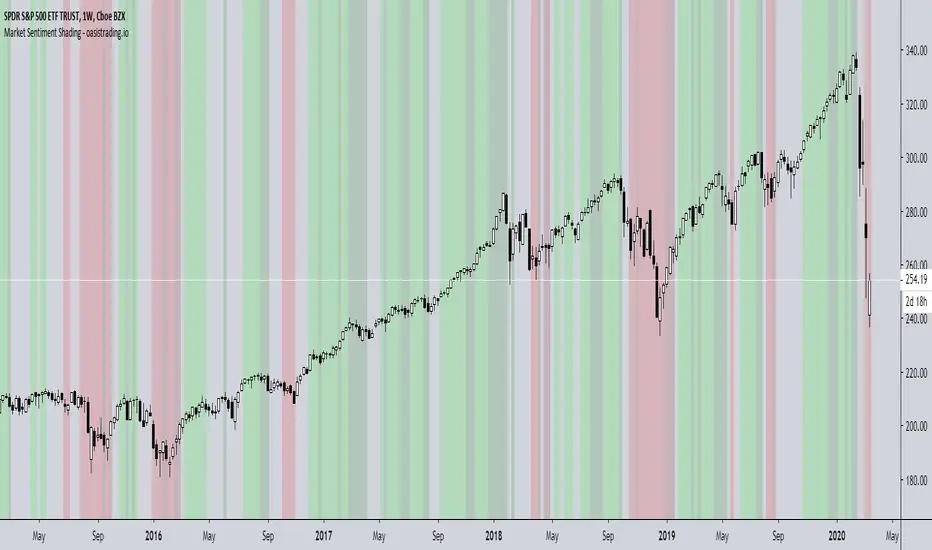
Market Sentiment ShadingThe Market Sentiment Shading Indicator shades the background of the asset based on signals from the DBT MoMo and Oasis Trading Suite. This indicator was designed to make it very obvious which direction the trend is moving and to keep the trader focused on following trend.
There are four different shades:
Dark Green = Bull
Light Green = Strong Bull
Dark Red = Bear
Light Red = Strong Bear
This is a free add-on indicator to traders with access to the DBT MoMo and Oasis Trading Suite and Bundle Package.
For Access or Questions: Private message us. Thank you.
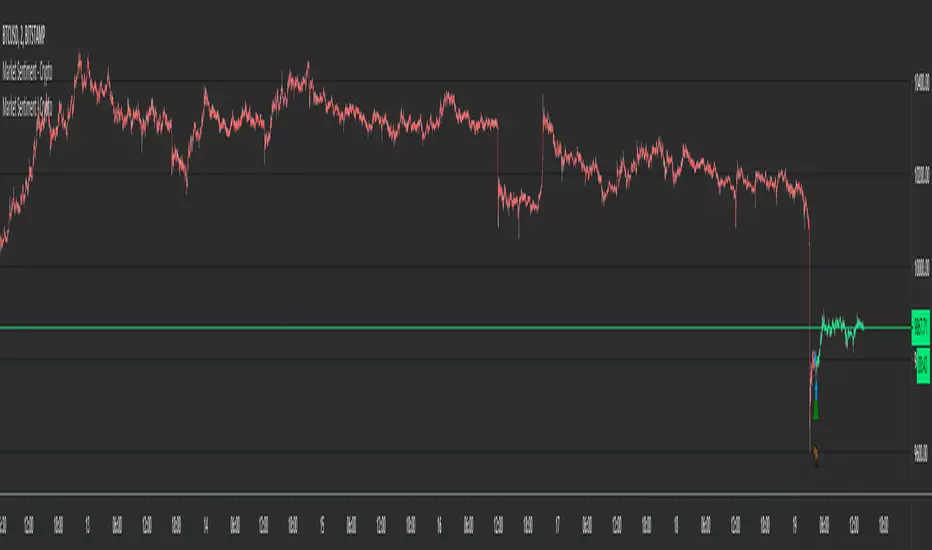
Market Sentiment - CryptoMarket Sentiment - Crypto
This is a market sentiment indicator.
When there is greed - it is good to go Short , when there is fear - go Long .
- The indicator can be used as a trend detection tool, greatly increasing the chance of being on the right side of the market.
- It directly shows the change in trend with Buy and Sell marks on the chart.
- Using it as a standalone is possible, but don't forget about Risk Management .
- Alerts are available.
- It works for Crypto only, showing the change in market sentiment for Bitcoin and Ethereum.
The same results are shown on all timeframes.
Higher timeframes may miss some small changes in trend because they may happen intra-bar. Lower timeframes are good for higher precision.
The indicator can be used on any chart, but it will show data relevant only to Crypto (Bitcoin and Ethereum).