McGinley Dynamic FixedIgnores first x amount of bars to include in the calculation to prevent McGinley Dynamic from staying a flat line.
Usage:
The length is equal to 60% of regular length, for ex. 30EMA is input as 18 length
Trend tool, not ideal as a signal tool
Dinamica di McGinley
MA Study: Different Types and More [NeoButane]A study of moving averages that utilizes different tricks I've learned to optimize them. Included is Bollinger Bands, Guppy (GMMA) and Super Guppy.
The method used to make it MtF should be more precise and smoother than regular MtF methods that use the security function. For intraday timeframes, each number represents each hour, with 24 equal to 1 day. For daily, 3 is 3 day, for weekly, 4 is the 4 weekly, etc. If you're on a higher timeframe than the one selected, the length will not change.
Log-space is used to make calculations work on many cryptos. The rules for color changing Guppy is changed to make it not as choppy on MAs other than EMA. Note that length does not affect SWMA and VWAP and source does not affect VWAP.
A short summary of each moving average can be found here: medium.com
List of included MAs:
ALMA: Arnaud Legoux
Double EMA
EMA: Exponential
Hull MA
KAMA: Kaufman Adaptive
Linear Regression Curve
LSMA: Least Squares
SMA: Simple
SMMA/RMA: Smoothed/Running
SWMA: Symm. Weighted
TMA: Triangular
Triple EMA
VWMA: Volume Weighted
WMA: Weighted
ZLEMA: Zero Lag
VWAP: Vol Weighted Average
Welles Wilder MA

Customizable Multiple Moving AveragesCustomizable Multiple Moving Averages - more than twenty movings available in one script!
Besides source/period customization you can specify one of the following moving averages for every plot:
ALMA (Arnaud Legoux)
ARSI (Adaptive RSI)
DEMA (Double Exponential)
EMA (Exponential)
FRAMA (Fractal Adaptive)
HMA (Hull)
LSQMA (Least Squares)
LWMA (Linear Weighted)
MD (McGinley Dynamic)
REMA (Regularized Exponential)
RMA (EMA with alpha = length - 1)
SMA (Simple)
SMMA (Smoothed)
TEMA (Triple Exponential)
TMA (Triangular)
T3
VIDYA (Variable Index Dynamic)
VWMA (Volume Weighted)
WMA (Weighted)
WWMA (Welles Wilder’s Moving Average, EMA with alpha = 1 / length)
ZLEMA (Zero Lag Exponential)

MTF Polarity Grid [DW]This is an experimental study designed to track directional polarities across multiple timeframes and express them as a simple two color grid.
The polarity in this calculation is determined by divergence between a fast and slow McGinley Dynamic.
Your current resolution's polarity is the top row, the rows below are are for higher timeframes of your choice.

Dynamic Range Channel [DW]This is an experimental study that utilizes Kaufman's Adaptive Moving Average and the McGinley Dynamic.
First, a fast and slow KAMA based McGinley Dynamic are calculated. The divergence between them is used to indicate wave direction.
The channel's bounds are calculated by taking the highest high and lowest low of the slow McGinley Dynamic over a specified channel period.
The dynamic midline is calculated by taking the mean of the highest and lowest values over the specified channel period.
Custom bar colors are included.
Also includes Williams Fractals for additional confirmation signals.

Idō Heikin Ichimoku [DW]This is an experimental study inspired by Goichi Hosoda's Ichimoku Kinkō Hyō.
In this study, a McGinley Dynamic replaces the Tenkan-Sen and Kaufman's Adaptive Moving Average replaces the Kijun-Sen.
The cloud is calculated by taking the mean of the highest high and lowest low, adding a golden mean standard deviation above and below, and offsetting it over the specified period.
The lagging span is calculated by offsetting the closing price by the same amount as the cloud period.

MgGinley Dynamic Divergence [DW]This is an experimental study designed to visualize momentum and average range by expressing divergences between price and a McGinley Dynamic as a percentage.

Disparity Index [DW]This is an iteration of Steve Nison's Disparity Index that includes 5 different moving average types to choose from.
Smooth Regression Bands [DW]This is an experimental study using Kaufman Adaptive Moving Average (KAMA), ATR Decay, Linear Regression Bands, and McGinley Dynamic smoothing.

Fractal Adaptive Moving Average Bands [DW]This is an experimental variation of Bollinger Bands using a Fractal Adaptive Moving Average as the band source, then smoothed using the McGinley Dynamic formula.

Chaos 2.0This is pure chaos!
I just wanted 1 thing I can put on a chart to try to get a clearer picture of what is going on (and not take up all the indicator spaces a free user is allowed haha)
Many things going on from so many different users
honestly I'm sorry I cant shout out everyone whose code I have ever read and used in another project just for the sake of learning more about pinescript!
As a way of shouting everyone out! (and giving out my most useful and configurable system)
I give you... CHAOS
I originally got an Alligator, AO, and Fractal script from a user ChaosTrader, then realized I love using averages!
I added the MESA (lazybear?) and the McGinley Dynamic Range (sry idk) and a simple 233 SMA.
I also found about something called the www.prorealcode.com another user had created for Pinescript.
I really liked that script so I adapted it to do the same kind of signal printing for circles and squares (crosses and series)
Check it out tell me what you think and how I can make it better for everyone!
thanks all!
Snoop

McGinley Dynamic AverageUnlike moving averages such as Simple Moving Average or Exponential Moving Average, McGinley Dynamic avoids of most whipsaws and it rapidly moves up or down according to a quickly changing market. It needs no adjusting because it is dynamic and it adjusts itself.
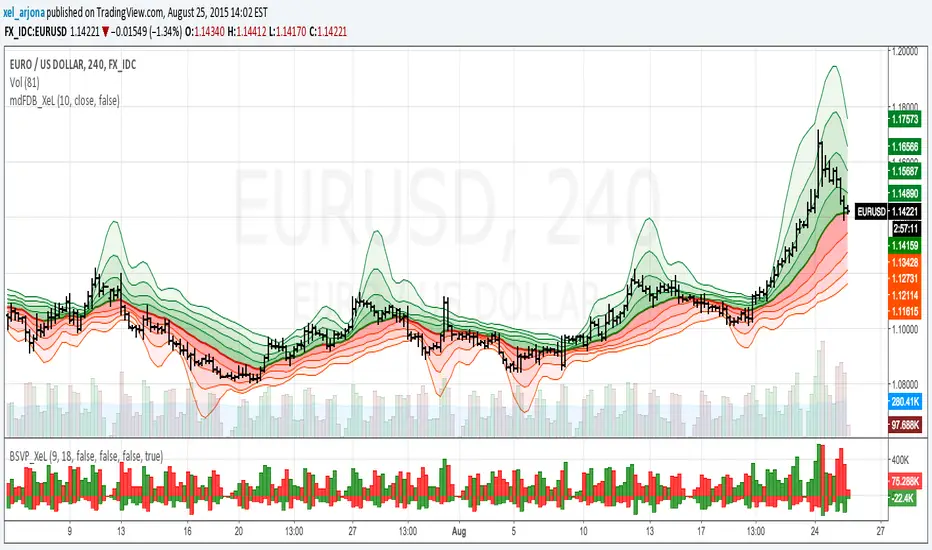
McGinley Dynamic with FRACTAL DEVIATION BANDS by @XeL_ArjonaMcGINLEY DYNAMIC with FRACTAL DEVIATION BANDS.
Ver. 1.0.beta.25.08.2015
By Ricardo M Arjona @XeL_Arjona
DISCLAIMER
The Following indicator/code IS NOT intended to be a formal investment advice or recommendation by the author, nor should be construed as such. Users will be fully responsible by their use regarding their own trading vehicles/assets. -- The embedded code and ideas within this work are FREELY AND PUBLICLY available on the Web for NON LUCRATIVE ACTIVITIES and must remain as is.
WHAT IS THIS?
This is my first adaptation of the FRACTAL DEVIATION BANDS to the "McGinley Dynamic Line". Be advised that the nature of this line tend to need some adjustments at the "Smooth Factor" if you see a flat line with tiny values.
Pine Script code MOD's and adaptations by @XeL_Arjona with special mention in regard of:
Morphic Numbers: (PHI & Plastic) Pine Script adaptation from it's algebraic generation formulas by @XeL_Arjona.
FRACTAL DEVIATION BANDS: main idea by @XeL_Arjona
ALL NEW IDEAS OR MODIFICATIONS to these indicator(s) are Welcome in favor to deploy a better and more accurate readings. I will be very glad to be notified at Twitter or TradingVew accounts at: @XeL_Arjona. Any important addition to this work MUST REMAIN PUBLIC by means of CreativeCommons CC & TradingView.
2015