Extreme Entry with Mean Reversion and Trend FilterThis non-repainting indicator is an improved version of my previous work, a more versatile tool designed to provide traders with dynamic and adaptive entry signals while incorporating a mean reversion and trend filtering mechanism. By combining RSI overbought/oversold, regular divergence and confirmatory momentum oscillator such as CCI or MOM, this indicator generates more precise and timely signals for entering trades.
The indicator offers a comprehensive set of entry conditions for both Buy and Sell entries:
• For Buy entries, it checks for oversold conditions based on RSI levels, and detects bullish divergence patterns while oversold and it identifies upward crossovers in the selected entry signal source (CCI or Momentum).
• Similarly, for Sell entries, it identifies downward crossovers of the CCI or Mom, after the recent overbought conditions, and bearish divergence patterns inside the overbought RSI.
To refine the entry signals even further, the indicator utilizes a mean reversion filter. Traders can choose to display signals that occur inside or outside the upper and lower mean reversion bands:
• Range Entries are indicating potential buying opportunities near the lower band and selling opportunities near the upper band. This is based on the concept of mean reversion, which suggests that prices tend to return to the average when they reach the upper or lower bands. By focusing on these signals, traders can take advantage of price movements that have a higher probability of reversing towards the mean.
• Extreme Entries, on the other hand, represent signals that occur outside of the bands, signaling potential pullbacks during strong trends. By entering positions only at extreme highs or lows, traders can avoid getting caught in the middle of the trend. This approach helps traders capitalize more favorable trading opportunities which have a high reward-risk ratio.
Trend Filter acts as a directional bias for the entry signals. When enabled, long and short entry conditions are filtered based on the relationship between the closing price and the EMA.
Traders have the flexibility to customize, tweak the indicator filter and values in the settings according to their preferences strategies and traded assets, tailoring the signals to their specific needs. The script sets alert conditions to trigger alerts for buy, sell, or both entry signals. This indicator can be used in conjunction with price action or other technical analysis tools for confirmation and better trading decisions.
I created this indicator for my own use, and I share this for informational purposes only. It does not constitute financial advice so use at your own risk and consider your financial situation before making any trading decisions. The indicator's accuracy is not guaranteed, and past performance is not indicative of future results.
I appreciate your feedback on this indicator. As I am new to script development, I am open to comments and suggestions to improve it. If you encounter any issues while using this indicator, please let me know in the comments section. If you find it helpful, I kindly ask for your support in boosting it. Thank you for your cooperation.
Meanreversion

Reversion Zone IndexThe Reversion Zone Index (RZI) is an indicator that combines the Commodity Channel Index (CCI), Choppiness Index (CI), and Bollinger Bands Percentage (BBPct) to identify mean reversion signals in the market. It is plotted as an Exponential Moving Average (EMA) smoothed oscillator with overbought and oversold zones, and mean reversion signals are represented by red and green arrows.
The three indicators are combined to benefit from their complementary aspects and create a more comprehensive view of mean reversion conditions. Here's a brief overview of each indicator's benefits:
1. Commodity Channel Index (CCI): CCI measures the current price level relative to its average over a specified period. It helps identify overbought and oversold conditions, as well as potential trend retracements. By incorporating CCI, the RZI gains insights into momentum and potential turning points.
2. Choppiness Index (CI): CI quantifies the market's choppiness or trendiness by analyzing the range between the highest high and lowest low over a specific period. It indicates whether the market is in a trending or ranging phase. CI provides valuable information about the market state, which can be useful in mean reversion analysis.
3. Bollinger Bands Percentage (BBPct): BBPct measures the current price's position relative to the Bollinger Bands. It calculates the percentage difference between the current price and the bands, identifying potential overbought or oversold conditions. BBPct helps gauge the market's deviation from its typical behavior and highlights potential reversal opportunities.
The RZI combines the three indicators by taking an average of their values and applying further calculations. It smooths the combined oscillator using an EMA to reduce noise and enhance the visibility of the trends. Smoothing with EMA provides a more responsive representation of the overall trend and helps filter out short-term fluctuations.
The overbought and oversold zones are marked on the chart as reference levels. When the combined oscillator is above the overbought zone or below the oversold zone, it suggests a potential mean reversion signal. Red and green arrows are displayed to visually indicate these mean retracement signals.
The RZI is a valuable tool for identifying mean reversion opportunities in the market. It incorporates multiple indicators, each providing unique insights into different aspects of mean reversion, such as momentum, volatility, and price positioning. Traders can use this indicator to spot potential turning points and time their trades accordingly.

ProfitAlgoOverview
ProfitAlgo is a powerful and intuitive trading tool specifically developed to cater to the requirements of both beginners and experienced traders. It is designed to function in every timeframe and on all cryptocurrencies, stocks, indices, forex, futures, currencies, ETF's, energy and commodities. This innovative tool provides real-time signals, comprehensive trend analysis, and advanced risk management features, making it an indispensable asset for traders of all levels. This cutting-edge tool generates 'BUY' and 'SELL' signals, complemented by an array of robust analytical tools. Empower your trading analysis with this all-in-one solution and add to your arsenal of indicators to make well-informed decisions.
This algorithm incorporates a sophisticated Fourier smoothing technique to effectively filter price data, reduce noise and reveal underlying patterns and trends. By utilizing multiple price series data and incorporating Price Volume Trend, it leverages volume analysis and price movement patterns. Furthermore, the algorithm employs relative and simple moving average calculations to enhance signal clarity and filter out outliers, resulting in a more refined and robust indicator.
Features
Buy/Sell signals: Visually illustrated by 'BUY' and 'SELL' labels, these signals provide indications to traders about optimal times to enter or exit positions in the market based on the particular asset they are trading. Traders may want to enter long positions when buy signals appear, and enter short positions when 'SELL' signals appear.
Stop Loss/Take Profit Levels: Stop loss and take profit levels are predefined price thresholds that allow traders to automatically exit trades to limit losses or secure profits, respectively. Stop loss and take profit levels are visually depicted through three dotted lines on the trading chart, including the entry price, take profit (TP), and stop loss (SL). Additionally, a table displays the corresponding price entries for all three levels, providing a comprehensive overview of the trade. Traders can effectively manage their risk and optimize their trading by implementing predefined threshold settings and establishing take profit levels, thus safeguarding their profits using a strategic approach.
Support and Resistance Levels: Support and resistance levels are key price levels in the market that act as barriers or turning points for the price movement of an asset. Traders utilize these levels to identify potential areas of buying and selling opportunities. These can be depicted as red (resistance) and green (support) horizontal lines. These levels can serve as valuable complements to stop/loss and take profit levels, providing confirmation for profit-taking opportunities and facilitating effective risk management. Moreover, they can synergistically work alongside the price lines to identify potential reversal zones by visualizing market highs/lows in conjunction with areas of supply & demand.
Moving Average Bands: Moving average bands, plotted alongside the price data, dynamically change color based on the prevailing trend, with red indicating a downtrend and green representing an uptrend. This visual tool provides valuable insights to users, allowing them to quickly identify and interpret market trends. Integrating Moving Average bands with our buy/sell signals offers added confidence in identifying market trends, enabling traders to seek validation and enhance their decision-making process.
Trend Table: The trend table provides real-time information on the current trend of an asset, displaying three distinct outputs: "Uptrend," "Downtrend," and "Ranging Trend." This valuable tool enables users to assess the live trend of an asset, which may differ from the buy/sell signals. The primary objective of this feature is to analyze real-time trends in both ranging and trending market conditions. While the current signal may indicate a 'BUY' signal, the table can present an alternative output, providing valuable insights for traders and investors.
Price Lines: Price lines are depicted as two parallel grey lines running alongside the price data, representing the highs and lows of the market. This visual tool is utilized to identify patterns of higher highs and lower lows, enabling traders to gain insights into the overall trend and potential reversals in the market. When used in conjunction with our signals, MA bands and trend table, it may reinforce your interpretation of the underlying trend as well as provide insights into the trend strength.
*Note: These features are customizable via the settings menu in TradingView.
Calculations
How are buy/sell signals calculated?
The buy and sell signals are generated through a comprehensive calculation process that encompasses various types of analysis techniques. With permission from the author, wbburgin's Fourier transform is utilized to filter and extract relevant information from the price data, removing noise from the signals (filter is only applied in this feature). The buy and sell conditions are calculated based on a combination of volume-based analysis, and price movement patterns, employed to assess the direction and strength of market trends. The combination aims to produce a comprehensive view of both volume-based and price-based market dynamics. By integrating these analysis techniques, traders can gain insights into the relationship between volume, price, and market trends. This combined approach, as well as Fourier smoothing, can help identify potential market reversals, confirm trend strength, produce less noisy data and provide additional confirmation signals for trading decisions. By considering the insights provided by this analysis, the algorithm determines the appropriate actions, signaling the opportunities to enter or exit positions in the market. In summary, these calculations aim to identify favorable trading opportunities by considering factors such as trend strength, volume dynamics, and price patterns, ultimately assisting traders in making well-informed decisions in the market.
How are stop/loss and take/profit levels calculated?
The stop loss and take profit levels are calculated using a combination of technical factors, including the Average True Range (ATR) and Exponential Moving Average (EMA). The rationale for this combination is to enable dynamic risk management and align profit targets with the prevailing market conditions; ATR provides a measure of volatility and risk, while EMA helps identify the underlying trend, allowing for effective stop-loss and take-profit placement. These indicators are utilized to gauge market volatility and determine suitable levels for managing risk and securing potential profits. By incorporating ATR and EMA calculations, the algorithm generates dynamic stop loss and take profit levels that adapt to market conditions.
Calculating support and resistance levels
These levels help identify areas where the price tends to find support (support levels) or encounter resistance (resistance levels). This script utilizes pivot point calculations to determine these significant price levels, which can assist traders in trading decisions regarding potential price reversals, trend continuations, and entry/exit points in their strategies.
What are the moving average bands based on?
The moving average bands, based on VWMA (Volume Weighted Moving Average) calculations using OHLC4 price data, are visualized as unique bands on the chart. VWMA bands are chosen to find trends because they effectively combine volume-weighted calculations with moving averages, providing valuable insights into the strength and direction of price movements. These bands dynamically change color to reflect the prevailing trend. In an uptrend, the bands are represented by a green color, while in a downtrend, they appear in red. The VWMA bands utilize a unique counting method to capture trend movements and potential reversals.
How is the Trend Table calculated?
The underlying trends in the trend table are calculated based on counting methods applied to the VWMA bands. It utilizes specific thresholds to determine different trends, such as "Up Trend," "Down Trend," and "Ranging Trend." These thresholds are used to assess the current trend of the asset and provide valuable insights for traders.
Price Lines Calculation
The price lines are calculated based on the price data. They represent the range of prices, with one line plotted above the closing price and another line plotted below it. The space between these lines is filled to visualize the price volatility. Traders can utilize these lines to identify significant price levels and observe the overall price movement.
Disclaimer:
The information provided in my indicators/strategies/systems is not intended as financial advice. I assume no responsibility for any losses or damages, including loss of profits, resulting from the use of or reliance on such information.
All investments carry risks, and past performance of a security, industry, sector, market, financial product, trading strategy, backtest, or individual's trading does not guarantee future results or returns. Investors bear full responsibility for their investment decisions, which should be based on their own evaluation of financial circumstances, investment objectives, risk tolerance, and liquidity requirements.
Please note that my indicators/strategies/systems are solely for educational purposes! DO NOT request access in the comment's section.

Edri Extreme Points Buy & SellEDRI EXTREME POINTS BUY & SELL INDICATOR
This Buy and Sell (non-repainting) indicator uses signals based on the combined CCI/Momentum and RSI indicators and optional regular divergence.
The idea of the indicator is to look for a potential reversal after the price reached extreme points (overbought or oversold) and signals an entry when the price shows signs of momentum for reversal.
Optionally, it considers finding a divergence while RSI is at the extreme levels to improve the predictability of a possible reversal.
Additionally, the indicator includes a simple Mean Reversion visual on the chart to assist users in identifying extreme price levels and potential reversal opportunities. It features upper and lower bands that can be optionally plotted, showing calculated values where price bounces at those extreme levels.
The purpose of these bands is to help traders avoid getting trapped in the middle of a trend and to guide them to buy low and sell high. (It's important to note that this is purely a visual aid and does not impact the generation of trade signals.)
By utilizing the Mean Reversion bands alongside the entry conditions, traders can gain insights into potential price reversals and make more informed decisions about when to enter or exit trades.
Buy and Sell Entry conditions:
• The indicator looks at the CCI/Momentum indicator to turn positive (if buy) or negative (if sell) after the RSI was overbought or oversold in the recent past.
• It also checks if there is a 3-period regular bullish divergence in the RSI (if buy), or regular bearish divergence (if sell) and consider these in the entry condition.
• If these conditions are met, this indicator suggests that it may be a good time to enter a trade.
In summary this is how this indicator works:
• The indicator takes input settings such as the choice between using CCI or Momentum as the entry signal source, length parameters for CCI/Momentum, RSI levels for overbought and oversold conditions, RSI length, and options to plot mean reversion bands on the chart.
• It calculates the CCI and Momentum and RSI values based on user-defined length..
• It checks for regular bullish and bearish divergences (3 periods) in the RSI if the option is enabled.
• The script plots shapes on the chart to indicate the buy and sell signals based on the entry conditions.
• If the mean reversion bands option is enabled, it calculates the mean reversion, standard deviation, upper band, and lower band values.
• It also plots the upper band, mean reversion line, and lower band on the chart if the mean reversion bands option is enabled.
• This indicator includes alert conditions to generate alerts for the buy and sell signals.
• On top of that, users can opt to use only one alert for both buy and sell signals. (This can save Trading view subscribers with limited alerts.)
Important! Please do not consider everything you read here as financial advice. Additionally, do not rely solely on indicators for making your trading decisions. It is important to note that no indicator or strategy is perfect. Therefore, it is always recommended to backtest everything and practice proper risk management.
I appreciate your feedback on this indicator. As I am new to script development, I am open to comments and suggestions to improve it. If you encounter any issues while using this indicator, please let me know in the comments section. If you find it helpful, I kindly ask for your support in boosting it. Thank you for your cooperation.

Z-Score Heikin-Ashi TransformedThe Z-Score Heikin-Ashi Transformed (𝘡 𝘏-𝘈) indicator is a powerful technical tool that combines the principles of Z-Score and Heikin Ashi to provide traders with a smoothed representation of price movements and a standardized measure of market volatility.
The 𝘡 𝘏-𝘈 indicator applies the Z-Score calculation to price data and then transforms the resulting Z-Scores using the Heikin Ashi technique. Understanding the individual components of Z-Score and Heikin Ashi will provide a foundation for comprehending the methodology and unique features of this indicator.
Z-Score:
Z-Score is a statistical measure that quantifies the distance between a data point and the mean, relative to the standard deviation. It provides a standardized value that allows traders to compare different data points on a common scale. In the context of the 𝘡 𝘏-𝘈 indicator, Z-Score is calculated based on price data, enabling the identification of extreme price movements and the assessment of their significance.
Heikin Ashi:
Heikin Ashi is a popular charting technique that aims to filter out market noise and provide a smoother representation of price trends. It involves calculating each candlestick based on the average of the previous candle's open, close, high, and low prices. This approach results in a chart that reduces the impact of short-term price fluctuations and reveals the underlying trend more clearly.
Methodology:
The 𝘡 𝘏-𝘈 indicator starts by calculating the Z-Score of the price data, which provides a standardized measure of how far each price point deviates from the mean. Next, the resulting Z-Scores are transformed using the Heikin Ashi technique. Each Z-Score value is modified according to the Heikin Ashi formula, which incorporates the average of the previous Heikin Ashi candle's open and close prices. This transformation smooths out the Z-Score values and reduces the impact of short-term price fluctuations, providing a clearer view of market trends.
This tool enables traders to identify significant price movements and assess their relative strength compared to historical data. Positive transformed Z-Scores indicate that prices are above the average, suggesting potential overbought conditions, while negative transformed Z-Scores indicate prices below the average, suggesting potential oversold conditions. Traders can utilize this information to identify potential reversals, confirm trend strength, and generate trading signals.
Utility:
The indicator offers valuable insights into price volatility and trend analysis. By combining the standardized measure of Z-Score with the smoothing effect of Heikin Ashi, traders can make more informed trading decisions and improve their understanding of market dynamics. 𝘡 𝘏-𝘈 can be used in various trading strategies, including identifying overbought or oversold conditions, confirming trend reversals, and establishing entry and exit points.
Note that the 𝘡 𝘏-𝘈 should be used in conjunction with other technical indicators and analysis tools to validate signals and avoid false positives. Additionally, traders are encouraged to conduct thorough backtesting and experimentation with different parameter settings to optimize the effectiveness of the indicator for their specific trading approach.
Key Features:
Optional Reversion Doritos
Adjustable Reversion Threshold
2 Adjustable EMAs
Example Charts:
See Also:
On Balance Volume Heikin-Ashi Transformed
Rough AverageThe Rough Average indicator is a unique technical tool that calculates a modified average to provide insights into market conditions. It incorporates a combination of mathematical operations and existing indicators to offer traders a different perspective on price movements.
The Rough Average indicator aims to capture market dynamics through a specific calculation method. It utilizes two main components: a check for the approximate scale of the price and a profile calculation based on the Relative Strength Index (RSI) of the closing price.
Methodology:
Approximate Scale: The indicator determines the approximate scale of the price by analyzing the magnitude of the closing price. This step involves a mathematical process that identifies the power of 10 that best represents the scale. This function reduces overall lag and gives a better smoothing to the output of the calculation
Profile Calculation: The indicator calculates a profile value by summing the absolute values of the RSI of the closing price over a specified period. The RSI provides insights into the strength or weakness of price movements. The profile calculation considers a range of prices based on the determined scale.
Indicator Calculation:
The Rough Average is derived by applying the Exponential Moving Average (EMA) to the calculated profile. The EMA is a smoothing technique that emphasizes recent price data. The resulting value represents the modified average of the indicator.
Utility:
The Rough Average indicator offers traders an alternative perspective on market conditions. By utilizing a modified average calculation, it can reveal potential trends, reversals, or periods of market strength or weakness. Traders can use the Rough Average to complement their analysis and identify possible trading opportunities.
It is important to note that the effectiveness of the Rough Average indicator may vary depending on the specific market and trading strategy. It is recommended to combine its analysis with other technical indicators and conduct thorough testing before making trading decisions.
Key Features:
Customizable OB\OS Levels
Bar coloring methods: Trend, Reversions, Extremities
Example Charts:

PRICE CHANNEL MEAN REVERSIONThis script is a Fully Automated trading script meant to be used with "Oanda" broker and the plug-ins for algorithmic trading automation.( FOREX ONLY)
This script is meant to capture "MEAN REVERSION " for intraday charts (1hour) preferably and will hold for days / weeks .trading on forex markets.
(The combination of indicators includes a high and low price channel along with a fast moving average)
This script is original in the description of Alan Hulls moving average combined with the high and low closing of price action.
The concept of this mean reversion strategy is to try and capture price exhaustive moves . The moving average is fast and most times remains in the channel. when the moving average overshoots the channel the average price of the instrument is thought to be rising or falling faster then average, indicating a possibility that the instrument may revert (pull back) this strategy aims to capture that pull back.
This strategy uses a higher risk than reward profile to jump in front of market moves (4 risk to 1 reward)
in the likelihood the instrument will revert back (example) 25 pips before it continues 100 pips in the current direction.
This strategy should only be used in markets that you believe are mean reverting at the time of trading otherwise you will be jumping Infront of a possible trend and the price can continue in the trending direction for an unknown specified amount of time.
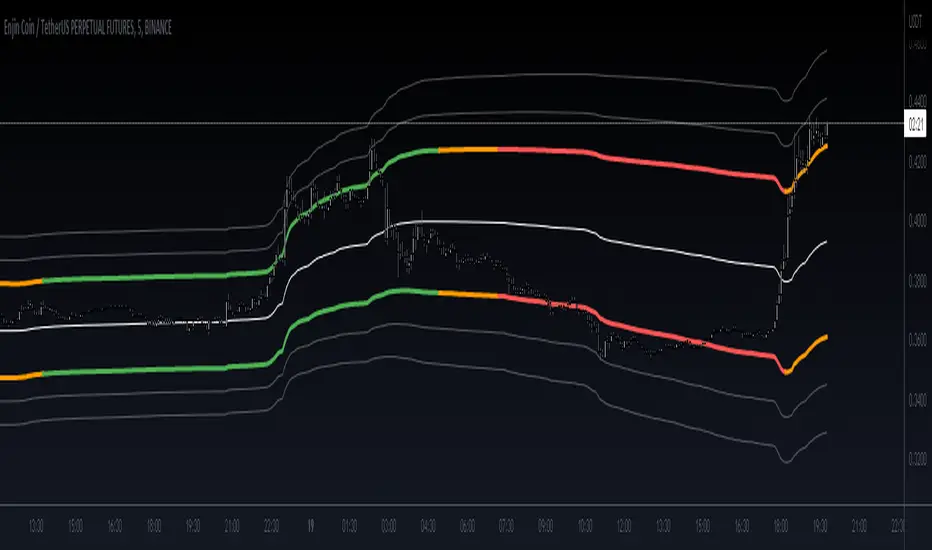
This script uses a (user defined period) fast moving average ( green/red color) and (user defined period) price channel (White/Blue) chosen in the indicator settings menu.
The default parameters are 55 with a (minimum of 1 and maximum of 10000) for the moving average and 50 with a (minimum of 1 and maximum of 10000) for the price channel , the default parameters = roughly 2 days of price action on the (1 hour) chart.
"The default parameters should be kept unless you fully understand the complete strategy"
the upper band (white line) is the highest close of the specified period and the lower band (blue line) is the lowest close of the same period.
When the fast moving average over shoots the price channel (exits) then crosses back into the price channel (enters) it will trigger a long or short trade.
The long signal is given when the the moving average crosses below the low band then crosses back above the low band . The trade long trade will be entered and the trade will exit if the stop loss or profit targets are hit or if the short signal is given the trade will close then reverse.
The short trade will be entered if the fast moving average crosses above the upper band (white line) then crosses back down through the upper band (white line) The trade short trade will be entered and the trade will exit if the stop loss or profit targets are hit or if the long signal is given the trade will close then reverse.
When the trade is entered a red , a blue and green horizontal dotted line will appear on the chart.
the blue line is the strategy entry price , the red line is the stop loss price , and the green line is the take profit price . the colors will invert if the trade is long or short.
(Setting alerts should be done in the indicator settings menu, and the parameters you chose will determine the stop loss/target and the amount of "units = (position size)" you wish to trade for the (forex only) markets. using "alert() function calls only" is the only alert that should be used with this strategy.
(note : when "alert() function calls only" is set two messages will be sent, one closing any open position in the opposite direction and one placing the new order regardless if you are currently in a trade or not)
Trade targets , stoploss and trade position size are a user defined variables entered in the indicator settings menu. (target pips minimum 0 and a maximum of 1000)(stop pips minimum of 0 and maximum of 1000)
Back test date range is included in the script for back testing different data periods.
the back ground will be colored a transparent navy blue if the period you are looking trading is with in the date range( note: to place live trades the end date will need to be in the future)
this is also adjustable in the settings menu
The avoid spread filter is a user defined time in which the spread is typically higher than average, applying this filter avoids trades in the specified time. When this filter is applied there will be a transparent red back ground color in the specified time.
Back test default setting are equivocal to OANDA:NZDUSD
at the time of this publication placing trades with the "Oanda" broker are as follows , NZD units = 3250 equal 2000 USD position size . "Oanda" current leverage is 33.3 to 1 for this particular pair and commission is paid in spread (1.7) pips = 0.55 USD per trade , Margin required for the trade is 60.50 USD , Position sizing = 6.5% of a 1000 USD account. OANDA:NZDUSD
HTF star - trailingDescription:
The HTF - Stars (Highertimeframe Stars) Strategy Script is designed to explore the behavior of a strategy using multiple timeframes. This experimental script focuses on identifying star candle patterns on a chosen higher timeframe and capturing subsequent price movements on a lower timeframe. By leveraging the power of star candle patterns forming on a higher timeframe, this strategy aims to capture potential trading opportunities on a shorter timeframe.
Key Features:
Multiple Timeframe Analysis: The strategy script allows you to be on a lower timeframe while searching for star candle patterns on a higher timeframe using the security function. This approach enables you to take advantage of higher timeframe insights and potentially capture favorable price movements on a shorter timeframe.
Star Candle Pattern Detection: The script identifies star candle patterns on the chosen higher timeframe. After the candle closes, a buy or sell order is executed on the lower timeframe, signaling a potential trading opportunity based on the detected pattern.
Trailing Stop: The strategy utilizes a trailing stop feature to manage trades. The trailing stop is set at a specified ATR (Average True Range) distance above or below the candle closes. This mechanism allows you to capture potential profits if the price moves in the anticipated direction and then reverses.
Mean Reversion Potential: During backtesting, it was observed that shorting stars above the 360 MA (Moving Average) and taking long positions on stars below the 360 MA yielded the most profitable results in the current market conditions. This suggests that star candle patterns in this context may serve as potential mean reversion signals. However, user inputs allow for customization, enabling you to experiment with different trading approaches when a star candle is detected.
Backtesting Feature: The script includes a backtesting feature that uses a percentage of equity, with 1% of equity set as the default. It displays a table presenting various statistics about the strategy's performance, providing valuable insights into its historical results.
Adjustable User Inputs: The script offers multiple adjustable settings, each accompanied by tooltips explaining their functionality. This flexibility allows you to fine-tune the strategy according to your preferences and experiment with different parameters to optimize its performance.
Disclaimer:
The HTF - Stars Strategy Script is provided for experimental and educational purposes only. Trading in the financial markets involves risk, and you should only trade with funds that you can afford to lose. The information presented in this script does not constitute financial advice or investment recommendations. Always conduct your own research and due diligence before making any investment decisions. The creator of this script shall not be held responsible for any losses or damages incurred from the use of this script. Historical performance is not indicative of future results.
Please note that past performance is not necessarily indicative of future results. Trading the markets involves risk, and there is no guarantee that the strategy described will be profitable for you. It is important to thoroughly test the strategy, adapt it to your trading style, and use proper risk management techniques.

Regularized-Moving-Average Oscillator SuiteThe Regularized-MA Oscillator Suite is a versatile indicator that transforms any moving average into an oscillator. It comprises up to 13 different moving average types, including KAMA, T3, and ALMA. This indicator serves as a valuable tool for both trend following and mean reversion strategies, providing traders and investors with enhanced insights into market dynamics.
Methodology:
The Regularized MA Oscillator Suite calculates the moving average (MA) based on user-defined parameters such as length, moving average type, and custom smoothing factors. It then derives the mean and standard deviation of the MA using a normalized period. Finally, it computes the Z-Score by subtracting the mean from the MA and dividing it by the standard deviation.
KAMA (Kaufman's Adaptive Moving Average):
KAMA is a unique moving average type that dynamically adjusts its smoothing period based on market volatility. It adapts to changing market conditions, providing a smoother response during periods of low volatility and a quicker response during periods of high volatility. This allows traders to capture trends effectively while reducing noise.
T3 (Tillson's Exponential Moving Average):
T3 is an exponential moving average that incorporates additional smoothing techniques to reduce lag and provide a more responsive indicator. It aims to maintain a balance between responsiveness and smoothness, allowing traders to identify trend reversals with greater accuracy.
ALMA (Arnaud Legoux Moving Average):
ALMA is a moving average type that utilizes a combination of linear regression and exponential moving average techniques. It offers a unique way of calculating the moving average by providing a smoother and more accurate representation of price trends. ALMA reduces lag and noise, enabling traders to identify trend changes and potential entry or exit points more effectively.
Z-Score:
The Z-Score calculation in the Regularized-MA Oscillator Suite standardizes the values of the moving average. It measures the deviation of each data point from the mean in terms of standard deviations. By normalizing the moving average through the Z-Score, the indicator enables traders to assess the relative position of price in relation to its mean and volatility. This information can be valuable for identifying overbought and oversold conditions, as well as potential trend reversals.
Utility:
The Regularized-MA Oscillator Suite with its unique moving average types and Z-Score calculation offers traders and investors powerful analytical tools. It can be used for trend following strategies by analyzing the oscillator's position relative to the midline. Traders can also employ it as a mean reversion tool by identifying peak values above user-defined deviations. These features assist in identifying potential entry and exit points, enhancing trading decisions and market analysis.
Key Features:
Variety of 13 MA types.
Potential reversal point bubbles.
Bar coloring methods - Trend (Midline cross), Extremities, Reversions, Slope
Example Charts:

David Varadi Intermediate OscillatorThe David Varadi Intermediate Oscillator (DVI) is a composite momentum oscillator designed to generate trading signals based on two key factors: the magnitude of returns over different time windows and the stretch, which measures the relative number of up versus down days. By combining these factors, the DVI aims to provide a reliable and objective assessment of market trends and momentum.
Methodology:
To calculate the DVI, a specific formula is applied. The magnitude component involves averaging smoothed returns over various lengths, weighted according to user-defined parameters. This calculation helps determine the magnitude of price changes. The stretch component follows a similar process, averaging smoothed returns over different lengths to gauge market momentum. Users have the flexibility to adjust the weights and lengths to suit their trading preferences and styles.
Utility:
The DVI offers versatility in its applications. It can be used for both momentum trading and trend analysis due to its smooth and consistent signals. Unlike some other oscillators, the DVI provides longer and uncorrelated signals, allowing traders to effectively combine trend-following and mean-reversion strategies. For example, the DVI is adept at identifying overbought levels above the 200-day moving average, serving as a useful tool for determining exit points during price strength and even potential shorting opportunities. Traders can develop simple trading systems based on the DVI, buying above the 200-day moving average and selling when the DVI exceeds a specified threshold. Conversely, they can consider short positions below the 200-day moving average and cover when the DVI falls below a specific threshold. The DVI's objective approach to analyzing market momentum makes it a valuable resource for traders seeking to identify trading opportunities.
Key Features:
Bar coloring: based on Trend, Extremeties or Reversions
Reversions: Potential reversal points marked with triangles above\below oscillator
Extremity Hues: Highlighting oxcillator reaching traditional OB\OS levels
Example Charts:

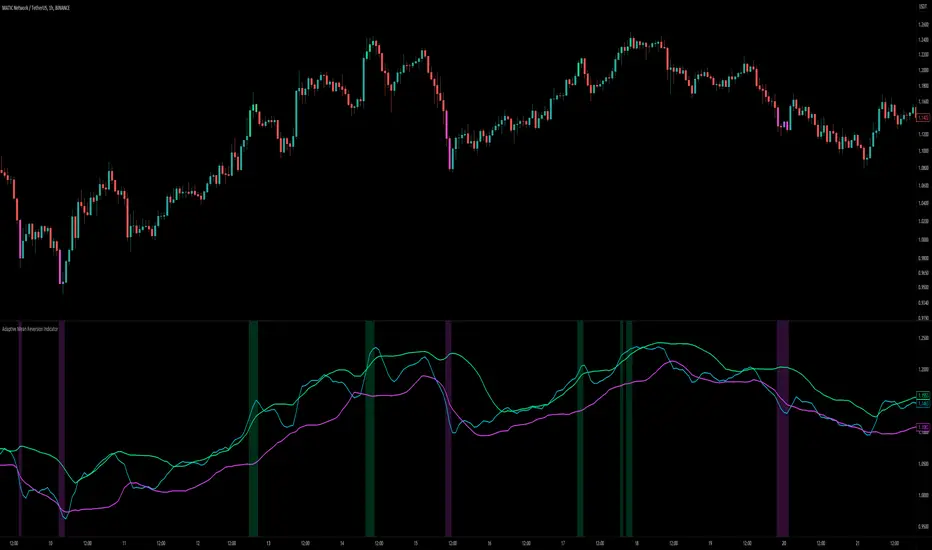
Adaptive Mean Reversion IndicatorThe Adaptive Mean Reversion Indicator is a tool for identifying mean reversion trading opportunities in the market. The indicator employs a dynamic approach by adapting its parameters based on the detected market regime, ensuring optimal performance in different market conditions.
To determine the market regime, the indicator utilizes a volatility threshold. By comparing the average true range (ATR) over a 14-period to the specified threshold, it determines whether the market is trending or ranging. This information is crucial as it sets the foundation for parameter optimization.
The parameter optimization process is an essential step in the indicator's calculation. It dynamically adjusts the lookback period and threshold level based on the identified market regime. In trending markets, a longer lookback period and higher threshold level are chosen to capture extended trends. In ranging markets, a shorter lookback period and lower threshold level are used to identify mean reversion opportunities within a narrower price range.
The mean reversion calculation lies at the core of this indicator. It starts with computing the mean value using the simple moving average (SMA) over the selected lookback period. This represents the average price level. The deviation is then determined by calculating the standard deviation of the closing prices over the same lookback period. The upper and lower bands are derived by adding and subtracting the threshold level multiplied by the deviation from the mean, respectively. These bands serve as dynamic levels that define potential overbought and oversold areas.
In real-time, the indicator's adaptability shines through. If the market is trending, the adaptive mean is set to the calculated mean value. The adaptive upper and lower bands are adjusted by scaling the threshold level with a factor of 0.75. This adjustment allows the indicator to be less sensitive to minor price fluctuations during trending periods, providing more robust mean reversion signals. In ranging market conditions, the regular mean, upper band, and lower band are used as they are more suited to capture mean reversion within a confined price range.
The signal generation component of the indicator identifies potential trading opportunities based on the relationship between the current close price and the adaptive upper and lower bands. If the close price is above the adaptive upper band, it suggests a potential short entry opportunity (-1). Conversely, if the close price is below the adaptive lower band, it indicates a potential long entry opportunity (1). When the close price is within the range defined by the adaptive upper and lower bands, no clear trading signal is generated (0).
To further strengthen the quality of signals, the indicator introduces a confluence condition based on the RSI. When the RSI exceeds the threshold levels of 70 or falls below the threshold level of 30, it indicates a strong momentum condition. By incorporating this confluence condition, the indicator ensures that mean reversion signals align with the prevailing market momentum. It reduces the likelihood of false signals and provides traders with added confidence when entering trades.
The indicator offers alert conditions to notify traders of potential trading opportunities. Alert conditions are set to trigger when a potential long entry signal (1) or a potential short entry signal (-1) aligns with the confluence condition. These alerts allow traders to stay informed about favorable mean reversion setups, even when they are not actively monitoring the charts. By leveraging alerts, traders can efficiently manage their time and take advantage of market opportunities.
To enhance visual interpretation, the indicator incorporates background coloration that provides valuable insights into the prevailing market conditions. When the indicator generates a potential short entry signal (-1) that aligns with the confluence condition, the background color is set to lime. This color suggests a bullish trend that is potentially reaching an exhaustion point and about to revert downwards. Similarly, when the indicator generates a potential long entry signal (1) that aligns with the confluence condition, the background color is set to fuchsia. This color represents a bearish trend that is potentially reaching an exhaustion point and about to revert upwards. By employing background coloration, the indicator enables traders to quickly identify market conditions that may offer mean reversion opportunities with a directional bias.
The indicator further enhances visual clarity by incorporating bar coloring that aligns with the prevailing market conditions and signals. When the indicator generates a potential short entry signal (-1) that aligns with the confluence condition, the bar color is set to lime. This color signifies a bullish trend that is potentially reaching an exhaustion point, indicating a high probability of a downward reversion. Conversely, when the indicator generates a potential long entry signal (1) that aligns with the confluence condition, the bar color is set to fuchsia. This color represents a bearish trend that is potentially reaching an exhaustion point, indicating a high probability of an upward reversion. By using distinct bar colors, the indicator provides traders with a clear visual distinction between bullish and bearish trends, facilitating easier identification of mean reversion opportunities within the context of the broader trend.
While the "Adaptive Mean Reversion Indicator" offers a robust framework for identifying mean reversion opportunities, it's important to remember that no indicator is foolproof. Traders should exercise caution and employ risk management strategies. Additionally, it is recommended to use this indicator in conjunction with other technical analysis tools and fundamental factors to make well-informed trading decisions. Regular backtesting and refinement of the indicator's parameters are crucial to ensure its effectiveness in different market conditions.
Bars Since EMA Touch (BSET)// Description:
Welcome to the "Bars since EMA touch" indicator, designed and developed by StockJustice. This script provides a unique approach to analyzing price movements relative to the Exponential Moving Average (EMA). It offers valuable insights into trend strength and trend duration, allowing traders to make informed decisions.
// How it Works:
The indicator calculates the EMA based on the chosen length, which is customizable through the input settings. Additionally, it calculates the MACD (Moving Average Convergence Divergence) and its signal line to further enhance the analysis.
The script tracks the number of bars since the price touches or crosses the EMA. It provides a histogram plot that represents this count. Positive values indicate bars since the price crossed above the EMA, while negative values indicate bars since the price crossed below the EMA.
The color of the histogram bars adjusts dynamically based on the relationship between the current close price and the EMA. If the close is above the EMA and the bars since EMA touch is greater than zero, the histogram will be colored red if the signal line is above the MACD. If the close is below the EMA and the bars since EMA touch is greater than zero, the histogram will be colored green if the signal line is below the MACD. Otherwise, the histogram bars will be colored blue or white, depending on the direction of the crossover.
The script also calculates percentiles for bullish and bearish trends. These percentiles indicate the proportion of trend durations that exceed a certain threshold, which is set at 20% by default. The percentile plots help identify significant trend durations and gauge their strength relative to the entire trend history.
// Usage:
This indicator can be applied to various markets and timeframes, accommodating different trading strategies. It is suitable for both intraday and swing trading. Traders can use it in conjunction with other technical analysis tools to confirm trade entries, identify trend reversals, or determine potential price targets.
// Input Parameters:
Length of EMA: This parameter allows you to define the length of the Exponential Moving Average used in the calculations. The default value is 9, but feel free to adjust it according to your preferences and trading style.
// Notes on Uniqueness:
The "Bars since EMA touch" indicator stands out from other published scripts due to its comprehensive analysis of trend durations, the use of MACD and its signal line, and the dynamic coloring of the histogram bars based on various conditions. The incorporation of percentiles provides further insights into trend strength. This unique combination of features makes the indicator a powerful tool for traders seeking a deeper understanding of price action.
// Relevance for Technical Analysis and Trading
The "Bars since EMA touch" indicator can be utilized for various aspects of technical analysis, including trend continuation, trend reversal, and identifying potential entry and exit points. Here's how you can apply it in different scenarios:
Trend Continuation:
When the histogram bars show positive values (indicating bars since the price crossed above the EMA), it suggests the presence of an ongoing uptrend. Traders can use this information to confirm the strength of the prevailing trend. If the histogram bars remain positive and the trend continues to unfold, it signals a potential opportunity to stay in the trade or consider adding to existing positions.
Trend Reversal:
Conversely, when the histogram bars show negative values (indicating bars since the price crossed below the EMA), it indicates a potential trend reversal or the beginning of a downtrend. Traders can watch for the histogram bars to transition from positive to negative values, signaling a possible trend reversal. This information can be used as an early indication to exit long positions or consider initiating short positions.
Entry and Exit Points:
Traders can incorporate the "Bars since EMA touch" indicator with other technical analysis tools to identify optimal entry and exit points. For example, when the histogram bars are positive, indicating an ongoing uptrend, traders might consider entering long positions when the price retraces and touches the EMA. This strategy aims to capitalize on potential pullbacks within the overall upward trend.
Conversely, when the histogram bars are negative, indicating a potential downtrend, traders might wait for the price to rally and touch the EMA before considering short positions. This approach seeks to enter short positions during temporary bounces within the overall downward trend.
Confirmation with MACD:
The script also incorporates the MACD and its signal line. Traders can analyze the relationship between the MACD and the signal line to confirm trend signals provided by the histogram bars. When the MACD crosses above the signal line and the histogram bars are positive, it adds further strength to the bullish indication. Similarly, when the MACD crosses below the signal line and the histogram bars are negative, it reinforces the bearish signal.
Responsive Histogram Color Scheme:
The color change of the histogram in the "Bars since EMA touch" indicator is specifically designed to alert traders to potential trend weakness or a shift in market dynamics. When the histogram bars turn red (for uptrends) or green (for downtrends), it signifies a weakening trend as the price approaches or hovers around the EMA. This color change acts as a visual cue, indicating that the trend may be losing momentum or facing resistance. It prompts traders to exercise caution, reassess the market conditions, and consider adjusting their trading strategies accordingly, such as tightening stops, taking partial profits, or preparing for a potential trend reversal.
// Red and Green Horizontal Lines:
The plotted percentile values in the "Bars since EMA touch" indicator hold significant importance as they provide insights into the strength and duration of trends. The percentile lines represent the proportion of trend durations that exceed a certain threshold, which is set at 20% by default.
The "Bull 15% Percentile" plot indicates the percentage of bullish trends that have lasted longer than 20% of the entire trend history. A higher value suggests that a significant portion of bullish trends has surpassed the threshold, indicating the presence of relatively strong and sustained uptrends.
On the other hand, the "Bear 15% Percentile" plot represents the percentage of bearish trends that have persisted beyond 20% of the total bearish trend history. A higher value suggests that a notable proportion of bearish trends has extended beyond the threshold, signifying the presence of pronounced and enduring downtrends.
These percentile lines serve as valuable reference points for traders, as they highlight significant trend durations compared to the overall trend history. They offer insights into the relative strength and duration of the prevailing trends, enabling traders to assess the potential continuation or reversal of the current trend. Additionally, observing changes in the percentile values over time can provide further indications of shifts in market dynamics and trend strength.
By incorporating these percentile lines into their analysis, traders can gain a better understanding of the market's trend characteristics and make more informed trading decisions.
Remember, as with any technical analysis tool, it's essential to consider other factors such as support and resistance levels, volume patterns, and broader market conditions to increase the accuracy of your trading decisions. It's recommended to backtest and validate the indicator's performance before using it in live trading.
NOTE: The 9ema is plotted on the chart simply to visually show how, once contact is made, the histogram stops plotting new bars. This visualization is needed to confirm how the script works.

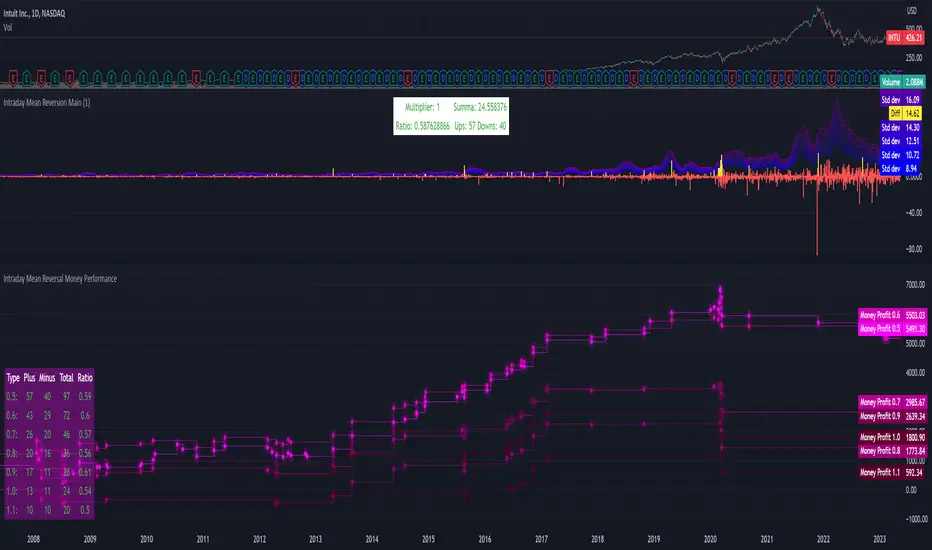
Intraday Mean Reversion Money Performance indicatorThe diagram shows Money Performance when buying stocks for 10 000 at every buy signal from the Intraday Mean Reversion indicator.
The indicator is best used in combination with Intraday Mean Reversion Main Indicator
The rules for trading are: Buy on Open price if the Intraday Mean Reversion Main indicator gives a buy signal. Sell on the daily close price.
According to my knowledge it is not possible to create a PineScript strategy based on these rules, because the indicator is used on Day to Day graph. Therefore this indicator can be used to analyze Money performance of this strategy.
The lines show the performance of the Intraday Mean Reversion Strategy, based on the different levels in the strategy (from 0.5 Standard deviation to 1.1 standard deviation)
Using this indicator it is possible to find stocks that often reverse towards mean after open.
Use this strategy on stocks with high positive performance. Do not use on stocks with negative performance.
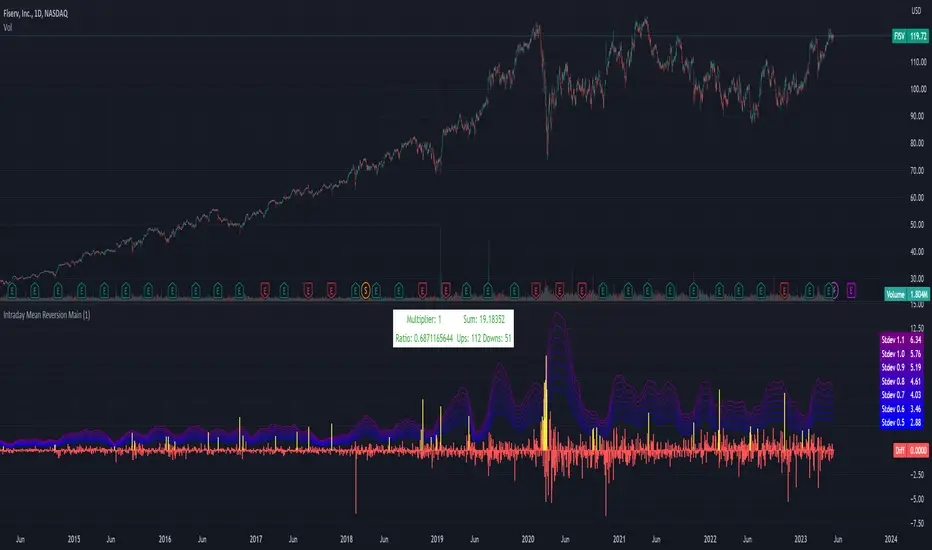
Intraday Mean Reversion MainThe Intraday Mean Reversion Indicator works well on certain stocks. It should be used for day trading stocks but need to be applied on the Day to Day timeframe.
The logic behind the indicator is that stocks that opens substantially lower than yesterdays close, very often bounces back during the day and closes higher than the open price, thus the name Intraday Mean reversal. The stock so to speak, reverses to the mean.
The indicator has 7 levels to choose from:
0.5 * standard deviation
0.6 * standard deviation
0.7 * standard deviation
0.8 * standard deviation
0.9 * standard deviation
1.0 * standard deviation
1.1 * standard deviation
The script can easily be modified to test other levels as well, but according to my experience these levels work the best.
The info box shows the performance of one of these levels, chosen by the user.
Every Yellow bar in the graph shows a buy signal. That is: The stocks open is substantially lower (0.5 - 1.1 standard deviations) than yesterdays close. This means we have a buy signal.
The Multiplier shows which multiplier is chosen, the sum shows the profit following the strategy if ONE stock is bought on every buy signal. The Ratio shows the ratio between winning and losing trades if we followed the strategy historically.
We want to find stocks that have a high ratio and a positive sum. That is More Ups than downs. A ratio over 0.5 is good, but of course we want a margin of safety so, 0.75 is a better choice but harder to find.
If we find a stock that meets our criteria then the strategy will be to buy as early as possible on the open, and sell as close as possible on the close!
[TT] Sectors Dist % From MA- The script shows the distance in percentages from the 200 MA (or any other MA period) , for the 11 SP500 sectors.
- It works based on the current time frames.
Could be useful when working with mean reversion strategies to detect extremes zones and overbought/oversold conditions in the given sectors compared others.

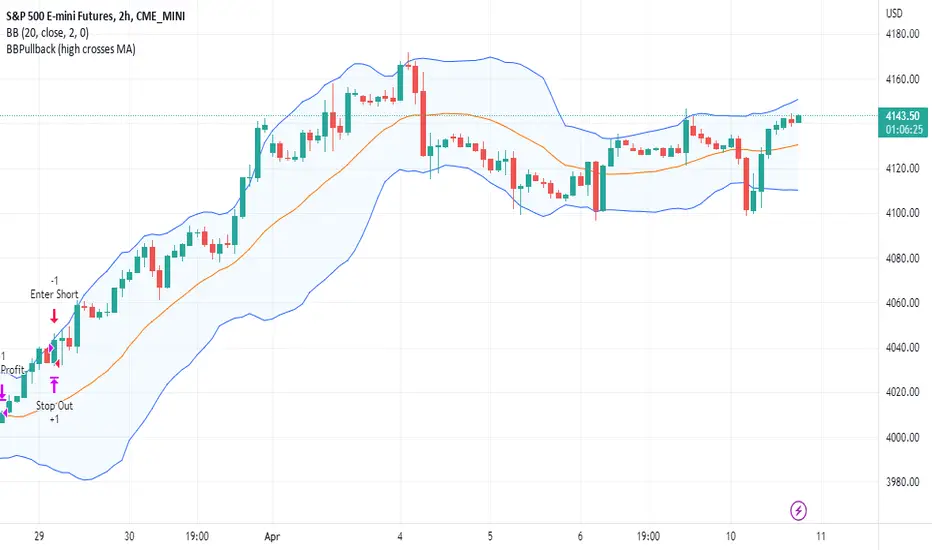
BBPullback1.0.2This is a simple strategy script based on Bollinger Bands pullbacks.
The strategy is simple, as follows:
For LONGS: At the close of any candle, it check to see if this candle is an UP candle where the low broke below the lower Bollinger Band. If so, we call this the trigger candle. For the next bar, we issue a BUY signal if the price breaks above the high of the trigger candle. The stoploss is the low of the trigger candle. We take profit when the price goes above the middle Bollinger Band (the mean/average line).
For SHORTS: At the close of any candle, it check to see if this candle is an DOWN candle where the high broke above the upper Bollinger Band. If so, we call this the trigger candle. For the next bar, we issue a SELL signal if the price breaks below the low of the trigger candle. The stoploss is the high of the trigger candle. We take profit when the price goes below the middle Bollinger Band (the mean/average line).
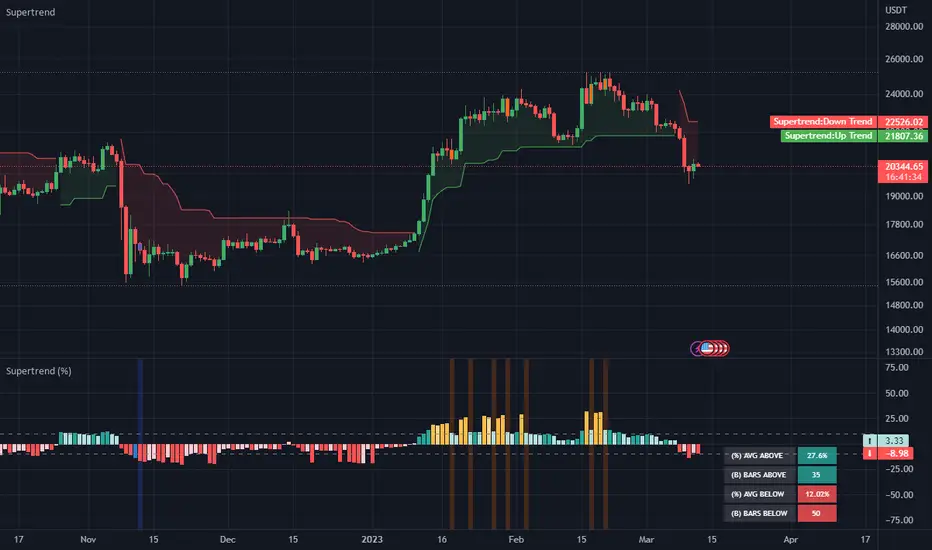
Supertrend Mean Reversion Index [HODLER]This indicator was created primarily as an experiment. While the supertrend can be powerful, in many cases, the trend has already started before the time it's identified, resulting in a price decrease. After conducting my own research, I discovered that the reversal point is often more nearby during the downtrend, rather than at the beginning of the uptrend. Surprisingly, this point is always based on the average percentage below or above the supertrend. The indicator calculates these averages, usually starting below the uptrend point, and in most cases, the trend continues upward from there.
This indicator can be very useful for checking corrections. For example, setting the percentages manually to around 50-60% on BTC 1d, I am impressed by how accurate the indication is. Although there might be other more professional ways to calculate this, I still find it amusing that we can use this indicator to make these calculations as well.
To use the indicator, you will need to set the ATR length and ATR factor, which are self-explanatory. The next settings are the ATR lookback and Percentages Stored. The ATR lookback is the ladder price from which the calculation begins, and Percentages Stored is the maximum number of the highest and lowest percentages from previous data points that are stored to calculate the average percentage.
The supertrend percentage settings can be manually set to adjust your percentage up or down, but if left at 0, it will be calculated automatically based on the above-mentioned settings. You can also set an offset to slightly deviate above or below the average to yield better results. The last supertrend setting is the minimum number of bars that must be considered before checking whether the value is above or below the average.
To filter out some noise, I have added Relative Strength Index (RSI). The values above and below are determined by whether the RSI moving average is above or below certain thresholds.
Please note that this indicator was created for my own research. While it can be very accurate with the right settings, you should always use it in combination with other technical analyses to validate your entry and exit points. If you have any suggestions to improve the indicator, please let me know in the comments. I would really appreciate it!
Quantitative Price Forecasting - The Quant ScienceThis script is a quantitative price forecasting indicator that forecasts price changes for a given asset.
The model aims to forecast future prices by analyzing past data within a selected time period. Mathematical probability is used to calculate whether starting from time X can lead to reaching prices Y1 and Y2. In this context, X represents the current selected time period, Y1 represents the selected percentage decrease, and Y2 represents the selected percentage increase. The probabilities are estimated using the simple average.
The simple average is displayed on the chart, showing in red the periods where the price is below the average and in green the periods where the price is above the average.
This powerful tool not only provides forecasts of future prices but also calculates the distribution of variations around the average. It then takes this information and creates an estimate of the average price variation around the simple average.
Using a mean-reverting logic, buying and selling opportunities are highlighted.
We recommend turning off the display of bars on your chart for a better experience when using this indicator.
Unlock the full potential of your trading strategy with our powerful indicator. By analyzing past price data, it provides accurate forecasts and calculates the probability of reaching specific price targets. Its mean-reverting logic highlights buying and selling opportunities, while the simple moving average displayed on the chart shows periods where the price is above or below the average. Additionally, it estimates the average variation of price around the simple average, giving you valuable insights into price movements. Don't miss out on this valuable tool that can take your trading to the next level

LNL Keltner CandlesLNL Keltner Candles
This indicator plots mean reversion (reversal) arrows with custom painted candles based on the price touch or close above or below keltner channel limits (upper & lower bands). This study was created primarily for swing trading & higher time frames such as daily and weekly. Lower time frames might result in more false signals.
Mean Reversal Arrows:
1. Reversal Arrow Up - If the price drops below the lower band extremes, reversal up is the trigger for a bullish mean reversion.
2. Reversal Arrow Down - Once the price reach the higher band extremes, reversal down is the trigger for a bearish mean reversion.
The Concept of Mean Reversion:
There are just two types of moves in any market: The market is either expanding from the mean or retracing back to the mean. These reversions & epxansions are happening across all types of markets. The goal of this study is to catch the powerful mean reversion from extremes back to the mean. Once the candles light up green / red, it is time to look for the reversal (purple) arrow which triggers the mean reversion setup. Mean reversion is not about catching the next big swing turn to new highs or lows. It is all about the base hits = the mean. So the target here is always the average price. The idea here is to catch the average market ebbs & flows, not the next home run.
What Do I Mean by Mean?
Mean is usually the average price from the last 20-30 bars. Basically something like a 20 MA or Keltner Channel or Bollinger Band midline are really good visual representators of the mean (average price).
Hope it helps.

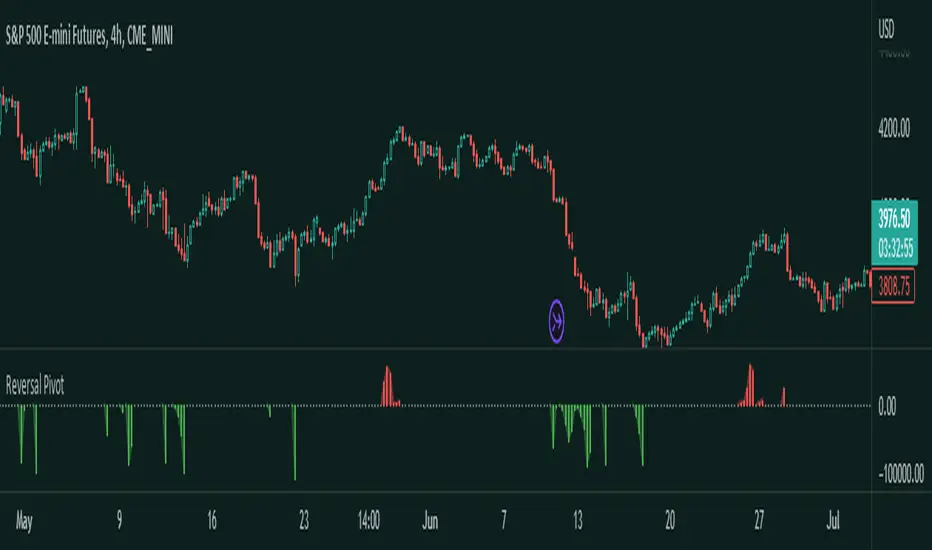
Reversal Pivot
Overview
Introducing the Reversal Pivot indicator - a tool for identifying potential reversal points in price. This algorithm takes into account multiple factors, including price action, volume, and pivot points, to give you a clear and accurate picture of where the market is heading to.
How it works
The indicator gets expansions and the highs and lows and uses the conditions along with pivots to determine whether a reversal is possible or not. Then it gets the volume to determine how strong this chance of reversal is.
How to use
The Reversal Pivot indicator alone shouldn't be used to find reversal points but it helps you get a clear insight on where possible reversals could happen for example, you could use it with mean reversion strategies to find the best entries.
Red bars signal a bearish reversal
Green bars signal a bullish reversal
This here is an example of a long entry if you are trading lets say the mean. You can wait for a bullish reversal on the Histogram plot and then enter, a reversal could happen.
This is an example of a short entry if you are also trading the mean.
Other features
This indicator allows you to customize the colors, and the histogram. If you don't like the histogram then you can change its plot style to whatever you would like.
Try the Reversal Pivot indicator today and find more possible reversal points!
Dual Bollinger Band Mean ReversionSimple but solid mean reversion indicator with sl and tp levels. Most of the code is based on the built in bollinger bands script. Designed for scalping 1-5 minute timeframes.
The indicator consists of two sets of bollinger bands.
Price has to close below the lower (fast) bollinger band, above the moving average of the (slower) bollinger band.
If price now closes above the lower (fast) bb, the indicator draws a label at the open of the next candle (which would be a potential entry point). Take profit becomes the upper bollinger band, stop loss the same distance below the open of the candle.
I've built in a simple backtesting function that calculates the potential win/loss-ratio. Loss and profit levels are 1:1. Exit strategy could be improved on.
Adjusting the lengths depending on the asset proves to be a good idea.
The slower bollinger bands can help to identify ranging markets and/or trends following regular bollinger bands theory.
Feel free to comment with any changes that you'd like to be made.

Cuban's Reversion Bands V2Cuban's Reversion Bands V2
Cubans Reversion Bands, are a great indication of price overextension by using specified standard deviations, extended from a moving average basis line, the Volume Weighted Average Trend.
Reversion Bands V2 builds off the original foundation in a big way but utilizes completely new band logic and a more stable basis line, the stability leads to a more consistent band reversion zones.
The basis line is calculated with volatility metrics and long term range determinants.
The band extension points are then weighted on this basis line with the asset's average extensions taken into consideration to fit each asset individually.
Users gain the ability to customize:
EQ Sensitivity
Band Sensitivity
EQ sensitivity will control the reaction time of the basis line e.g. a comparison of the default 1, and below an increase EQ to 100:
1 EQ Sensitivity (Default)
100 EQ Sensitivity
Band Sensitivity will control the distance of deviation from the basis point, this can be used to fine tune the reversion location which could be useful in higher beta environments.
1 Band Sensitivity
100 Band Sensitivity
As a result of overextension we can take this as a means for a potential market shift, for example, in range bound conditions we expect the market to revert at the given reversion zones in the Cuban Reversion Bands V2.
Failure to revert at a band level, and extension above could signify a change in market structure and lead to a trending environment thus giving us the ability to determine a trending environment.
To Do:
alerts
implement additional confluence via other proprietary tools to increase the signal ratio
Mean Reversion DotsMarkets tend to mean revert. This indicator plots a moving average from a higher time frame (type of MA and length selectable by the user). It then calculates standard deviations in two dimensions:
- Standard deviation of move of price away from this moving average
- Standard deviations of number of bars spent in this extended range
The indicator plots a table in the upper right corner with the % of distance of price from the moving average. It then plots 'mean reversion dots' once price has been 1 or more standard deviations away from the moving average for one or more standard deviations number of bars. The dots change color, becoming more intense, the longer the move persists. Optionally, the user can display the standard deviations in movement away from the moving average as channels, and the user can also select which levels of moves they want to see. Opting to see only more extreme moves will result in fewer signals, but signals that are more likely to imminently result in mean reversion back to the moving average.
In my opinion, this indicator is more likely to be useful for indices, futures, commodities, and select larger cap names.
Combinations I have found that work well for SPX are plotting the 30min 21ema on a 5min chart and the daily 21ema on an hourly chart.
In many cases, once mean reversion dots for an extreme enough move (level 1.3 or 2.2 and above) begin to appear, a trade may be initiated from a support/resistance level. A safer way to use these signals is to consider them as a 'heads up' that the move is overextended, and then look for a buy/sell signal from another indicator to initiate a position.
Note: I borrowed the code for the higher timeframe MA from the below indicator. I added the ability to select type of MA.