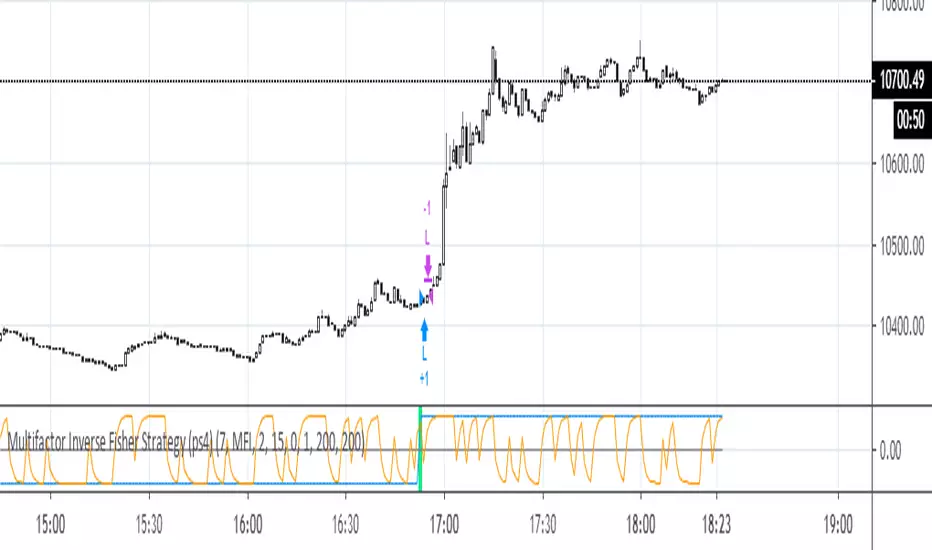
Multifactor Inverse Fisher Strategy (ps4)Best for higher time frames - 30m, 1H, 2H, 3H, 4H, D this strategy uses several factors that are pushed through an Inverse Fisher Transform (IFT). The higher the TF, the better the performance, up to 98%, but the number of deals tends to drop). Middle time frames (5m, 15m) look viable with Scaled Price (Scaled %P) and MFI factors. The factor list can be extended to include cci, stoch, rsi_stoch, emo, macd, cog, dpo, roc, accdist, cctbb, mom, awesome, tva, etc. Some of them need to be rescaled to a 0..100 interval. The IFT produces a value in the -1..1 interval (see: www.mesasoftware.com). This indicator does NOT repaint.
MFI
Simple 𝔇 Oscillators𝔻𝕚𝕧𝕖𝕣𝕘𝕚𝕟𝕘 𝕆𝕤𝕔𝕚𝕝𝕝𝕒𝕥𝕠𝕣𝕤
No Offset's, No delay
There is 6 Oscillators diverging in release version
For micro tf charting -requires manual tune on input menu

MFI and RSI wih (R/H Divergence)Hello Friends,
* RSI + MFI + (Regular/Hidden) Divergence + Bullish/Bearish background colors.
* you can edit your options from indicator settings.

MFI Reloaded @ByPuppyTherapyThe goal was to create a nicer cleaner and yet a practical version of the
MFI indicator. MFI or Money Flow Index is a momentum-based oscillator. It is very similar to the RSI but enhanced with
volume in its calculation.
This version of MFI features :
- Cleaner visualization
- EMA Band Ribbon to see the trend without noise
- Long Term MFI smoothed via T3 that sets the actual trend
- basic TDI like functionality with two bands and Sharkfins / Hooks
- the Sharkfins / Hook signals are generated in the direction of the MFI Trend

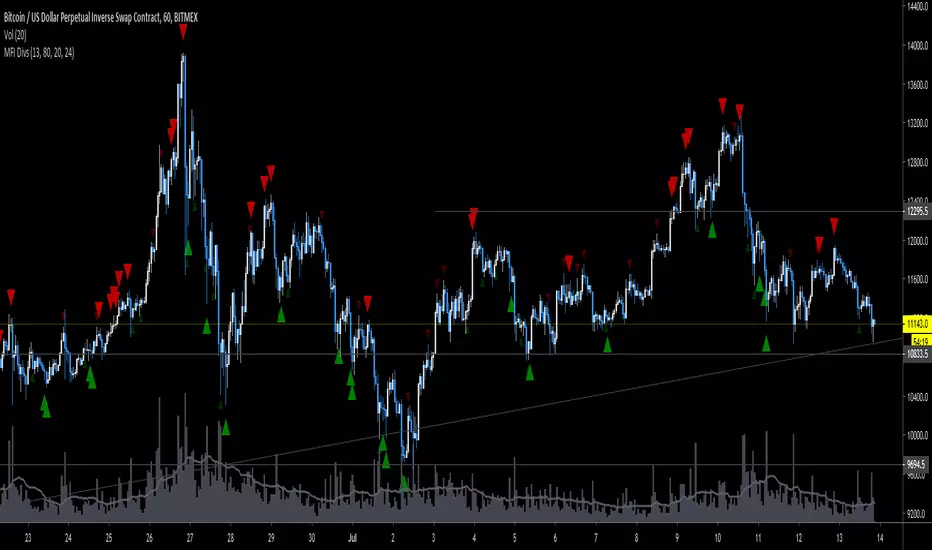
MFI Divergence v2Edited the RSI div indicator by Libertus to use MFI & show on candles. V2 update filters the divs using stochastic oversold & overbought & removes the lagging signals (they were offset back by 1 bar).
Default settings were tuned for xbtusd 1hr; works well if after a signal you wait for a stochastic indicator to stop being oversold or overbought, so if eg. you see a cluster of sell signals at a top, wait for the stoch to cross below 80 before entry. Please backtest before trading with this, DYOR NFA GLHF!

MFI DivergenceThis is an edit of the RSI divergence indicator by Libertus (thanks!). Play around with the settings, you'll want to tweak length & lookback per market & timeframe.
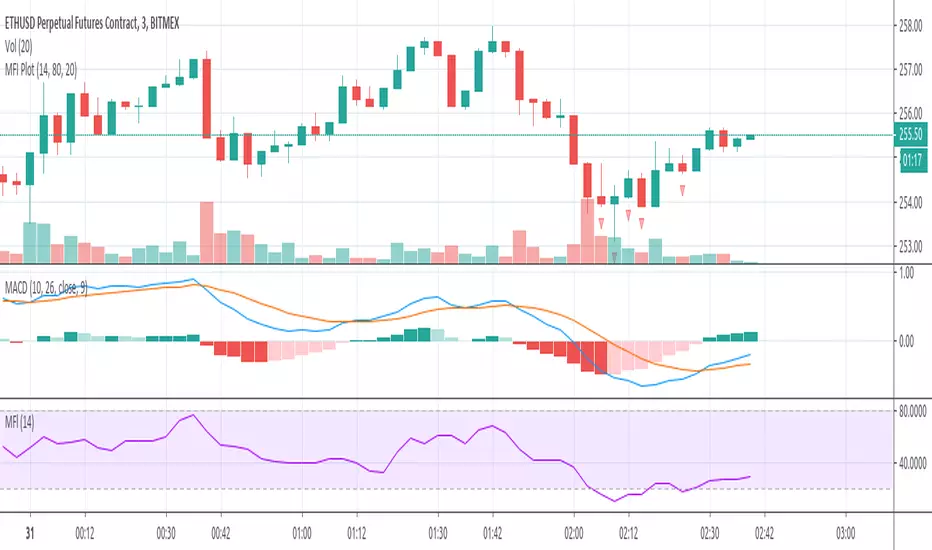
The four Kings MFI OBV CCI MACD [MesattoCapital]MFI OBV CCI MACD Combo Indicator by MesattoCapital
Version 2.0
Enjoy, check screenshot for more info!
BR/PT Version:


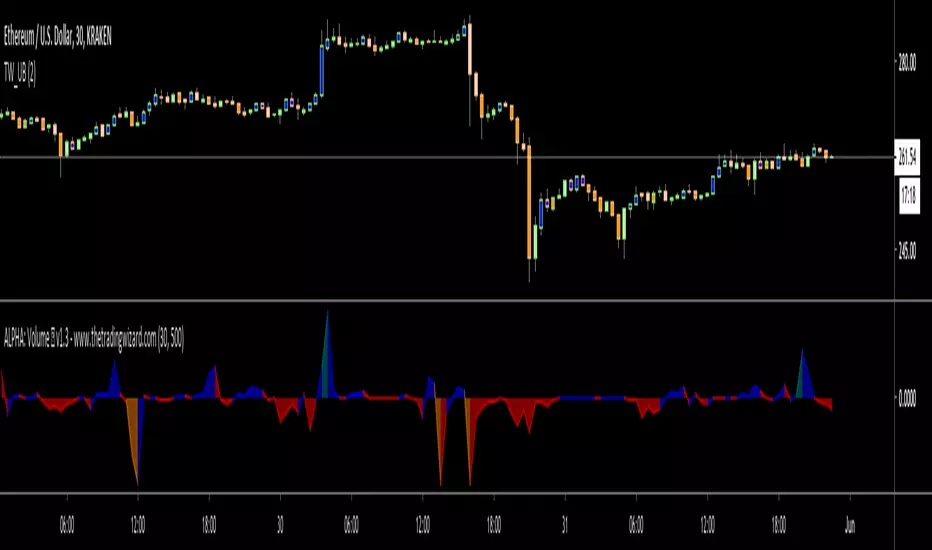
ALPHA: VolumePLEASE READ THE ENTIRE POST BEFORE PURCHASING & USING THE ALPHA: Volume INDICATOR. Saves you and me some time in emails and messages. :)
Volume is the only true predictive method for an assets movement.
Most of my followers know I am volume-obsessed, volume precedes price and identifying major spikes in volume prior to an assets movement is one of the most valuable finds a trader can accomplish. I have spent more time studying volume then any other analysis technique. During this time I have become frustrated time and time again with the inefficiencies our typical volume indicators produce. We have the old bar volume indicator everyone sees on their charts, OBV, CMF, Accumulation/Distribution, MFI etc. etc., the list goes on. I have my favorites that I have written about in past publications, but none provide a real time volume view to my liking.
Frustration has led me to create something I truly believe is groundbreaking.... And it wasn't easy, by any means.
ALPHA: Volume
The ALPHA series is a suite of indicators designed to improve analysis and past analysis techniques. The ALPHA: Volume provides real time volume in addition to identifying major positions and true visibility into where and when positions are being taken. Being able to consistently identify these qualities creates an invaluable edge on the market.
The average buyer of assets are a drop in the bucket in terms of how they impact daily transactions (volume) compared to institutional buyers. The institutional buyers typically buy in large blocks. When institutional buyers get into the market, they cause significant increase in demand. Like any case of supply and demand, when demand increases and supply stays the same, price will increase. When an asset becomes desirable, it is more likely that supply may decrease (as current holders will be less willing to sell) which will cause even more price pressure.
Based on this volume precedes price analysis, it is probably obvious that there is a herd mentality when it comes to the market. When one institution is buying a large block of an asset, other institutions will spot the buying and be motivated to jump in as well. This increases the pressure on the assets price. You and I are small investors so it is important to join the herd and let the supply and demand caused by the institutions carry our investments higher.
Introduction
It's fairly simple to read, the default settings show an area with breaks view meaning positive and negative values, this is useful for seeing trends, pressure, and measuring divergences. Additionally, there is coloring to keep an eye on. To keep it simple:
Blue: Buying
Red: Selling
Teal: Heavy buying/major positions being taken.
Orange: Heavy selling/major positions being taken.
Let's get into what ALPHA: Volume does, it has numerous capabilities that I am still discovering, identifying false rallies/sell offs, telegraphing major moves, identifying underwater positions, spotting divergences, bottoms, tops and on and on. One thing to note that it doesn't do is show cumulative volume such as the OBV, this can be useful for identifying rising wedges and similar patterns, I will no longer be using other volume indicators unless I am identifying a pattern that is reliant on cumulative volume.
In this example below, we see heavy selling causing a dip that was then bought up with major positions causing a rally because demand exceeded supply.
The next example shows large positions being taken drying up supply ultimately causing a rally, very well telegraphed.
Same scenario but heavy selling weakening demand.
Originally, I planned on going on and on with examples, but I am going to keep this simple & short as I don't want to prolong the publishing. This will sell itself as more people discover the quality and accuracy. Still not sold? No worries, I'll be doing all of my volume analysis off of this indicator, so stay tuned for more in depth analysis with it on TradingView and twitter, I am truly excited for this indicator to be used by traders and analysts. Those of you that purchase and use it, (already orders off of my site and I haven't even published this) feel free to tag me in a tweet with a chart if you have questions, there will be times when volume is not making sense and perhaps I can offer insight into what is happening.
Conclusion
Before I get messages, "But Nick, the volume indicator was wrong here!".... No it wasn't, its not a signal generator, it is measuring real time volume. I cannot fix peoples' faulty positions that the indicator is showing. Volume should never be used independent of price action & other forms of analysis to determine buying or selling patterns. Volume is extremely important as a confirmation for technical indicators and I strongly suggest you use it as such. I will be doing several videos on this over the next couple weeks on my youtube channel showing ways to confirm other indicators with volume. Ichimoku goes great with it btw :).
Please note this works on all assets on all time frames, during my volume studies with this indicator I noticed lots of noise depending on the time frame, so I have implemented a feature that automatically adjusts to the correct settings based on what time frame you are on. I added a masking feature to keep my work proprietary that shows 30 and 500 (not true) as the settings in case my formula is ever figured out (doubtful but the capitalist in me that believes it is ok to protect what you work for) If you uncheck "Use Preset Periods" in settings then it will allow you to adjust the periods and peak limit, I don't recommend playing around with the settings as you can disturb the balance I've found. However, the option is there for the analysts that are into experimenting. If you feel the need to adjust some things then peak limit is the only thing I recommend adjusting, it allows you to view higher parameter limits on the volume spike to measure divergences of very large orders, the peak limit doesn't matter so much as long as it indicates the teal or orange, some spikes go as high as 80K in testing. In the end the size is typically irrelevant, but it is there in case you want to measure it or have curiosity.
I want to provide research and discoveries from its users and myself on a regular basis. I will be holding discussions & providing research in my discord server that I run with a team of very talented analysts. The link for that is here: discord.gg
This indicator is available for TradingView users on my web site www.thetradingwizard.com for $99, that includes a life time subscription. There is also a monthly subscription option for all three indicators from the ALPHA series. (Please see my published scripts for information on the other two) Both purchase options include updates and support as a user.
This will be the end of the ALPHA indicator series for a while, after finally conquering volume I am moving on with the formulas from the ALPHA series to bigger things. Enjoy!
Disclaimer
Nothing in this post is to be used or construed as financial advice. The indicator is not a signal-generating indicator and should not be used to trade off of solely. This post is meant as an educational post to explain the functions of the indicator.
MFI PlotterPlaces icons on the chart to show which bars are overbought or oversold based on threshold limits used for MFI.
MFI LizardMFI with auto identification of divergence, multi timeframe support and centre line.
Work In Progress


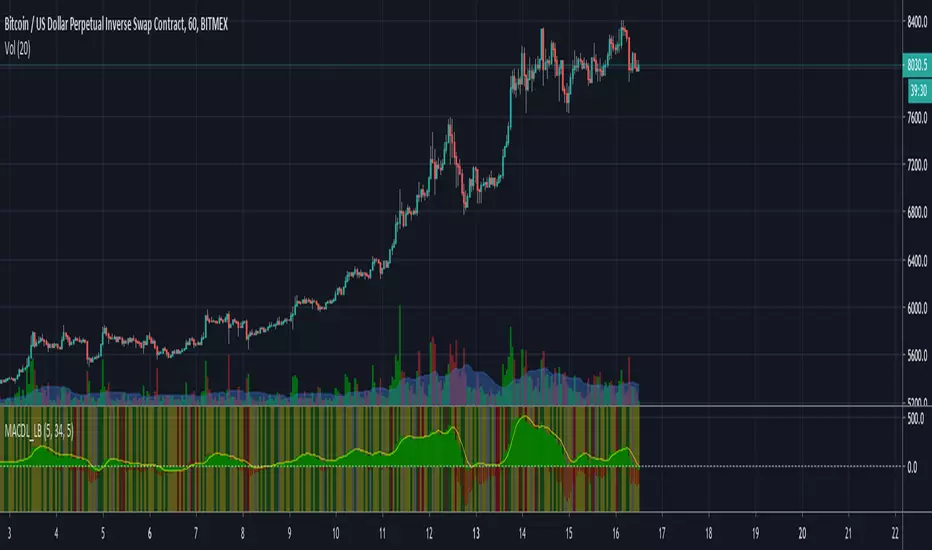
MACD LB MFIThis script includes MACD histogram plus MFI in four states
All backgrounds are compared to previous bar in +/- 10%
1. Green (green) + Volume + Range (++)
2. Fading (yellow) - Volume - Range (--)
3. False (gray) - Volume + Range (-+)
4. Crouching (red) + Volume - Range (+-)
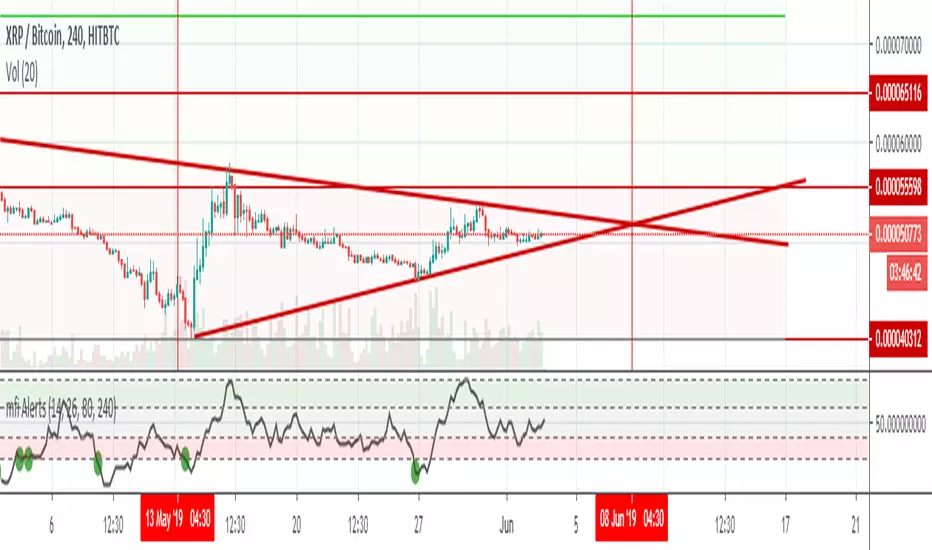
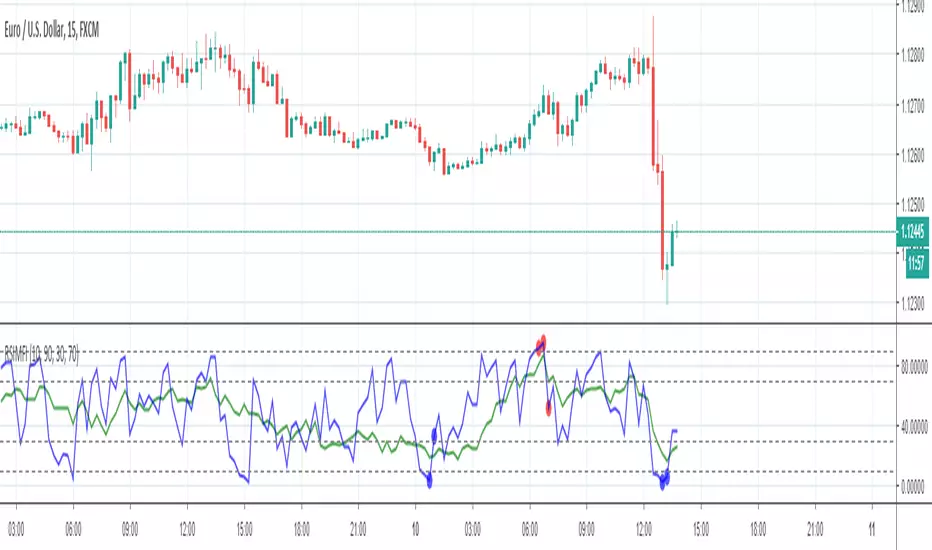
RSI MFI with alertsModified from the various scripts I've found on TradingView. This scripts adds alerts for oversold overbought conditions. It also has the ability to add in another RSI at a different time interval.
I've also added an MFI with bollinger bands to the chart to preceed the RSI. This can sometimes tell you the direction the RSI is moving. usually when it is out of the bollinger bands on the MFI the price/RSI tends to slow.

RSIMFIThis is for education purpose.
Script provides signal if MFI and RSI reachs to oversold or overbought condition.
Apart from xSuperTrend script, this script works fine on consolidating marked and gives false signal on strong trends.
MFI(14), RSI(3)
Minimal Godmode 1.0// Acknowledgements:
// Original Godmode Authors:
// @Legion, @LazyBear, @Ni6HTH4wK, @xSilas
// Drop a line if you use or modify this code.
// Godmode 3.1.4: @SNOW_CITY
// Godmode 3.2: @sco77m4r7in and @oh92
// Godmode3.2+LSMA: @scilentor
// Godmode 4.0.0-4.0.1: @chrysopoetics
// Jurik Moving Average: @everget
// Minimal Godmode v1.0:
// Removed BITSTAMP:BTCUSD, added presets for 9-26-13 and 17-6-4, added more exchanges + USDT and USDC pairs to multi-exchange option
// JMA smoothing - more responsive + less lag than SMA at equivalent length settings
// Minor cosmetic changes to account for pinescript 3 transparency and z-order

Market Facilitation Index - MFIUsing Market Facilitation Index - MFI you will be able to recognise two important metrics:
Whether the current trend is strong enough to trade it.
When a new trend may start.
MFI combines changes in price (range) and volume. Here is the formula:
MFI = (High – Low) * Volume
The indicator has bars of four colours. Each colour has a specific meaning and shows how the market responds to a change in volume.
Green. A green bar forms in the situation that both MFI and the volume are up. It means that more and more traders join the market in the current direction. In other words, it points to a strong trend, so you can open trades in line with this trend.
Brown. A brown bar appears when both MFI and the volume decline. It is also called “fade”. It signals that traders are hesitating and don’t want to continue the trend anymore. As a result, it’s not recommended to join the trend. Several brown bars are a sign of the potential reversal of the trend.
Blue. A blue bar forms when MFI increases, but the volume declines. A spike in price may be short-lived a precede a change in the trend. Blue bars appear at the times when newbies enter the trend, but professional traders know that it’s already too dangerous.
Pink. A pink bar, also known as squat, appears when MFI is diminishing, but the volume is growing. It reflects an increase of trading interest and an active fight between buyers and sellers. After one of the sides wins, the price will likely make a big move breaking support or resistance levels. The MFI, however, can’t be used to determine the direction of the breakout.

Top 5 coins cummulated Upvol/Dnvol and Money FlowThis script reads price and volume information for the top 5 coins (on 9 exchanges, a total of 29 pairs), calculates the cummulative upvolume and downvolume according to the Money Flow (MFI) formula, and shows upvolume and downvolume separately on the chart as a green and a red line.
The coins used are BTC, ETH, LTC, XRP and EOS. They are the top 5 coins by daily volume, as of 24th of February 2019.
Because of the many security() calls needed, the script is VERY slow, so have lots of patience.
I find it useful as a broad crypto market indicator - for example to compare the current pump with the pumps in the past.
Can also calculate the aggregated Money Flow (MFI) if you check that option in the indicator's configuration. Make sure to wait for recalculation and rescale the chart afterwards - MFI has a value from 0 to 100 and you may need to zoom in.

Godmode 4.0.1 [Correlator]First off, a huge thank you to the following people:
@LEGION:
@LazyBear: www.tradingview.com
@xSilas: www.tradingview.com
@Ni6HTH4awK: www.tradingview.com
@sco77m4r7and:
@SNOW_CITY: www.tradingview.com
@oh92: www.tradingview.com
@alexgrover: www.tradingview.com
@cI8DH: www.tradingview.com
@DonovanWall: www.tradingview.com
This is my second iteration of Godmode. This time I allowed the possibility to correlate two benchmarks against one another, thereby giving you twice the signals (once there's a strong correlation between the two, inverse or otherwise). That aside, there are no changes to this indicator that the first iteration doesn't have:
There are still more iterations planned, but if you guys have any ideas or wishes regarding what direction I go, then please let me know.
Want to Learn?
If you'd like the opportunity to learn Pine but you have difficulty finding resources to guide you, take a look at this rudimentary list: docs.google.com
The list will be updated in the future as more people share the resources that have helped, or continue to help, them. Follow me on Twitter to keep up-to-date with the growing list of resources as well as any other scripts I publish.
Suggestions or Questions?
Don't even kinda hesitate to forward them to me. My (metaphorical) door is always open.

Godmode 4.0.0 [Oscillator]First off, a huge thank you to the following people:
LEGION:
LazyBear: www.tradingview.com
xSilas: www.tradingview.com
Ni6HTH4awK: www.tradingview.com
sco77m4r7and:
SNOW_CITY: www.tradingview.com
oh92: www.tradingview.com
alexgrover: www.tradingview.com
cI8DH: www.tradingview.com
DonovanWall: www.tradingview.com
Since I've been on TradingView I've become somewhat enthralled by Godmode and the collective work that goes in to it, so I decided to publish my own iteration, building off the ideas already present. (This is a great way to get familiar with Pine by the way, just in case there are any beginners reading this)
Changes
The first change I made was to allow the user to select whatever tickerid they wanted as a benchmark. If trading XBTUSD on BitMEX for example, the indicator will react to exchange-specific activity, which means it will respond to all the little whipsaws, whipsaws that can be especially present on a futures exchange. By typing CRYPTOCAP:BTC or CRYPTOCAP:TOTAL we endeavor to remove noise. It can also signal earlier. Less noise and less lag. Another idea would be to choose a benchmark that has a strong inverse relationship with the asset you're trading: try CRYPTOCAP:USDT as the benchmark against BTC to see what I mean.
I also added the ability to smooth the plot, yet again removing noise but adding considerable lag.
The linear regression of the wave-trend is calculated in place of the EMA. This is plotted as columns with the midline (50) as the base. This is just calculating the slope of the wave-trend and can signal a weakening trend before a reversal takes place.
Using cI8DH's True RSI script () as inspiration, I added a function for calculating the True TSI in an attempt to remove any bullish bias. Funnily enough, when I tried to do the same with the RSI I had some problems. I'll try to resolve this in the coming weeks.
Made slight changes to the aesthetics. Tried to bring the two main plots alive by making their bold, opaque colors stand off the subtle tones in the background.
To Do List
1. I would like to sort out the issue with the True RSI.
2. When the plots are smoothed, there's an issue with the green 'Caution!' dots appearing in the lower half of the indicator.
3. I'd like to adjust the code so that if the 'Benchmark' box is empty, that it will automatically register the current tickerid as the 'Benchmark'.
If anyone has any suggestions on other fixes or how to apply the fixes mentioned by me, please don't hesitate to reach out to me here or through other media platforms.
Want to Learn?
If you'd like the opportunity to learn Pine but you have difficulty finding resources to guide you, take a look at this rudimentary list: docs.google.com
The list will be updated in the future as more people share the resources that have helped, or continue to help, them. Follow me on Twitter to keep up-to-date with the growing list of resources.
Suggestions or Questions?
Don't even kinda hesitate to forward them to me. My (metaphorical) door is always open.
BITMEX:XBTUSD
CRYPTOCAP:BTC
CRYPTOCAP:TOTAL
CRYPTOCAP:USDT.D
