Burst PowerThe Burst Power indicator is to be used for Indian markets where most stocks have a maximum price band limit of 20%.
This indicator is intended to identify stocks with high potential for significant price movements. By analysing historical price action over a user-defined lookback period, it calculates a Burst Power score that reflects the stock's propensity for rapid and substantial moves. This can be helpful for stock selection in strategies involving momentum bursts, swing trading, or identifying stocks with explosive potential.
Key Components
____________________
Significant Move Counts:
5% Moves: Counts the number of days within the lookback period where the stock had a positive close-to-close move between 5% and 10%.
10% Moves: Counts the number of days with a positive close-to-close move between 10% and 19%.
19% Moves: Counts the number of days with a positive close-to-close move of 19% or more.
Maximum Price Move (%):
Identifies the largest positive close-to-close percentage move within the lookback period, along with the date it occurred.
Burst Power Score:
A composite score calculated using the counts of significant moves: Burst Power =(Count5%/5) +(Count10%/2) + (Count19%/0.5)
The score is then rounded to the nearest whole number.
A higher Burst Power score indicates a higher frequency of significant price bursts.
Visual Indicators:
Table Display: Presents all the calculated data in a customisable table on the chart.
Markers on Chart: Plots markers on the chart where significant moves occurred, aiding visual analysis.
Using the Lookback Period
____________________________
The lookback period determines how much historical data the indicator analyses. Users can select from predefined options:
3 Months
6 Months
1 Year
3 Years
5 Years
A shorter lookback period focuses on recent price action, which may be more relevant for short-term trading strategies. A longer lookback period provides a broader historical context, useful for identifying long-term patterns and behaviors.
Interpreting the Burst Power Score
__________________________________
High Burst Power Score (≥15):
Indicates the stock frequently experiences significant price moves.
Suitable for traders seeking quick momentum bursts and swing trading opportunities.
Stocks with high scores may be more volatile but offer potential for rapid gains.
Moderate Burst Power Score (10 to 14):
Suggests occasional significant price movements.
May suit traders looking for a balance between volatility and stability.
Low Burst Power Score (<10):
Reflects fewer significant price bursts.
Stocks are more likely to exhibit longer, sustainable, but slower price trends.
May be preferred by traders focusing on steady growth or longer-term investments.
Note: Trading involves uncertainties, and the Burst Power score should be considered as one of many factors in a comprehensive trading strategy. It is essential to incorporate broader market analysis and risk management practices.
Customisation Options
_________________________
The indicator offers several customisation settings to tailor the display and functionality to individual preferences:
Display Mode:
Full Mode: Shows the detailed table with all components, including significant move counts, maximum price move, and the Burst Power score.
Mini Mode: Displays only the Burst Power score and its corresponding indicator (green, orange, or red circle).
Show Latest Date Column:
Toggle the display of the "Latest Date" column in the table, which shows the most recent occurrence of each significant move category.
Theme (Dark Mode):
Switch between Dark Mode and Light Mode for better visual integration with your chart's color scheme.
Table Position and Size:
Position: Place the table at various locations on the chart (top, middle, bottom; left, center, right).
Size: Adjust the table's text size (tiny, small, normal, large, huge, auto) for optimal readability.
Header Size: Customise the font size of the table headers (Small, Medium, Large).
Color Settings:
Disable Colors in Table: Option to display the table without background colors, which can be useful for printing or if colors are distracting.
Bullish Closing Filter:
Another customisation here is to count a move only when the closing for the day is strong. For this, we have an additional filter to see if close is within the chosen % of the range of the day. Closing within the top 1/3, for instance, indicates a way more bullish day tha, say, closing within the bottom 25%.
Move Markers on chart:
The indicator also marks out days with significant moves. You can choose to hide or show the markers on the candles/bars.
Practical Applications
________________________
Momentum Trading: High Burst Power scores can help identify stocks that are likely to experience rapid price movements, suitable for momentum traders.
Swing Trading: Traders looking for short- to medium-term opportunities may focus on stocks with moderate to high Burst Power scores.
Positional Trading: Lower Burst Power scores may indicate steadier stocks that are less prone to volatility, aligning with long-term investment strategies.
Risk Management: Understanding a stock's propensity for significant moves can aid in setting appropriate stop-loss and take-profit levels.
Disclaimer: Trading involves significant risk, and past performance is not indicative of future results. The Burst Power indicator is intended for educational purposes and should not be construed as financial advice. Always conduct thorough research and consult with a qualified financial professional before making investment decisions.
Momentumburst

Swing Trading Indicators (Improved)This "Swing Trading Indicators" script is a sophisticated trading tool designed for traders who wants to use technical analysis for identifying optimal entry points, safeguarding profits, and protect their capital. With foundations loosely based on the momentum burst strategy by Pradeep Bonde, Kristjan Kullamaggie's trading methodologies, and incorporating automatic stop-losses based on Average Daily Range (ADR) and Average True Range (ATR), this script offers a comprehensive solution if you want to capitalize on short-term market movements.
Key Features:
Indicators and Moving Averages: Includes EMA (5, 10, 20, 50 days), SMA (200 days), and the highest and lowest prices over 200 days to provide a multifaceted view of market trends and momentum.
Thrust Indicator: Central to the script, the thrust indicator signals a buy point when a candlestick bar closes above the highs of the last two days, indicating a momentum burst. This feature is particularly inspired by Pradeep Bonde's 4% breakout strategy, highlighting the script's capability to identify range expansion and upward thrusts as key entry moments.
Automatic Stop-Levels: Utilizes ADR and ATR to set dynamic stop-losses, helping traders to manage risk effectively by adapting to market volatility.
Comprehensive Market Analysis : Through volume analysis, RSI, closing range, and other parameters, the script offers a deep dive into market dynamics, aiding in decision-making.
Who Should Use It:
This tool is ideal for swing traders and momentum traders focused on short to medium-term gains. Its robust set of features makes it suitable for those who prefer a data-driven approach to identify buying opportunities and manage risk.
Trading Style Compatibility:
The thrust indicator shines in momentum trading strategies, providing clear signals for entering trades ahead of potential price jumps. The integration of moving averages and volume analysis supports a variety of trading styles, including day trading and swing trading, by offering insights into trend strength and potential reversals.
How the Thrust Indicator Works:
When you see a thrust indicator (green upwards arrow below a candle) when the price is moving out of a consolidation or low volatility price-range , that's the buy point.
The thrust indicator is NOT indended as an indicator for long term positions or trend reversals, but for entries at a good price while capturing the first day of a potential 5-20% move in the coming 3-5 days.
The thrust indicator pinpoints moments when a stock shows a strong upward momentum, characterized by a candlestick closing above the highs of the preceding two days. This identifies a momentum burst, signaling an optimal entry point for traders looking to profit from a short-term price movement, typically ranging from 5-20% over the following 3-5 days. Such precision in identifying entry points is invaluable for traders focusing on capturing quick gains from market volatility.
"Top / Watch out" Indicator:
In addition to the script's core functionality, the "WatchOut" indicator plays a crucial role in identifying potential reversals after significant price movements. By analyzing conditions such as recent price increases compared to the average daily range, RSI levels, and the opening price distance from the EMA, the "WatchOut" indicator alerts traders to exercise caution. This feature is pivotal for those looking to avoid entering trades that might be on the verge of a pullback or reversal, enhancing the script's utility in managing risk.

Stockbee Momentum BurstThis is a script to color code bars based on the bullish- and bearish combination.
Bullish Combination
Percent: Price >= 4% from yesterday and Volume today > Yesterday
Dollar: Price >= 0.9 dollar from open
Base Requirements
- Price > Yesterday's close
- Price > Open
- Price is within 30% of high
- Todays price range >= Yesterdays price range
- Yesterday's move <= 2%
- Volume >= 100 000
Bearish Combination
Percent: Price <= 4% from yesterday and Volume today > Yesterday
Dollar: Price <= 0.9 dollar from open
Base Requirements
- Price < Yesterday's close
- Price < Open
- Price is within 30% of low
- Todays price range >= Yesterdays price range
- Yesterday's move >= -2%
- Minimum volume for each of last 3 days >= 100 000
Momentum Filter
These are based on the 10 and 20 EMA crossover, where the former above would indicate upward momentum and below downward momentum. This can help to narrow down the color code to continuation phases. The linked option will override all other momentum filters, bullish candles will be displayed when EMA 10 > 20 and bearish candles when EMA 10 < 20.

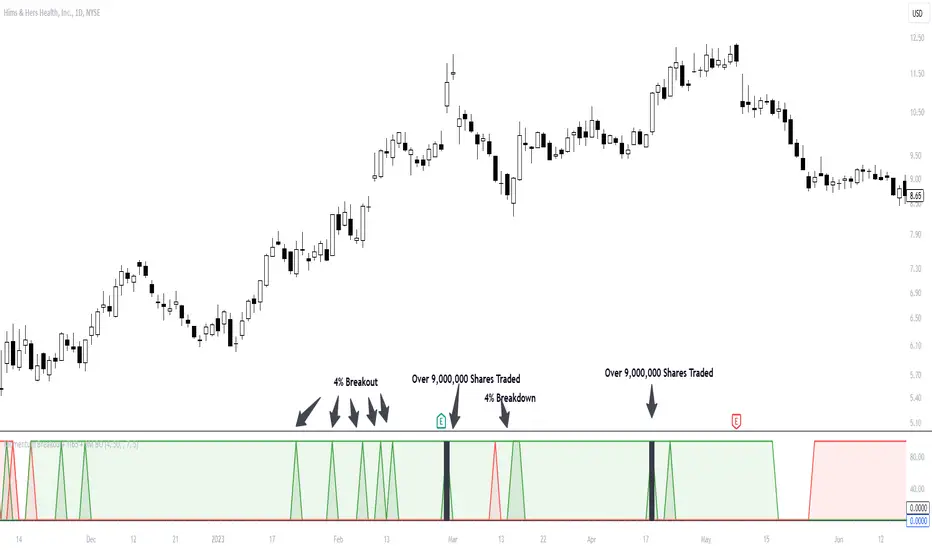
Ollie_allcaps Momentum IndicatorMomentum is created when a security makes a large move on higher-than-average volume. Momentum shows the rate of change in price movement over a period of time to help investors determine the strength of a trend.
This indicator will create a green spike once price advances 4% and is trading above the 50-day average trading volume. However, if the stock begins to breakdown (-4% or greater on above average volume), a red spike will be created.
These green and red spikes represent a change in momentum that occurs in the selected security.
This indictor should be used in 2 ways:
1: What are the charecteristics of this stock? Does it breakdown shortly after a momentum spike? or does the security trend in orderly manner after a momentum spike?
2: Investers should use this indicator to determine the strength of a momentum breakout in real time. Has the stock made a large move, but with no significant volume?
Customization:
The Percentage move, and average daily volume can be changed as well as colors.
Alerts:
If you wish to set an alert, this indicator allows you to create an alert when the selected stock meets your desired criteria.