Momentum With Bullish & Bearish LabelMOMENTUM WITH BULLISH AND BEARISH SIGNALS
This is a momentum oscillator that paints red or green depending on whether Momentum is above or below the zero line. It includes a label on the right hand side that will reflect the bullish or bearish direction of the current momentum by changing colors to red or green and text telling you Bullish or Bearish.
***HOW TO USE***
When Momentum is above zero, it is bullish. When Momentum is below zero it is bearish.
A label on the right side will update in real time to tell you if momentum is Bullish or Bearish for faster recognition of the trend.
When momentum is above the zero line(Bullish) but trending downward, a second label will show up in purple to notify you of a change in momentum direction.
When momentum is below the zero line(Bearish) but trending upward, a second label will show up in purple to notify you of a change in momentum direction.
This indicator was built to help you quickly identify the Bullish or Bearish nature of the current Momentum using colors as well as a live color changing label so you can glance at the label and understand it's direction without analyzing the indicator data.
***MARKETS***
This indicator can be used as a signal on all markets, including stocks, crypto, futures and forex.
***TIMEFRAMES***
This momentum indicator can be used on all timeframes.
***TIPS***
Try using numerous indicators of ours on your chart so you can instantly see the bullish or bearish trend of multiple indicators in real time without having to analyze the data. Some of our favorites are our Auto Fibonacci, Directional Movement Index, Volume Profile, Auto Support And Resistance and Money Flow Index in combination with this Momentum Oscillator. They all have real time Bullish and Bearish labels as well so you can immediately understand each indicator's trend.
Momentumindicator

TradeChartist Mean Momentum Drift Oscillator (MMDO)™TradeChartist Mean Momentum Drift Oscillator (MMDO) is the Oscillator version of the ™TradeChartist Mean Momentum Drift Bands (MMDB) indicator with some added visual features to spot Momentum, divergences and Price action using ™TradeChartist Zone Visualizer model.
===================================================================================================================
Features of ™TradeChartist MMDO
==============================
Price zone detection using ™TradeChartist Zone Visualizer model.
No User input required.
3 Visual colour schemes - Chilli, Flame and Custom.
Clear Visualization of Overbought and Oversold zones.
Colour Bars based on Momentum strength.
MDDO highs and lows tracker helps detect divergences.
===================================================================================================================
Example Charts
1. MMDO used along with ™TradeChartist MMDB (Mean Momentum Drift Bands) on 4hr chart of BINANCE:BTCUSDT
2. MMDO on 1hr chart of OANDA:EURUSD to confirm Drift Bands breakout entries on MMDB
3. MMDO on 1hr chart of BINANCE:LUNAUSDT
===================================================================================================================
Best Practice: Test with different settings first using Paper Trades before trading with real money
===================================================================================================================

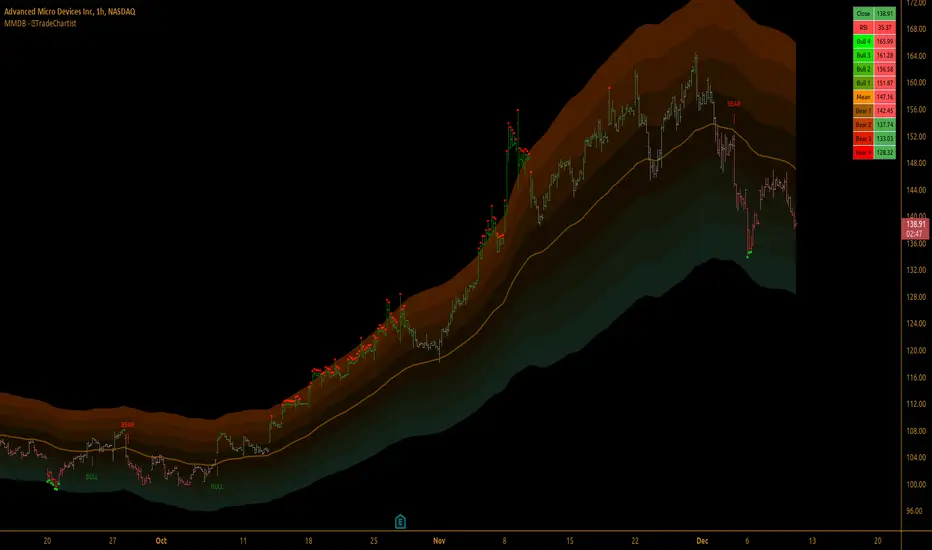
TradeChartist Mean Momentum Drift Bands (MMDB)™TradeChartist Mean Momentum Drift Bands (MMDB) is a Momentum indicator that plots a Mean Momentum line (calculated automatically from sample means of many lookback periods decided by the script logic) and Upper/Lower Drift Bands (calculated using standard deviation). The script helps spot price volatility, Oversold/Overbought zones and also generates high probability breakout signals without any user input.
===================================================================================================================
Features of ™TradeChartist MMDB
==============================
Momentum Mean and 4 upper/lower Drift bands.
No User input required.
3 Visual colour schemes - Chilli, Flame and Custom.
MMDB table that shows asset's price, RSI and values of Mean & Upper/Lower Drift bands
Breakout Signals (Bull and Bear arrows) based on price closing above or below the 1st Drift Band.
Overbought and Oversold zones.
Colour Bars based on Momentum strength.
Alerts for Bull and Bear Breakouts ( Once per bar close to be used).
===================================================================================================================
Example Charts
1. MMDB used along with ™TradeChartist MMDO (Mean Momentum Drift Oscillator) on 4hr chart of BINANCE:BTCUSDT
2. MMDB on 4hr chart of OANDA:XAUUSD
3. MMDB on 1hr chat of OANDA:SPX500USD
4. MMDB connected to ™TradeChartist Plug and Trade on BINANCE:LINKUSDTPERP
===================================================================================================================
Note: The script doesn't repaint, so the alerts can be used with confidence. To check this, users can do bar replay to confirm if the plots and markers stay in the same place.
===================================================================================================================
Best Practice: Test with different settings first using Paper Trades before trading with real money
===================================================================================================================
+ Rate of ChangeNOTE!* If you were using my previous + Rate of Change (and OBV) indicator, I will not be updating that. OBV was moved to my + Breadth & Volume indicator.
This indicator here is basically and updated version of the old indicator, without OBV.
The Rate of Change, or RoC, is a momentum indicator that measures the percentage change in price between the current period and the price n periods ago.
It oscillates above and below a zeroline, basically showing positive or negative momentum.
I applied the OBV's calculation to it, but without the inclusion of volume (also added a lookback period) to see what would happen. I rather liked the result.
I call this the "Cumulative Rate of Change." I only recently realized that this is actually just the OBV without volume, however the OBV does not have a lookback period, and this indicator does.
Doing some more fiddling, I realized that removing both the signum and the volume from the calculation gets you basically a price chart, but calculated as the change in price over n periods. I'm leaving this in because maybe someone discovers they really like having a line chart with moving averages or some other indicator on it to leave their main chart indicator free (giving a more clear look at price action). Can't hurt, right?
Default lookback is set to 1, but play with longer settings (especially if using the traditional RoC, which is by default in TV set to 10, and is nigh on useless at 1--I like 13).
Default source is set to each candle close, but give ohlc4 a look. It smooths out the indicator a bit, and because it's an average of the open, high, low, and close it should give a better idea of what price in general is doing.
Moving averages, Bollinger Bands, Donchian Channels, candle coloring and alerts are my usual additions.
Below are some comparison images of the different indicators wrapped up in here.
Comparison of Cumulative Rate of Change with two different sources. Lookback set to 1.
Cumulative Rate of Change as a price chart, essentially.
And, lastly, the traditional Rate of Change indicator.

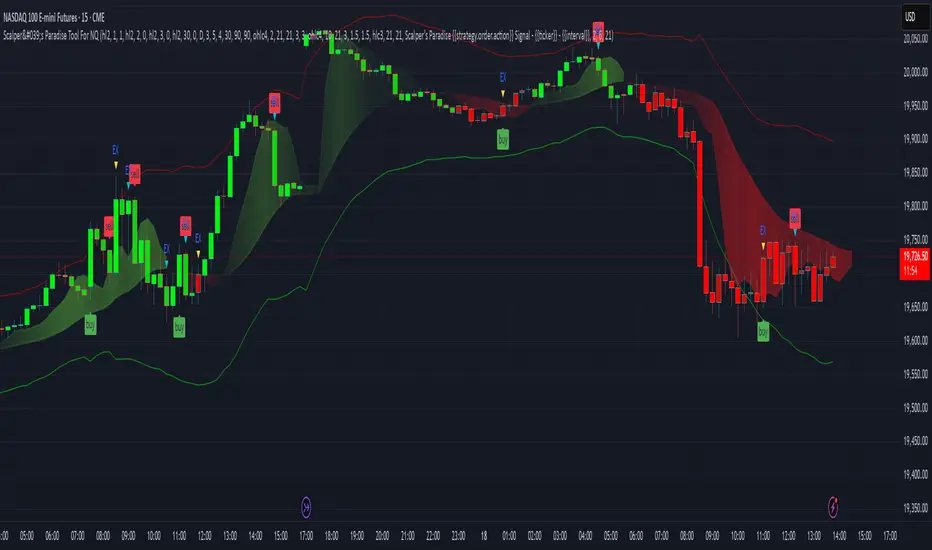
Scalper's Paradise Tool For NQThis powerful scalping tool was specifically designed for NQ and MNQ. Scalper's Paradise adds buy and sell signals to the chart using a proprietary blend of confluence trading principals that are incredibly accurate. Many of the settings can be customized for uses on higher time-frames and different markets. Along with the buy and sell signals, this indicator offers weakness signaling (seen as dots on the chart), along with potential exit points marked as 'EX' on the chart over a diamond shape.
How To Use:
This indicator is designed for intra-day scalping. When a buy or sell signal is marked on the chart, it's safe to enter a position. Exit the position when you see weakness in the trend or where the EX (exits) are marked.
The Trend Cloud offers great visibility for trend strength and overall volatility and can be used in conjunction with the entries and exits for added confidence that your trade is a worthwhile trade.
The red and green backgrounds on the chart are a filtering tool designed to save you from trades that otherwise don't carry enough momentum to be worth entering the market. This part of the indicator has 3 major adjustable settings that allow you to truly dial in your risk.
Identify momentum areas and trade with confidence using Scalper's Paradise!
Trend Cloud for momentum and confidence
Buy and Sell Signals
Marked Exits and Trend Weakness dots on the chart
ADX Based Clean Trade Filter allows for full customization of your trading risk profile. This part of the indicator will SUPPRESS any and all signals while the chart's background is red.
The Safer Trades Filtering in the settings allows further confidence by suppressing riskier trade signals
Limitations:
This script does not mark reversals. It will only identify safe trade zones during periods of strong momentum.
Disclaimer:
The information contained in my scripts/indicators/ideas does not constitute financial advice or a solicitation to buy or sell any securities of any type. I will not accept liability for any loss or damage, including without limitation any loss of profit, which may arise directly or indirectly from the use of or reliance on such information.
All investments involve risk, and the past performance of a security, industry, sector, market, financial product, trading strategy, or individual’s trading does not guarantee future results or returns. Investors are fully responsible for any investment decisions they make. Such decisions should be based solely on an evaluation of their financial circumstances, investment objectives, risk tolerance, and liquidity needs.
My scripts/indicators/strategies/ideas are only for educational purposes!
Jerry Romine Momentum Dream With Risk ManagementThe Momentum Dream Indicator with Risk Management is really two powerful indicators combined in one.
The Momentum Dream Indicator is a volatility and momentum indicator that measures the relationship between the Bollinger Bands and Keltner Channels to help identify consolidations and signal potential breakouts.
MOMENTUM DREAM INDICATOR:
SIGNALS AND ZONES:
Green Arrow = Post Squeeze Buy Triggered = GREEN ⇧ shows squeeze out on upward momentum (often a good time to buy)
Orange Arrow = Post Squeeze Sell Alert = ORANGE ⇩ shows squeeze out on downward momentum (often a good time to sell or NOT buy)
Green Dot on Chart - Day one of the buy zone
Green Shading - Buy Zone
Pink Dot on Chart - Day one of warning zone
Red Shading - Warning zone. Often a good time not to buy or to consider selling.
LABELS (Color Indicates Direction):
Momo Up / Down = Current momentum direction.
Squeeze = Squeeze is on and squeeze line dots are red.
Dots = number of day or bars the squeeze has been in red(on)
Squeeze Fired = Green or Orange arrow shows squeeze fired direction.
Stacked = Fibonacci 8, 21, 34, 55, 89 EMA are stacked up or down
SQUEEZE LINE COLOR DEFINITIONS:
Dark Red = Extra Squeeze (In & Out)
Red = Original Squeeze (In & Out)
Pink = Pre-Squeeze (In)
Yellow = Pre-Squeeze (Out)
Green = Bollinger Bands are officially outside of Keltner Channels
STRATEGY
There are multiple ways the Momentum Dream Indicator can be used.
1. Buy/Sell during the squeeze (generally lower volatility and lower option premiums)
2. Buy/Sell when the squeeze fires to catch the breakout (volume/volatility often increase)
3. Use Buy/Sell Zones with other signals for entering positions
4. Use Momentum to assist with position direction
5. Use fading momentum to tighten stops or close positions.
* The labels only show when certain criteria are met. For example if a squeeze fired the label only shows on that day but the indicator arrow will always show. For this reason the labels on the chart above will vary from day to day and only alert you when needed. :)
RISK MANAGEMENT INDICATOR
Risk management is a vital part of investing and this indicator provides 2 recommended positions sizes. One based on the classic 1-2% risk rule where you never risk more than X% of your account. A second based on position size not exceeding X% of your account.
The Risk Management Indicator does all of the hard math and provides you with a realistic trading plan, position size, and trail stop based on your customizable criteria. If you’ve ever wondered how much of a stock to buy, when to sell and when to take profits this indicator is for you!
Please Use the link below for more information or to purchase.

Natural Market River [CC]The Natural Market River was created by Jim Sloman (Ocean Theory pgs 59-62) and this is another momentum indicator that is extremely similar to the previous indicator I published, the Natural Market Mirror . This has almost identical buy and sell signals but different way to handle calculations so I'm going to leave it up to you which one you will prefer. Since this is almost identical, the buy and sell signals work in the same way with both strong signals and normal ones. Buy when the line turns green and sell when it turns red.
Let me know what other indicators you would like to see me publish!

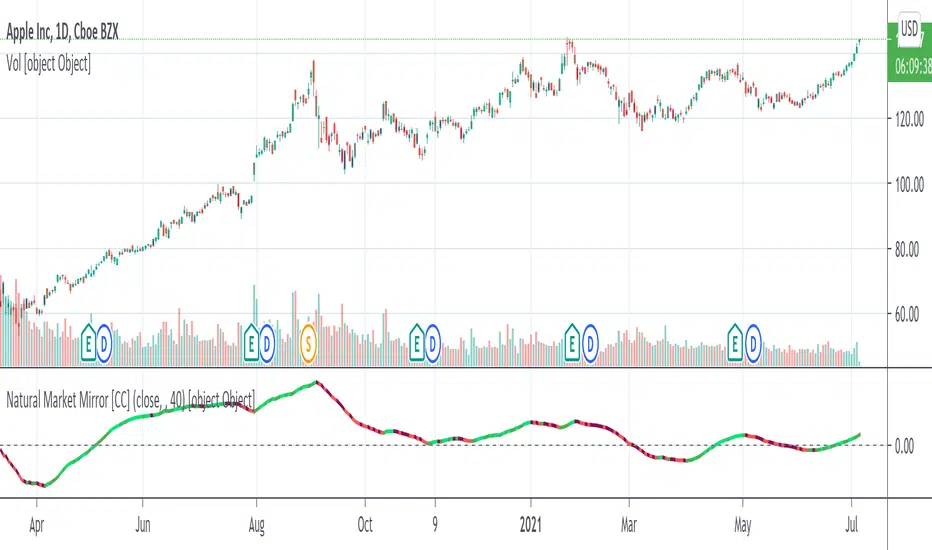
Natural Market Mirror [CC]The Natural Market Mirror was created by Jim Sloman (Ocean Theory pgs 49-57) and this is a continuation of my series from Jim Sloman's indicators. This indicator is also a momentum indicator and is very similar to the previous indicator I published, the Ocean Indicator and of course this indicator is built using ideas from the Ocean indicator. It may just be my opinion but I feel like this indicator provides better buy and sell signals in comparison. I built this using strong buy and sell indicators in addition to normal ones so darker colors are the strong signals and lighter colors are the normal signals. Buy when the line turns green and sell when it turns red.
Let me know what other indicators you would like me to publish!
Ocean Indicator [CC]The Ocean Indicator was created by Jim Sloman (Ocean Theory pgs 39-47). Sadly he passed away a few years ago so it is extremely hard to find his code or more information about his trading system other than through his books so I did my best to replicate all of his work and I will be publishing his indicators over the next few weeks. Big thanks to @altcoinz for giving me all of the information I needed to replicate his work. Since this is his basic foundation for everything else he has done, I will be publishing it first. I had to change things a bit to provide clear buy and sell signals so let me know your thoughts.
This is essentially his version of a momentum indicator and the basics of it are to buy when momentum is increasing and sell when it is decreasing. I have included strong buy and sell signals in addition to normal ones and darker colors are for strong signals and lighter colors are for normal signals. Buy when the line turns green and sell when it turns red.
Let me know if there are any other indicators you would like to see me publish!

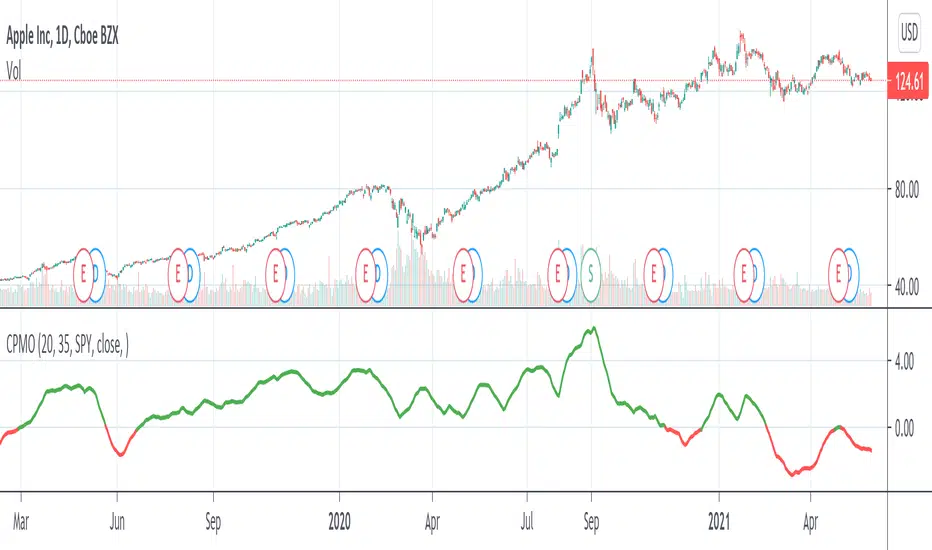
Compare Price Momentum Oscillator [CC]The Compare Price Momentum Oscillator was created by Vitali Apirine (Stocks and Commodities Aug 2020 pg 16) and this is a handy indicator to compare the momentum of the current symbol you are looking at to the s&p to determine the relative strength of the underlying security. Buy when the line turns green and sell when it turns red.
Let me know if there are any other scripts you would like to see me publish!
+ True RSIThis is a better, cleaner version (in my opinion) of an part of an indicator I was using that was coded up by cI8DH. I reached out to him about cleaning up the code (things weren't working) for Pinescript v4, but he no longer seems to be active, so I thought I might take it upon myself to at least work out this portion of the indicator.
Much credit goes to him. Below is the indicator that he coded, of which only one part have I made additions to.
So, he calls this the True RSI. I was using it as part of the USI, which I posted above (it's the MA Percent indicator type). To my eyes it's not far different from the standard RSI, so I probably could have just made a version of that, but I like this one, and I was excited to add a few things (like candle coloring, which no longer works with his version!).
So, what's different?
I added two different background fills.
I made the lines types for the extremities and midline more appropriate for the indicator.
I added bullish, bearish, overbought, and oversold candle coloring.
I added a multitude of moving averages as well.
If this looks like my '+ %B' indicator, that is because I basically just moved the MA's and candle coloring code over. One could probably do this with many different indicators.
In the future I will probably add alerts, and maybe MA cross candles as well. Or not. Well, almost certainly alerts. Please enjoy!
Delta-RSI Strategy (with filters)Delta-RSI Strategy (with filters):
This is a version of the Delta-RSI Oscillator strategy with several criteria available to filter entry and exit signals. This script is also suitable for backtesting over a user-defined period and offers several risk management options (take profit and stop loss).
Since the publication of the Delta-RSI Oscillator script, I have been asked many times to make it compatible with the Strategy Tester and add filtering criteria to minimize "false" signals. This version covers many of these requests. Feel free to insert your favorite D-RSI parameters and play around!
ABOUT DELTA-RSI
Delta-RSI represents a smoothed time derivative of the RSI designed as a momentum indicator (see links below):
INPUT DESCTIPTION
MODEL PARAMETERS
Polynomial Order : The order of local polynomial used to interpolate the relative strength index (RSI).
Length : The length of the lookback frame where local regression is applied.
RSI Length : The timeframe of RSI used as input.
Signal Length : The signal line is a EMA of the D-RSI time series. This input parameter defines the EMA length.
ALLOWED ENTRIES
The strategy can include long entries, short entries or both.
ENTRY AND EXIT CONDITIONS
Zero-crossing : bullish trade signal triggered when D-RSI crosses zero from negative to positive values (bearish otherwise)
Signal Line Crossing : bullish trade signal triggered when D-RSI crosses from below to above the signal line (bearish otherwise)
Direction Change : bullish trade signal triggered when D-RSI was negative and starts ascending (bearish otherwise)
APPLY FILTERS TO
The filters (described below) can be applied to long entry, short entry and exit signals.
RELATIVE VOLUME FILTER
When activated, the D-RSI-driven entries and exits will be triggered only if the current volume is greater than N times the average over the last M bars.
VOLATILITY FILTER
When activated, the D-RSI-driven entries and exits will be triggered only if the N-period average true range, ATR, is greater than the M-period ATR. If N < M, this condition implies increasing volatility.
OVERBOUGHT/OVERSOLD FILTER
When activated, the D-RSI-driven entries and exits will be triggered only if the value of 14-period RSI is in the range between N and M.
STOP LOSS/TAKE PROFIT
Fixed and trailing stop loss as well as take profit options are available.
FIXED BACKTESTING START/END DATES
If the checkboxes are not checked, the strategy will backtest all available price bars.

Smooth First Derivative IndicatorIntroducing the Smooth First Derivative indicator. For each time step, the script numerically differentiates the price data using prior datapoints from the look-back window. The resulting time derivative (the rate of price change over time) is presented as a centered oscillator.
A first derivative is a versatile tool used in functional data analysis. When applied to price data, it can be applied to analyze momentum, confirm trend direction, and identify pivot points.
Model Description:
The model assumes that, within the look-back window, price data can be well approximated by a smooth differentiable function. The first derivative can then be computed numerically using a noise-robust one-sided differentiator. The current version of the script employs smooth differentiators developed by P. Holoborodko (www.holoborodko.com). Note that the Indicator should not be confused with Constance Brown's Derivative Oscillator.
Input parameter:
The Bandwidth parameter sets the number of points in the moving look-back window and thus determines the smoothness of the first derivative curve. Note that a smoother Indicator shows a greater lag.
Interpretation:
When using this Indicator, one should recall that the first derivative can simply be interpreted as the slope of the curve:
- The maximum (minimum) in the Indicator corresponds to the point at which the market experiences the maximum upward (downward) slope, i.e., the inflection point. The steeper the slope, the greater the Indicator value.
- The positive-to-negative zero-crossing in the Indicator suggests that the market has formed a local maximum (potential start of a downtrend or a period of consolidation). Likewise, a zero-crossing from negative to positive is a potential bullish signal.
Multi Time Frame Trend, Volume and Momentum ProfileWHAT DOES THIS INDICATOR DO?
I created this indicator to address some of the significant inconveniences when analyzing a security, such as continually switching between different time frames to determine the trend and potential pullbacks, adding volume or volume-derived indicators, and finally, something that would help me determine the strength of the trend (maybe two additional indicators here). So I decided to code this all-in-one indicator that you can add multiple times to your chart depending on the settings you want to use, or just optimize the parameters for the particular asset and then switch between the options.
As the name suggests, it consists of three main sections - Trend , Volume , and Momentum . You have complete control over the parameters, including the Time Frames you want to use for each one (they can be different). So, let me explain each section in more detail.
HOW DOES THE INDICATOR WORK?
1. Trend Settings
In order to determine the trend, you need to set up two Moving Averages. You have a wide choice here - SMA, EMA, WMA, RMA, HMA, DEMA, TEMA, VWMA, and ALMA. Since the indicator does not plot the moving averages on the chart, I strongly suggest using this indicator along with the free "Trend Indicator for Directional Trading(main)" , which you can find in the Public Library. Once you set up the Trend Resolution, the Types of MAs, and their lengths, the indicator will generate a histogram of their convergences and divergences.
The change in colors should help you more easily determine the trend:
a) Bright Green - bull trend and price trending up (a good place to open long)
b) Dark Green - bull trend and price trending down (stay flat or open a long position with great caution)
c) Bright Red - bear trend and price trending down (a good place to open short)
d) Dark Red - bear trend and price trending up (stay flat or open a short position with great caution)
e) In addition, you can change the color palette to reflect the bull/bear trend momentum by scrolling to the bottom and selecting "Color Based on Bull/Bear Momentum", but I will discuss this in more detail below.
This part of the indicator is useful for opening a trade in the direction of the trend or for spotting a potential divergence. Both cases are illustrated below.
2. Volume Settings
The calculations for this part of the indicator are partially taken from "Multi Time Frame Effective Volume Profile" . I will quickly outline the specifics here, but if you want a more thorough understanding of how it works, please check the description of the MTF Effective Volume Profile indicator .
You have three elements with the following default settings - Resolution (5-min), Lookback (100), and Average (1). This means that the indicator will analyze the last one hundred 5-min bars and will plot a sum of only those that are at least 1 times bigger than the average. Those that are smaller than the average will be left out from the calculation. What you get is a trend line showing you accumulation/distribution based on modified volume parameters.
This part of the indicator is useful for spotting exhaustions and increased buying/selling volume that is opposite to the price trend. As you will see in the picture below, in frame 1 the selling pressure is decreasing, while buying volume is increasing. At one point supply dries out and the bulls take control, thus reverting the price. In frame 2, however, you can see that the higher high is not met with nearly as much buying volume as in the previous peak, showing that the bulls are exhausted and maybe a trend change will follow or at the very least that the bull trend will take a break.
3. Momentum Settings
The final part is an RSI smoothed through a Moving Average with the addition of some minor optimizations. Thus, the parameters you have to configure here aside from the resolution are the RSI length, the moving average that will be used, and its length. Out of the three, this is the most lagging component, but it's also the most accurate one. I must mention that due to the modified nature of this RSI, overbought and oversold levels carry less weight to the trading signals. Rather, pay attention to the change of colors, as they do so when the RSI changes direction based on preset parameters. The picture below shows such instances.
4. Additional Settings
This section consists of 4 elements:
a) Length of Trend - filters out the noise and gives a signal only when the trend becomes more established
b) ADX Threshold - filters out trading ranges and indecision zones when it's not recommended to open a trade
c) Select Analysis - choose what part of the indicator you want to see from a drop-down menu
d) Color Based on Bull/Bear Momentum - a global setting that will override the preset coloring of each indicator and will replace it with colors based on bull/bear strength and momentum - green for bulls, red for bears, and gray for non-trading zones.
The last part of this indicator is a combination of all of the above and is called a Points-Based System . It generates 3 rows of dots that go light green when bull criteria are met, orange when bear criteria are met, or gray when it's neither of the two. When you get a column of 3 green dots you get a buy signal. Similarly, a column of 3 orange dots gives you a sell signal. Grey zones are non-tradeable. It goes without saying that the frequency and quality of the signals you get will almost entirely depend on your settings, so feel free to experiment and adjust the indicator to catch the best moves for the given security.
In terms of indicator adjustments, I have left almost every part open to configuration. That is 15 parameters and 35 adjustable colors.
HOW MUCH DOES THE INDICATOR COST ?
As much as I would like to offer it for free (as some of my other ones), a great deal of work, trading logic, and testing have gone into creating this indicator. More than a few hundred iterations and a few dozen branches were required to reach the end result which is a precise combination of usefulness, simplicity, and practicality. Furthermore, this indicator will continue to be updated and user-requested features that improve its performance will be added.
Disclaimer: The purpose of all indicators is to indicate potential setups, which may lead to profitable results. No indicator is perfect and certainly, no indicator has a 100% success rate. They are subject to flaws, wrongful interpretation, bugs, etc. This indicator makes no exception. It must be used with a sound money management plan that puts the main emphasis on protecting your capital. Please, do not rely solely on any single indicator to make trading decisions instead of you. Indicators are storytellers, not fortune tellers. They help you see the bigger picture, not the future.
To find out more about how to gain access to this indicator, please use the provided information below or just message me. Thank you for your time.

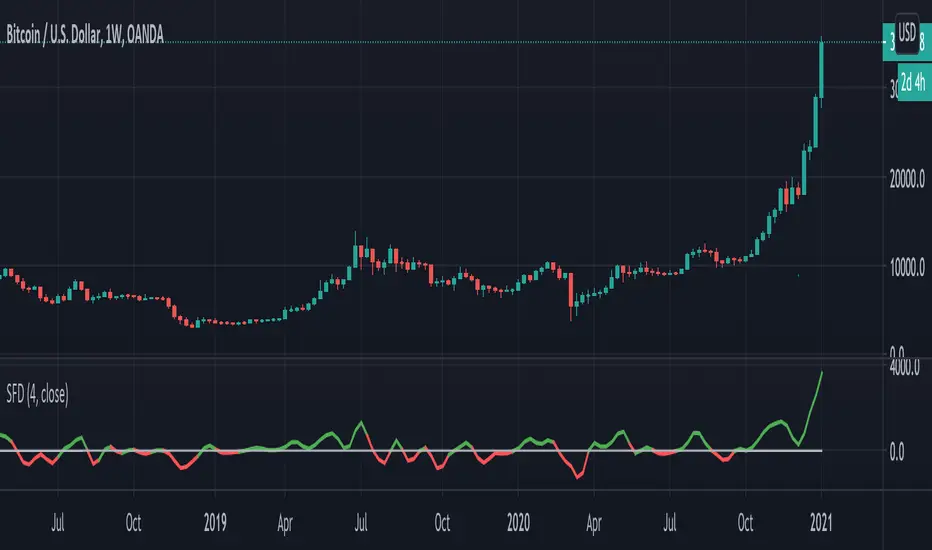
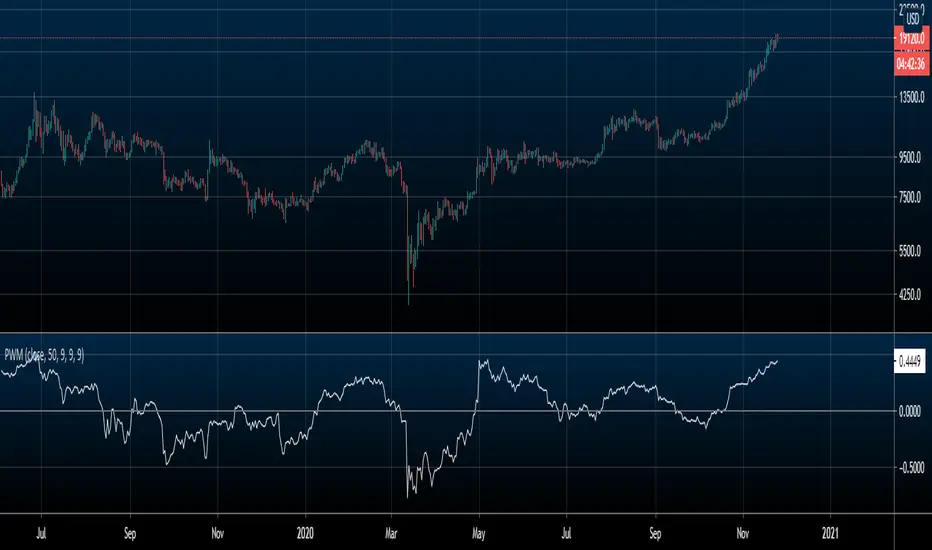
Price Weighted MomentumThis indicator is a momentum indicator that is standardized by price. A.K.A (momentum / price)
The purpose of this indicator is to compare momentum between different assets regardless of price.
EX: Bitcoin will always have more momentum than XLE because it's price is $19000 (as of writing this) compared to XLE's price of $40 (as of writing this). But if you divide the momentum by price, you get a standardized value to better compare the 2.
This indicator can be used to compare everything on TradingView.
HOW TO USE/INTERPRET
Positive values denote an uptrend
Negative values denote a downtrend
A value of 0 (or very very close to 0) denotes sideways price action
WHAT'S INCLUDED
Price Weighted Momentum (Unsmoothed by default)
Optional smoothing with either a simple or exponential moving average
Side note: I only added functionality of smoothing for EMA and SMA for my personal uses, but if you want a version of this with another way of smoothing (e.g. HMA, SSMA, etc.) that you would like, the cost of me adding that for you is a follow on Twitter. Just DM me there :)
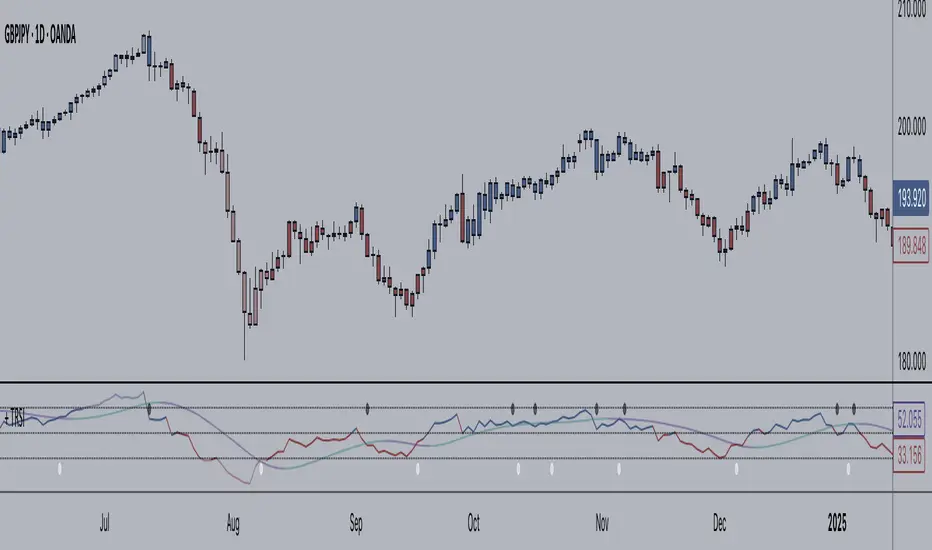
Trend Average (Expo)
Trend Average (Expo) measures the overall trend strength and how strong the current price move/momentum is. The color of the average helps to identify the strength and momentum of the trend.
The user can enable Bar Color that coloring the candlesticks based on the trend strength.
The user can choose between different average calculations, such as SMA, WMA, HMA, to mention a few.
This indicator is for those that don't want to have the Trend Oscillator (Expo) but still want to keep track of the trend strength and direction. There is a minor difference in how the trend is calculated due to the nature of input variables.
HOW TO USE
Identify the trend strength and direction
Identify current momentum
INDICATOR IN ACTION
Daily chart
I hope you find this indicator useful , and please comment or contact me if you like the script or have any questions/suggestions for future improvements. Thanks!
I will continually work on this indicator, so please share your experience and feedback as it will enable me to make even better improvements. Thanks to everyone that has already contacted me regarding my scripts. Your feedback is valuable for future developments!
-----------------
Disclaimer
Copyright by Zeiierman.
The information contained in my scripts/indicators/ideas does not constitute financial advice or a solicitation to buy or sell any securities of any type. I will not accept liability for any loss or damage, including without limitation any loss of profit, which may arise directly or indirectly from the use of or reliance on such information.
All investments involve risk, and the past performance of a security, industry, sector, market, financial product, trading strategy, or individual’s trading does not guarantee future results or returns. Investors are fully responsible for any investment decisions they make. Such decisions should be based solely on an evaluation of their financial circumstances, investment objectives, risk tolerance, and liquidity needs.
My scripts/indicators/strategies/ideas are only for educational purposes!
ACCESS THE INDICATOR
• Contact me on TradingView or use the links below

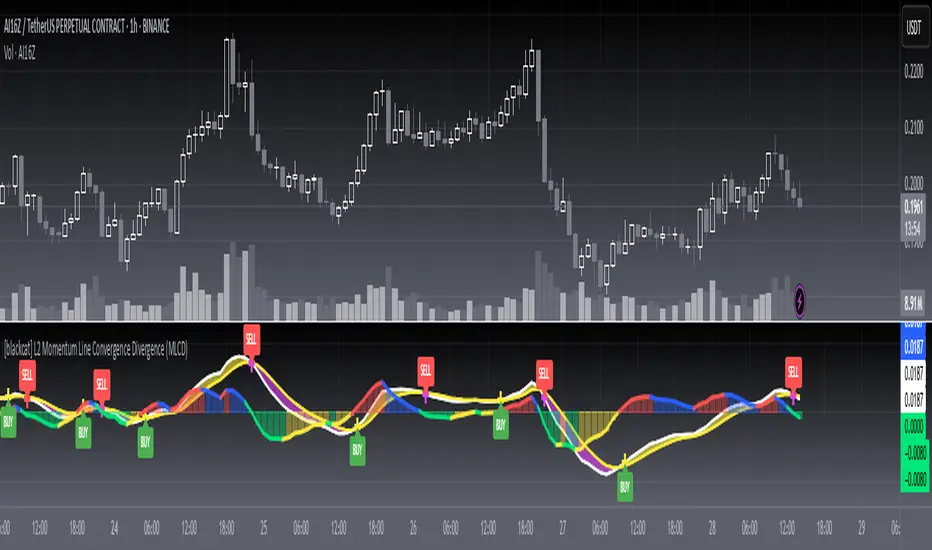
[blackcat] L2 Momentum Line Convergence Divergence (MLCD)Level: 2
Background
Momentum indicators are technical analysis tools that can be used to determine the strength or weakness of the stock price. Momentum measures the speed at which stock prices rise or fall. Common momentum indicators are the relative strength index (RSI) and the moving average of convergence divergence (MACD).
Function
L2 Momentum Line Convergence Divergence (MLCD) is one of my innovative indicator which is to differeniate with average of convergence divergence (MACD). So, I named it as Momentum Line Convergence Divergence (MLCD). In order for everyone to be more familiar with its useage, I inherited the traditional MACD expression method, and added golden cross (yellow cross) and dead cross (fuchsia cross) prompts, as well as bottom divergence (lime cross) and top divergence (red cross) prompts.
Key Signal
mtm --> momentum fast line
mtmaux --> momentum slow line
mtmgx --> momentum gold cross in yellow
mtmdx --> momentum dead cross in fuchsia
mtmbotdiverg --> momentum bottom divergence alert in lime cross
mtmtopdiverg --> momentum top divergence alert in red cross
Pros and Cons
Pros:
1. very stable for market price change and trend following
2. visual bottom and top divergence alerts are provided
Cons:
To be found yet
Remarks
Blackcat1402 brand MLCD indicator
Readme
In real life, I am a prolific inventor. I have successfully applied for more than 60 international and regional patents in the past 12 years. But in the past two years or so, I have tried to transfer my creativity to the development of trading strategies. Tradingview is the ideal platform for me. I am selecting and contributing some of the hundreds of scripts to publish in Tradingview community. Welcome everyone to interact with me to discuss these interesting pine scripts.
The scripts posted are categorized into 5 levels according to my efforts or manhours put into these works.
Level 1 : interesting script snippets or distinctive improvement from classic indicators or strategy. Level 1 scripts can usually appear in more complex indicators as a function module or element.
Level 2 : composite indicator/strategy. By selecting or combining several independent or dependent functions or sub indicators in proper way, the composite script exhibits a resonance phenomenon which can filter out noise or fake trading signal to enhance trading confidence level.
Level 3 : comprehensive indicator/strategy. They are simple trading systems based on my strategies. They are commonly containing several or all of entry signal, close signal, stop loss, take profit, re-entry, risk management, and position sizing techniques. Even some interesting fundamental and mass psychological aspects are incorporated.
Level 4 : script snippets or functions that do not disclose source code. Interesting element that can reveal market laws and work as raw material for indicators and strategies. If you find Level 1~2 scripts are helpful, Level 4 is a private version that took me far more efforts to develop.
Level 5 : indicator/strategy that do not disclose source code. private version of Level 3 script with my accumulated script processing skills or a large number of custom functions. I had a private function library built in past two years. Level 5 scripts use many of them to achieve private trading strategy.
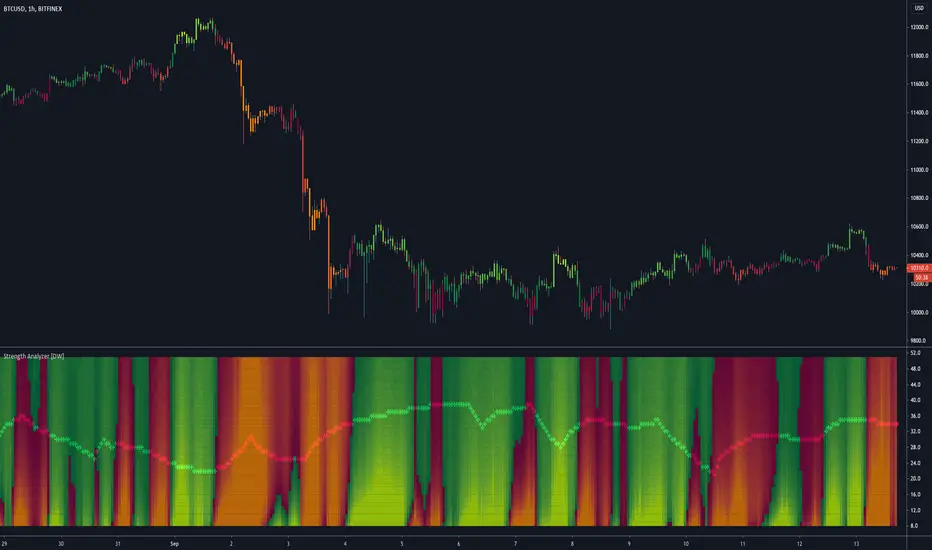
Strength Analyzer [DW]This is an experimental hybrid between relative strength and spectrum analysis methods aimed to deliver useful insights about cyclical dominance and momentum.
This study utilizes a modified RSI formula and a modified Goertzel algorithm to determine relative strength and spectral dominance for periods 8 through 50.
These periods are theorized by many analysts to be the main cyclical components of market movement.
In this study, you are given the option to apply equalization (EQ) to the dataset before estimating strength.
This enables you to transform your data and observe how strength estimates changes as well.
Whether you want to give emphasis to some frequencies, isolate specific bands, or completely alter the shape of your waveform, EQ filtration makes for an interesting experience.
The default EQ preset in this script cuts low end presence, dampens high frequency oscillations, and cleanly passes main cyclic components.
There are many ways to use EQ to transform your dataset, so play around with the settings and find the presets that work best for your analysis setup.
After EQ processing, the data is then passed through the modified RSI algorithm to generate momentum information
The modified RSI in this script is rescaled to oscillate between -1 and 1, and has the option to pass through a 2 pole Butterworth low pass filter before and after processing for a smoother output.
The strength thresholds are determined by the threshold value, which quantifies distance above and below 0.
The threshold value can also be thought of as conventional RSI distance from 50 rescaled so that an increment of 0.1 is equivalent to an increment of 5 on a conventional RSI.
A threshold value of 0.4 is equivalent to thresholds of 70 and 30 on a conventional RSI, so this is the default. The maximum threshold value is 1, which is equivalent to thresholds of 100 and 0.
This script plots colored sections for each period value using a gradient color scheme based on their respective strength estimates.
The color scheme in this script is a multicolored gradient that shows green scaled colors for bullish strength and red scaled colors for bearish strength.
Darker, less vibrant colors indicate lower strength. Brighter, more vibrant colors indicate higher strength.
Strength values near 0 will show the darkest colors, and values near the positive or negative threshold value will show the brightest.
The data is fed parallel through the modified Goertzel algorithm to obtain cyclic power information and to estimate the dominant cycle.
Gerald Goertzel's algorithm is a unique Fourier related transform that identifies tonal properties by quantifying resonance in a set of second order IIR filters with direct-form structure.
It is computationally more efficient than typical DFT or FFT algorithms, and yields decent spectral resolution.
In this variation of the algorithm, data is first passed through a 2 pole high pass filter to attenuate spectral dilation, then passed through a Hamming Window to tidy up the frequency range.
The clean windowed data is then passed through a recursive resonance loop over the frequency block to calculate filter coefficients, which are then used to identify real and imaginary magnitude components.
From there, the magnitude components are used to calculate cyclic power.
The power outputs of each period are then compared for dominant cycle estimation, which is plotted over the gradient.
The dominant cycle can also be optionally smoothed or halved based on your preferences.
Bar colors are included in this script. The color scheme is a gradient based on dominant cycle momentum.
Signals and alert conditions are included in this script as well, and can be customized to your liking.
The two main signal types in this script are:
-> Dominant Cycle - Signals based on dominant cycle or half dominant cycle changes from positive to negative strength or vice versa.
-> Confluence - Signals based on confluence emergence. Based on the majority of measured cycles or all measured cycles showing positive or negative strength.
The signals in this are also externally accessible by other scripts.
The output format is 1 for long signals, and -1 for short signals.
To integrate these signals with your own system, use a source input in your script and assign it to this script's "Direction Signals" output variable from the dropdown tab.
In addition, I included two external output variables that show dominant cycle strength and average cycle strength.
They can be integrated into your own scripts by using a source input and selecting the proper output variable, just like the signals.
The Strength Analyzer is a versatile and powerful analytical tool to have in the arsenal for generating unique insights about momentum and cycle dominance.
By analyzing strength on a spectral basis, we can look at relative price movements on a deeper level and gain insights that aren't necessarily obvious from simply looking at a price chart.
------------------------------------------------
This is a premium script, and access is provided on an invite-only basis.
To gain access, get a copy of the script overview, or for any other inquiries, send me a direct message!
I look forward to hearing from you!
------------------------------------------------
General Disclaimer:
Trading stocks, futures, Forex, options, ETFs, cryptocurrencies or any other financial instrument has large potential rewards, but also large potential risk.
You must be aware of the risks and be willing to accept them in order to invest in stocks, futures, Forex, options, ETFs or cryptocurrencies.
Don’t trade with money you can’t afford to lose.
This is neither a solicitation nor an offer to Buy/Sell stocks, futures, Forex, options, ETFs, cryptocurrencies or any other financial instrument.
No representation is being made that any account will or is likely to achieve profits or losses of any kind.
The past performance of any trading system or methodology is not necessarily indicative of future results.
------------------------------------------------
Note:
Because TV's UI can't handle displaying style options for 43 fills with 42 colors, the color scheme of the analyzer is currently not editable.
However, no other sacrifices to functionality or quality were made in this project.
As the TV team performs updates on the platform, the ability to customize this color scheme will likely come as well.
Also, it's important to note that this script uses a heavy amount of calculations to generate this output.
At times (very infrequently), TV will throw an error message saying "Calculation Takes Too Long", likely due to a momentary lull in available server space.
If you receive this error, simply hide then unhide the indicator, and everything should function as expected.
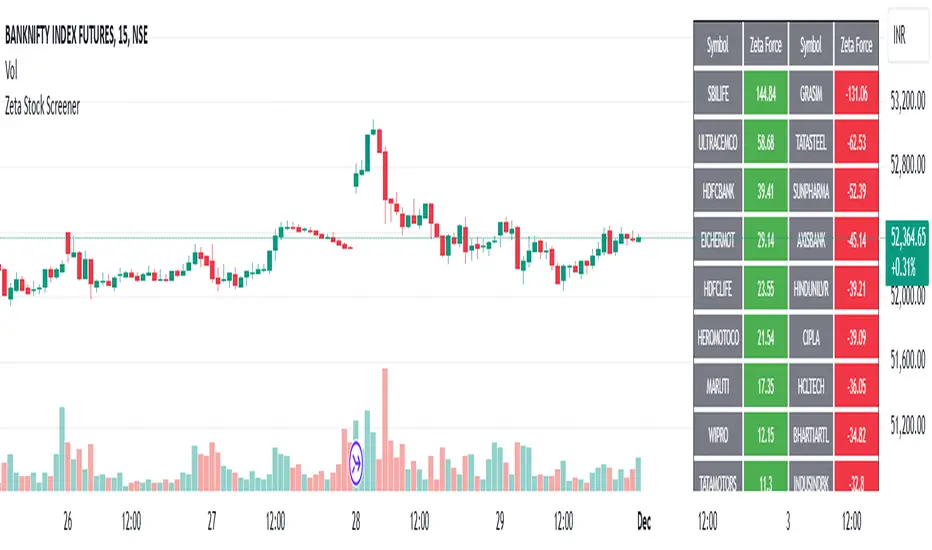
Zeta ScannerIt is a well known fact that actual drivers of the market are Big Institutions, Mutual Funds & Big Guys with deep pockets.
They have large amounts of money to invest and they buy & sell in bulk.
When they buy, often their objective is to buy at lower levels (below average price of the day) & when they sell they sell at higher levels (above average price of the day).
Zeta Scanner seeks to detect this activity. When aggressive buying or selling starts where Buying & Selling Forces become unequal, the Price starts moving in one direction with candles making Higher Highs or Lower Lows.
Zeta Scanner detects these Higher Highs or Lower Lows and generates Buy or Sell signals when this happens.
In order to use this scanner, simply deploy this on your chart, and wait for Buy/Sell signals.
Primarily, it is meant for Intraday trades and works best with 5 min, 10 min, 15 min & 30 min. time frames.
When a Buy Signal is followed by Sell signal (let it be after 3 - 4 candles or after many candles) or vice-versa, you have to switch your position to make most of the reverse move.
It is a general purpose indicator and may be used on stocks, commodities and currencies alike and is not meant for any specific market.
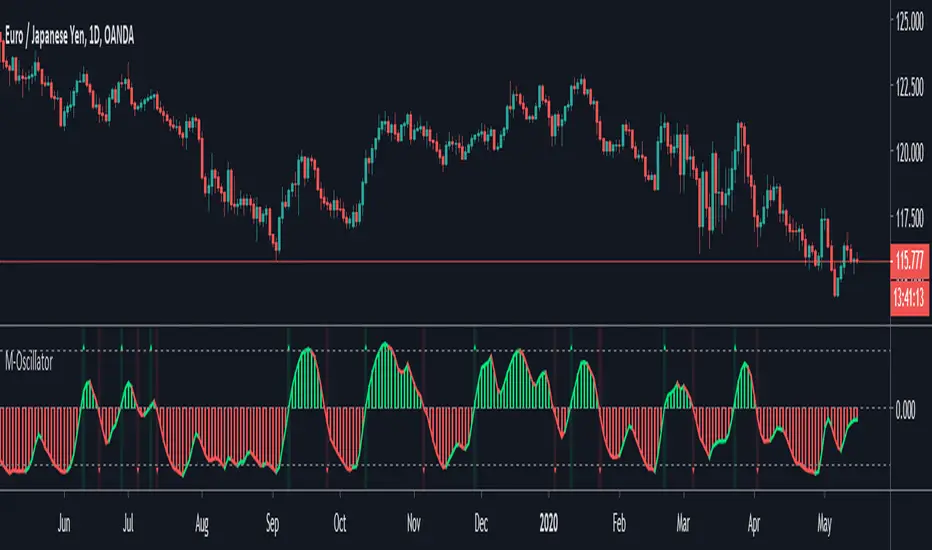
M-OscillatorM-Oscillator developed By Mohamed Fawzy, MFTA, CFTe
as Written in IFTA Journal 2018 Edition
more info : ifta.org
Interpretation
• M-Oscillator is a bounded oscillator that moves between (-14) and (+14),
• Movement above 10 is considered overbought, and movement below -10 is oversold.
Overbought/Oversold rule:
• Buy when the M-Oscillator violates the (-10) level to the downside and crosses back to the upside.
• Sell when the M-Oscillator crosses above the (+10) level and crosses back to the downside.
Crossover on Extreme Levels
• Sell signals are triggered when the M-Oscillator crosses its signal line above (13), which indicates an extreme market condition
• Buy signals are triggered when the M-Oscillator crosses its signal line below (- 13)
Double Smoothed Relative Strength IndexThe Double Smoothed RSI Indicator was created by William Blau (Stocks & Commodities V. 9:5 (202-205)) and is a variation of the classic RSI using his Momenta Indicator and his Momenta RSI formula. I have color coded everything to make it very easy to determine buy and sell signals.
Let me know if you would like to see me write scripts for other indicators!

Momenta Relative Strength IndexThe Momenta RSI Indicator was created by William Blau (Stocks & Commodities V. 9:5 (202-205)) and is a variation of the classic RSI using his Momenta Indicator formula. I have color coded everything to make it very easy to determine buy and sell signals.
Let me know if you would like to see me write scripts for other indicators!

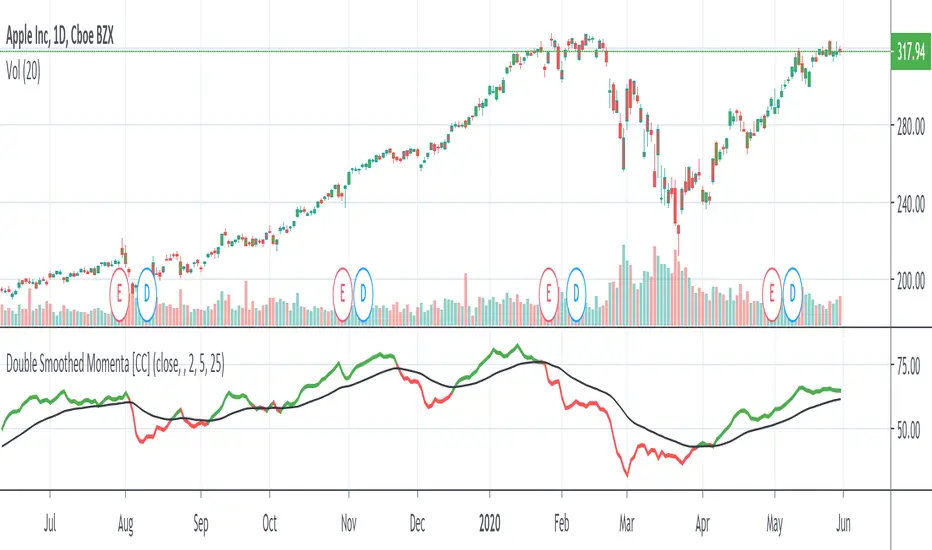
Double Smoothed MomentaDouble Smoothed Momenta was created by William Blau (Stocks & Commodities V. 9:5 (202-205)). His original indicator didn't use a signal period so I added one to notify you when to buy or sell. Buy when the indicator goes over the signal line and sell when it is falls below the signal line.
Let me know what other indicators you would like me to write scripts for!