MTF Signal XpertMTF Signal Xpert – Detailed Description
Overview:
MTF Signal Xpert is a proprietary, open‑source trading signal indicator that fuses multiple technical analysis methods into one cohesive strategy. Developed after rigorous backtesting and extensive research, this advanced tool is designed to deliver clear BUY and SELL signals by analyzing trend, momentum, and volatility across various timeframes. Its integrated approach not only enhances signal reliability but also incorporates dynamic risk management, helping traders protect their capital while navigating complex market conditions.
Detailed Explanation of How It Works:
Trend Detection via Moving Averages
Dual Moving Averages:
MTF Signal Xpert computes two moving averages—a fast MA and a slow MA—with the flexibility to choose from Simple (SMA), Exponential (EMA), or Hull (HMA) methods. This dual-MA system helps identify the prevailing market trend by contrasting short-term momentum with longer-term trends.
Crossover Logic:
A BUY signal is initiated when the fast MA crosses above the slow MA, coupled with the condition that the current price is above the lower Bollinger Band. This suggests that the market may be emerging from a lower price region. Conversely, a SELL signal is generated when the fast MA crosses below the slow MA and the price is below the upper Bollinger Band, indicating potential bearish pressure.
Recent Crossover Confirmation:
To ensure that signals reflect current market dynamics, the script tracks the number of bars since the moving average crossover event. Only crossovers that occur within a user-defined “candle confirmation” period are considered, which helps filter out outdated signals and improves overall signal accuracy.
Volatility and Price Extremes with Bollinger Bands
Calculation of Bands:
Bollinger Bands are calculated using a 20‑period simple moving average as the central basis, with the upper and lower bands derived from a standard deviation multiplier. This creates dynamic boundaries that adjust according to recent market volatility.
Signal Reinforcement:
For BUY signals, the condition that the price is above the lower Bollinger Band suggests an undervalued market condition, while for SELL signals, the price falling below the upper Bollinger Band reinforces the bearish bias. This volatility context adds depth to the moving average crossover signals.
Momentum Confirmation Using Multiple Oscillators
RSI (Relative Strength Index):
The RSI is computed over 14 periods to determine if the market is in an overbought or oversold state. Only readings within an optimal range (defined by user inputs) validate the signal, ensuring that entries are made during balanced conditions.
MACD (Moving Average Convergence Divergence):
The MACD line is compared with its signal line to assess momentum. A bullish scenario is confirmed when the MACD line is above the signal line, while a bearish scenario is indicated when it is below, thus adding another layer of confirmation.
Awesome Oscillator (AO):
The AO measures the difference between short-term and long-term simple moving averages of the median price. Positive AO values support BUY signals, while negative values back SELL signals, offering additional momentum insight.
ADX (Average Directional Index):
The ADX quantifies trend strength. MTF Signal Xpert only considers signals when the ADX value exceeds a specified threshold, ensuring that trades are taken in strongly trending markets.
Optional Stochastic Oscillator:
An optional stochastic oscillator filter can be enabled to further refine signals. It checks for overbought conditions (supporting SELL signals) or oversold conditions (supporting BUY signals), thus reducing ambiguity.
Multi-Timeframe Verification
Higher Timeframe Filter:
To align short-term signals with broader market trends, the script calculates an EMA on a higher timeframe as specified by the user. This multi-timeframe approach helps ensure that signals on the primary chart are consistent with the overall trend, thereby reducing false signals.
Dynamic Risk Management with ATR
ATR-Based Calculations:
The Average True Range (ATR) is used to measure current market volatility. This value is multiplied by a user-defined factor to dynamically determine stop loss (SL) and take profit (TP) levels, adapting to changing market conditions.
Visual SL/TP Markers:
The calculated SL and TP levels are plotted on the chart as distinct colored dots, enabling traders to quickly identify recommended exit points.
Optional Trailing Stop:
An optional trailing stop feature is available, which adjusts the stop loss as the trade moves favorably, helping to lock in profits while protecting against sudden reversals.
Risk/Reward Ratio Calculation:
MTF Signal Xpert computes a risk/reward ratio based on the dynamic SL and TP levels. This quantitative measure allows traders to assess whether the potential reward justifies the risk associated with a trade.
Condition Weighting and Signal Scoring
Binary Condition Checks:
Each technical condition—ranging from moving average crossovers, Bollinger Band positioning, and RSI range to MACD, AO, ADX, and volume filters—is assigned a binary score (1 if met, 0 if not).
Cumulative Scoring:
These individual scores are summed to generate cumulative bullish and bearish scores, quantifying the overall strength of the signal and providing traders with an objective measure of its viability.
Detailed Signal Explanation:
A comprehensive explanation string is generated, outlining which conditions contributed to the current BUY or SELL signal. This explanation is displayed on an on‑chart dashboard, offering transparency and clarity into the signal generation process.
On-Chart Visualizations and Debug Information
Chart Elements:
The indicator plots all key components—moving averages, Bollinger Bands, SL and TP markers—directly on the chart, providing a clear visual framework for understanding market conditions.
Combined Dashboard:
A dedicated dashboard displays key metrics such as RSI, ADX, and the bullish/bearish scores, alongside a detailed explanation of the current signal. This consolidated view allows traders to quickly grasp the underlying logic.
Debug Table (Optional):
For advanced users, an optional debug table is available. This table breaks down each individual condition, indicating which criteria were met or not met, thus aiding in further analysis and strategy refinement.
Mashup Justification and Originality
MTF Signal Xpert is more than just an aggregation of existing indicators—it is an original synthesis designed to address real-world trading complexities. Here’s how its components work together:
Integrated Trend, Volatility, and Momentum Analysis:
By combining moving averages, Bollinger Bands, and multiple oscillators (RSI, MACD, AO, ADX, and an optional stochastic), the indicator captures diverse market dynamics. Each component reinforces the others, reducing noise and filtering out false signals.
Multi-Timeframe Analysis:
The inclusion of a higher timeframe filter aligns short-term signals with longer-term trends, enhancing overall reliability and reducing the potential for contradictory signals.
Adaptive Risk Management:
Dynamic stop loss and take profit levels, determined using ATR, ensure that the risk management strategy adapts to current market conditions. The optional trailing stop further refines this approach, protecting profits as the market evolves.
Quantitative Signal Scoring:
The condition weighting system provides an objective measure of signal strength, giving traders clear insight into how each technical component contributes to the final decision.
How to Use MTF Signal Xpert:
Input Customization:
Adjust the moving average type and period settings, ATR multipliers, and oscillator thresholds to align with your trading style and the specific market conditions.
Enable or disable the optional stochastic oscillator and trailing stop based on your preference.
Interpreting the Signals:
When a BUY or SELL signal appears, refer to the on‑chart dashboard, which displays key metrics (e.g., RSI, ADX, bullish/bearish scores) along with a detailed breakdown of the conditions that triggered the signal.
Review the SL and TP markers on the chart to understand the associated risk/reward setup.
Risk Management:
Use the dynamically calculated stop loss and take profit levels as guidelines for setting your exit points.
Evaluate the provided risk/reward ratio to ensure that the potential reward justifies the risk before entering a trade.
Debugging and Verification:
Advanced users can enable the debug table to see a condition-by-condition breakdown of the signal generation process, helping refine the strategy and deepen understanding of market dynamics.
Disclaimer:
MTF Signal Xpert is intended for educational and analytical purposes only. Although it is based on robust technical analysis methods and has undergone extensive backtesting, past performance is not indicative of future results. Traders should employ proper risk management and adjust the settings to suit their financial circumstances and risk tolerance.
MTF Signal Xpert represents a comprehensive, original approach to trading signal generation. By blending trend detection, volatility assessment, momentum analysis, multi-timeframe alignment, and adaptive risk management into one integrated system, it provides traders with actionable signals and the transparency needed to understand the logic behind them.
Momentumstrategy

[COG] Adaptive Squeeze Intensity 📊 Adaptive Squeeze Intensity (ASI) Indicator
🎯 Overview
The Adaptive Squeeze Intensity (ASI) indicator is an advanced technical analysis tool that combines the power of volatility compression analysis with momentum, volume, and trend confirmation to identify high-probability trading opportunities. It quantifies the degree of price compression using a sophisticated scoring system and provides clear entry signals for both long and short positions.
⭐ Key Features
- 📈 Comprehensive squeeze intensity scoring system (0-100)
- 📏 Multiple Keltner Channel compression zones
- 📊 Volume analysis integration
- 🎯 EMA-based trend confirmation
- 🎨 Proximity-based entry validation
- 📱 Visual status monitoring
- 🎨 Customizable color schemes
- ⚡ Clear entry signals with directional indicators
🔧 Components
1. 📐 Squeeze Intensity Score (0-100)
The indicator calculates a total squeeze intensity score based on four components:
- 📊 Band Convergence (0-40 points): Measures the relationship between Bollinger Bands and Keltner Channels
- 📍 Price Position (0-20 points): Evaluates price location relative to the base channels
- 📈 Volume Intensity (0-20 points): Analyzes volume patterns and thresholds
- ⚡ Momentum (0-20 points): Assesses price momentum and direction
2. 🎨 Compression Zones
Visual representation of squeeze intensity levels:
- 🔴 Extreme Squeeze (80-100): Red zone
- 🟠 Strong Squeeze (60-80): Orange zone
- 🟡 Moderate Squeeze (40-60): Yellow zone
- 🟢 Light Squeeze (20-40): Green zone
- ⚪ No Squeeze (0-20): Base zone
3. 🎯 Entry Signals
The indicator generates entry signals based on:
- ✨ Squeeze release confirmation
- ➡️ Momentum direction
- 📊 Candlestick pattern confirmation
- 📈 Optional EMA trend alignment
- 🎯 Customizable EMA proximity validation
⚙️ Settings
🔧 Main Settings
- Base Length: Determines the calculation period for main indicators
- BB Multiplier: Sets the Bollinger Bands deviation multiplier
- Keltner Channel Multipliers: Three separate multipliers for different compression zones
📈 Trend Confirmation
- Four customizable EMA periods (default: 21, 34, 55, 89)
- Optional trend requirement for entry signals
- Adjustable EMA proximity threshold
📊 Volume Analysis
- Customizable volume MA length
- Adjustable volume threshold for signal confirmation
- Option to enable/disable volume analysis
🎨 Visualization
- Customizable bullish/bearish colors
- Optional intensity zones display
- Status monitor with real-time score and state information
- Clear entry arrows and background highlights
💻 Technical Code Breakdown
1. Core Calculations
// Base calculations for EMAs
ema_1 = ta.ema(close, ema_length_1)
ema_2 = ta.ema(close, ema_length_2)
ema_3 = ta.ema(close, ema_length_3)
ema_4 = ta.ema(close, ema_length_4)
// Proximity calculation for entry validation
ema_prox_raw = math.abs(close - ema_1) / ema_1 * 100
is_close_to_ema_long = close > ema_1 and ema_prox_raw <= prox_percent
```
### 2. Squeeze Detection System
```pine
// Bollinger Bands setup
BB_basis = ta.sma(close, length)
BB_dev = ta.stdev(close, length)
BB_upper = BB_basis + BB_mult * BB_dev
BB_lower = BB_basis - BB_mult * BB_dev
// Keltner Channels setup
KC_basis = ta.sma(close, length)
KC_range = ta.sma(ta.tr, length)
KC_upper_high = KC_basis + KC_range * KC_mult_high
KC_lower_high = KC_basis - KC_range * KC_mult_high
```
### 3. Scoring System Implementation
```pine
// Band Convergence Score
band_ratio = BB_width / KC_width
convergence_score = math.max(0, 40 * (1 - band_ratio))
// Price Position Score
price_range = math.abs(close - KC_basis) / (KC_upper_low - KC_lower_low)
position_score = 20 * (1 - price_range)
// Final Score Calculation
squeeze_score = convergence_score + position_score + vol_score + mom_score
```
### 4. Signal Generation
```pine
// Entry Signal Logic
long_signal = squeeze_release and
is_momentum_positive and
(not use_ema_trend or (bullish_trend and is_close_to_ema_long)) and
is_bullish_candle
short_signal = squeeze_release and
is_momentum_negative and
(not use_ema_trend or (bearish_trend and is_close_to_ema_short)) and
is_bearish_candle
```
📈 Trading Signals
🚀 Long Entry Conditions
- Squeeze release detected
- Positive momentum
- Bullish candlestick
- Price above relevant EMAs (if enabled)
- Within EMA proximity threshold (if enabled)
- Sufficient volume confirmation (if enabled)
🔻 Short Entry Conditions
- Squeeze release detected
- Negative momentum
- Bearish candlestick
- Price below relevant EMAs (if enabled)
- Within EMA proximity threshold (if enabled)
- Sufficient volume confirmation (if enabled)
⚠️ Alert Conditions
- 🔔 Extreme squeeze level reached (score crosses above 80)
- 🚀 Long squeeze release signal
- 🔻 Short squeeze release signal
💡 Tips for Usage
1. 📱 Use the status monitor to track real-time squeeze intensity and state
2. 🎨 Pay attention to the color gradient for trend direction and strength
3. ⏰ Consider using multiple timeframes for confirmation
4. ⚙️ Adjust EMA and proximity settings based on your trading style
5. 📊 Use volume analysis for additional confirmation in liquid markets
📝 Notes
- 🔧 The indicator combines multiple technical analysis concepts for robust signal generation
- 📈 Suitable for all tradable markets and timeframes
- ⭐ Best results typically achieved in trending markets with clear volatility cycles
- 🎯 Consider using in conjunction with other technical analysis tools for confirmation
⚠️ Disclaimer
This technical indicator is designed to assist in analysis but should not be considered as financial advice. Always perform your own analysis and risk management when trading.

GOLDEN RSI by @thejamiulGOLDEN RSI thejamiul is a versatile Relative Strength Index (RSI)-based tool designed to provide enhanced visualization and additional insights into market trends and potential reversal points. This indicator improves upon the traditional RSI by integrating gradient fills for overbought/oversold zones and divergence detection features, making it an excellent choice for traders who seek precise and actionable signals.
Source of this indicator : This indicator is based on @TradingView original RSI indicator with a little bit of customisation to enhance overbought and oversold identification.
Key Features
1. Customizable RSI Settings:
RSI Length: Adjust the RSI calculation period to suit your trading style (default: 14).
Source Selection: Choose the price source (e.g., close, open, high, low) for RSI calculation.
2. Gradient-Filled RSI Zones:
Overbought Zone (80-100): Gradient fill with shades of green to indicate strong bullish conditions.
Oversold Zone (0-20): Gradient fill with shades of red to highlight strong bearish conditions.
3. Support and Resistance Levels:
Upper Band: 80
Middle Bands: 60 (bullish) and 40 (bearish)
Lower Band: 20
These levels help identify overbought, oversold, and neutral zones.
4. Divergence Detection:
Bullish Divergence: Detects lower lows in price with corresponding higher lows in RSI, signaling potential upward reversals.
Bearish Divergence: Detects higher highs in price with corresponding lower highs in RSI, indicating potential downward reversals.
Visual Indicators:
Bullish divergence is marked with green labels and line plots.
Bearish divergence is marked with red labels and line plots.
5. Alert Functionality:
Custom Alerts: Set up alerts for bullish or bearish divergences to stay notified of potential trading opportunities without constant chart monitoring.
6. Enhanced Chart Visualization:
RSI Plot: A smooth and visually appealing RSI curve.
Color Coding: Gradient and fills for better distinction of trading zones.
Pivot Labels: Clear identification of divergence points on the RSI plot.

Bollinger Bands color candlesThis Pine Script indicator applies Bollinger Bands to the price chart and visually highlights candles based on their proximity to the upper and lower bands. The script plots colored candles as follows:
Bullish Close Above Upper Band: Candles are colored green when the closing price is above the upper Bollinger Band, indicating strong bullish momentum.
Bearish Close Below Lower Band: Candles are colored red when the closing price is below the lower Bollinger Band, signaling strong bearish momentum.
Neutral Candles: Candles that close within the bands remain their default color.
This visual aid helps traders quickly identify potential breakout or breakdown points based on Bollinger Band dynamics.

Kernel Regression Envelope with SMI OscillatorThis script combines the predictive capabilities of the **Nadaraya-Watson estimator**, implemented by the esteemed jdehorty (credit to him for his excellent work on the `KernelFunctions` library and the original Nadaraya-Watson Envelope indicator), with the confirmation strength of the **Stochastic Momentum Index (SMI)** to create a dynamic trend reversal strategy. The core idea is to identify potential overbought and oversold conditions using the Nadaraya-Watson Envelope and then confirm these signals with the SMI before entering a trade.
**Understanding the Nadaraya-Watson Envelope:**
The Nadaraya-Watson estimator is a non-parametric regression technique that essentially calculates a weighted average of past price data to estimate the current underlying trend. Unlike simple moving averages that give equal weight to all past data within a defined period, the Nadaraya-Watson estimator uses a **kernel function** (in this case, the Rational Quadratic Kernel) to assign weights. The key parameters influencing this estimation are:
* **Lookback Window (h):** This determines how many historical bars are considered for the estimation. A larger window results in a smoother estimation, while a smaller window makes it more reactive to recent price changes.
* **Relative Weighting (alpha):** This parameter controls the influence of different time frames in the estimation. Lower values emphasize longer-term price action, while higher values make the estimator more sensitive to shorter-term movements.
* **Start Regression at Bar (x\_0):** This allows you to exclude the potentially volatile initial bars of a chart from the calculation, leading to a more stable estimation.
The script calculates the Nadaraya-Watson estimation for the closing price (`yhat_close`), as well as the highs (`yhat_high`) and lows (`yhat_low`). The `yhat_close` is then used as the central trend line.
**Dynamic Envelope Bands with ATR:**
To identify potential entry and exit points around the Nadaraya-Watson estimation, the script uses **Average True Range (ATR)** to create dynamic envelope bands. ATR measures the volatility of the price. By multiplying the ATR by different factors (`nearFactor` and `farFactor`), we create multiple bands:
* **Near Bands:** These are closer to the Nadaraya-Watson estimation and are intended to identify potential immediate overbought or oversold zones.
* **Far Bands:** These are further away and can act as potential take-profit or stop-loss levels, representing more extreme price extensions.
The script calculates both near and far upper and lower bands, as well as an average between the near and far bands. This provides a nuanced view of potential support and resistance levels around the estimated trend.
**Confirming Reversals with the Stochastic Momentum Index (SMI):**
While the Nadaraya-Watson Envelope identifies potential overextended conditions, the **Stochastic Momentum Index (SMI)** is used to confirm a potential trend reversal. The SMI, unlike a traditional stochastic oscillator, oscillates around a zero line. It measures the location of the current closing price relative to the median of the high/low range over a specified period.
The script calculates the SMI on a **higher timeframe** (defined by the "Timeframe" input) to gain a broader perspective on the market momentum. This helps to filter out potential whipsaws and false signals that might occur on the current chart's timeframe. The SMI calculation involves:
* **%K Length:** The lookback period for calculating the highest high and lowest low.
* **%D Length:** The period for smoothing the relative range.
* **EMA Length:** The period for smoothing the SMI itself.
The script uses a double EMA for smoothing within the SMI calculation for added smoothness.
**How the Indicators Work Together in the Strategy:**
The strategy enters a long position when:
1. The closing price crosses below the **near lower band** of the Nadaraya-Watson Envelope, suggesting a potential oversold condition.
2. The SMI crosses above its EMA, indicating positive momentum.
3. The SMI value is below -50, further supporting the oversold idea on the higher timeframe.
Conversely, the strategy enters a short position when:
1. The closing price crosses above the **near upper band** of the Nadaraya-Watson Envelope, suggesting a potential overbought condition.
2. The SMI crosses below its EMA, indicating negative momentum.
3. The SMI value is above 50, further supporting the overbought idea on the higher timeframe.
Trades are closed when the price crosses the **far band** in the opposite direction of the trade. A stop-loss is also implemented based on a fixed value.
**In essence:** The Nadaraya-Watson Envelope identifies areas where the price might be deviating significantly from its estimated trend. The SMI, calculated on a higher timeframe, then acts as a confirmation signal, suggesting that the momentum is shifting in the direction of a potential reversal. The ATR-based bands provide dynamic entry and exit points based on the current volatility.
**How to Use the Script:**
1. **Apply the script to your chart.**
2. **Adjust the "Kernel Settings":**
* **Lookback Window (h):** Experiment with different values to find the smoothness that best suits the asset and timeframe you are trading. Lower values make the envelope more reactive, while higher values make it smoother.
* **Relative Weighting (alpha):** Adjust to control the influence of different timeframes on the Nadaraya-Watson estimation.
* **Start Regression at Bar (x\_0):** Increase this value if you want to exclude the initial, potentially volatile, bars from the calculation.
* **Stoploss:** Set your desired stop-loss value.
3. **Adjust the "SMI" settings:**
* **%K Length, %D Length, EMA Length:** These parameters control the sensitivity and smoothness of the SMI. Experiment to find settings that work well for your trading style.
* **Timeframe:** Select the higher timeframe you want to use for SMI confirmation.
4. **Adjust the "ATR Length" and "Near/Far ATR Factor":** These settings control the width and sensitivity of the envelope bands. Smaller ATR lengths make the bands more reactive to recent volatility.
5. **Customize the "Color Settings"** to your preference.
6. **Observe the plots:**
* The **Nadaraya-Watson Estimation (yhat)** line represents the estimated underlying trend.
* The **near and far upper and lower bands** visualize potential overbought and oversold zones based on the ATR.
* The **fill areas** highlight the regions between the near and far bands.
7. **Look for entry signals:** A long entry is considered when the price touches or crosses below the lower near band and the SMI confirms upward momentum. A short entry is considered when the price touches or crosses above the upper near band and the SMI confirms downward momentum.
8. **Manage your trades:** The script provides exit signals when the price crosses the far band. The fixed stop-loss will also close trades if the price moves against your position.
**Justification for Combining Nadaraya-Watson Envelope and SMI:**
The combination of the Nadaraya-Watson Envelope and the SMI provides a more robust approach to identifying potential trend reversals compared to using either indicator in isolation. The Nadaraya-Watson Envelope excels at identifying potential areas where the price is overextended relative to its recent history. However, relying solely on the envelope can lead to false signals, especially in choppy or volatile markets. By incorporating the SMI as a confirmation tool, we add a momentum filter that helps to validate the potential reversals signaled by the envelope. The higher timeframe SMI further helps to filter out noise and focus on more significant shifts in momentum. The ATR-based bands add a dynamic element to the entry and exit points, adapting to the current market volatility. This mashup aims to leverage the strengths of each indicator to create a more reliable trading strategy.

Multi-Feature IndicatorThe Multi-Feature Indicator combines three popular technical analysis tools — RSI, Moving Averages (MA), and MACD — into a single indicator to provide unified buy and sell signals. This script is designed for traders who want to filter out noise and focus on signals confirmed by multiple criteria.
Features:
RSI (Relative Strength Index):
Measures momentum and identifies overbought (70) and oversold (30) conditions.
A signal is triggered when RSI crosses these thresholds.
Moving Averages (MA):
Uses a short-term moving average (default: 9 periods) and a long-term moving average (default: 21 periods).
Buy signals occur when the short-term MA crosses above the long-term MA, indicating an uptrend.
Sell signals occur when the short-term MA crosses below the long-term MA, indicating a downtrend.
MACD (Moving Average Convergence Divergence):
A trend-following momentum indicator that shows the relationship between two moving averages of an asset's price.
Signals are based on the crossover of the MACD line and its signal line.
Unified Buy and Sell Signals:
Buy Signal: Triggered when:
RSI crosses above 30 (leaving oversold territory).
Short-term MA crosses above the long-term MA.
MACD line crosses above the signal line.
Sell Signal: Triggered when:
RSI crosses below 70 (leaving overbought territory).
Short-term MA crosses below the long-term MA.
MACD line crosses below the signal line.
Visualization:
The indicator plots the short-term and long-term moving averages on the price chart.
Green "BUY" labels appear below price bars when all buy conditions are met.
Red "SELL" labels appear above price bars when all sell conditions are met.
Parameters:
RSI Length: Default is 14. This controls the sensitivity of the RSI.
Short MA Length: Default is 9. This determines the short-term trend.
Long MA Length: Default is 21. This determines the long-term trend.
Use Case:
The Multi-Feature Indicator is ideal for traders seeking higher confirmation before entering or exiting trades. By combining momentum (RSI), trend (MA), and momentum shifts (MACD), it reduces false signals and enhances decision-making.
How to Use:
Apply the indicator to your chart in TradingView.
Look for "BUY" or "SELL" signals, which appear when all conditions align.
Use this tool in conjunction with other analysis techniques for best results.
Note:
The default settings are suitable for many assets, but you may need to adjust them for different timeframes or market conditions.
This indicator is meant to assist in trading decisions and should not be used as the sole basis for trading.

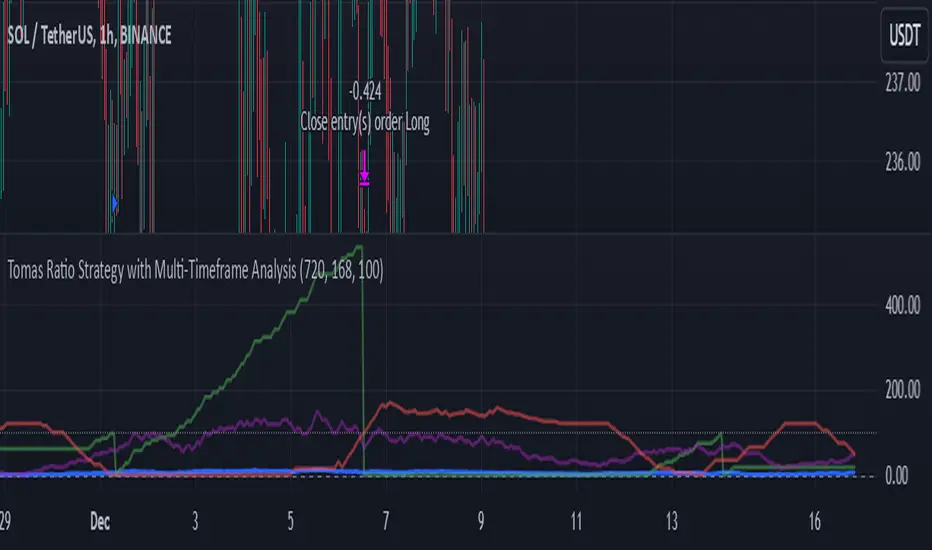
Tomas Ratio Strategy with Multi-Timeframe AnalysisHello,
I would like to present my new indicator I have compiled together inspired by Calmar Ratio which is a ratio that measures gains vs losers but with a little twist.
Basically the idea is that if HLC3 is above HLC3 (or previous one) it will count as a gain and it will calculate the percentage of winners in last 720 hourly bars and then apply 168 hour standard deviation to the weekly average daily gains.
The idea is that you're supposed to buy if the thick blue line goes up and not buy if it goes down (signalized by the signal line). I liked that idea a lot, but I wanted to add an option to fire open and close signals. I have also added a logic that it not open more trades in relation the purple line which shows confidence in buying.
As input I recommend only adjusting the amount of points required to fire a signal. Note that the lower amount you put, the more open trades it will allow (and vice versa)
Feel free to remove that limiter if you want to. It works without it as well, this script is meant for inexperienced eye.
I will also publish a indicator script with this limiter removed and alerts added for you to test this strategy if you so choose to.
Also, I have added that the trades will enter only if price is above 720 period EMA
Disclaimer
This strategy is for educational purposes only and should not be considered financial advice. Always backtest thoroughly and adjust parameters based on your trading style and market conditions.
Made in collaboration with ChatGPT.
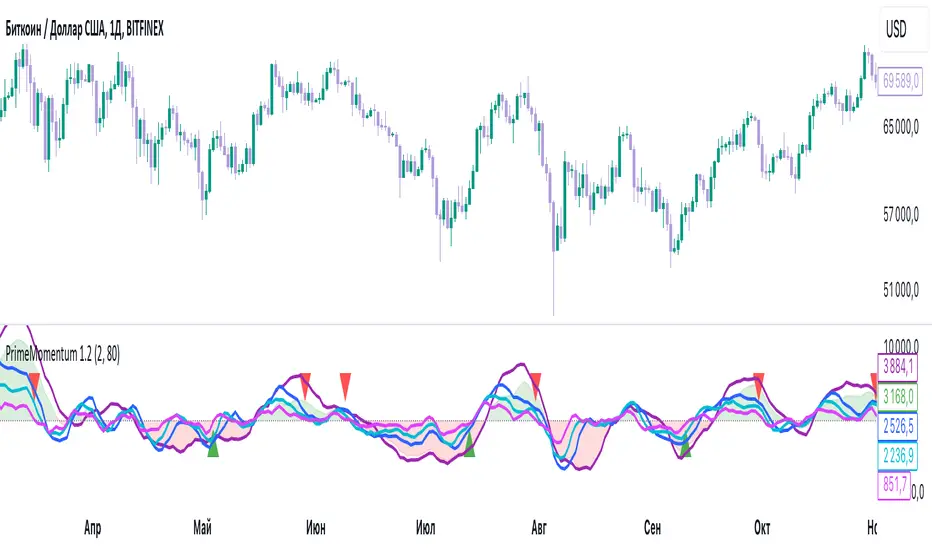
PrimeMomentum 1.1The PrimeMomentum indicator is not just an adaptation of classic tools like MA, BB, RSI, or WaveTrend. It is an innovative tool that combines several key elements and offers a unique methodology for market analysis. Its primary goal is to help traders avoid false entries and provide signals for making trading decisions.
What Makes PrimeMomentum Unique?
Integration of Multi-Timeframe Data with a Unique Signal Filtering Approach
PrimeMomentum processes data from four timeframes simultaneously, not merely to display trends but to assess the synchronization of momentum across each timeframe. This allows traders to receive signals only when all intervals confirm the direction. This approach minimizes the risk of false signals often encountered with standard tools.
PrimeMomentum analyzes the market across four timeframes:
TF1 (long-term): Displays the overall market direction.
TF2 (medium-term): Refines the current dynamics.
TF3 (short-term): Provides detailed analysis.
TF4 (very short-term): Confirms entry or exit points.
The combination of data from these timeframes allows traders to avoid frequent switching between intervals, simplifying analysis.
Innovative Reversal Logic
PrimeMomentum features a specialized algorithm for identifying trend reversals. Its uniqueness lies in the interaction between dynamic smoothing (EMA) and multi-level momentum assessment, enabling accurate identification of potential trend reversal points.
Dynamic Adaptation to Market Conditions
The indicator automatically adjusts smoothing parameters and threshold values based on market volatility. This enables it to adapt effectively to both calm and volatile markets.
Signals for entering Long or Short positions are generated only when the following conditions are met:
- Momentum shifts from negative to positive (for Long) or from positive to negative (for Short).
- Dynamic smoothing confirms the trend.
- Defined thresholds are reached.
Trend Strength Assessment
Unlike traditional indicators, PrimeMomentum evaluates not only the direction but also the strength of a trend by analyzing the relationship between momentum across each timeframe. This helps traders understand how stable the current market movement is.
The indicator analyzes price changes over a specific period, determining how much current prices deviate from previous ones. This data allows for assessing the strength of market movements.
Combination of Classic Elements with Proprietary Logic
While PrimeMomentum may utilize some widely known components like EMA, its algorithm is built on proprietary logic for evaluating market conditions. This sets it apart from standard solutions that merely display basic indicators without deeper analysis.
Added Value of PrimeMomentum
Trend Visualization with Concept Explanations
PrimeMomentum provides traders with clear visual signals, simplifying market analysis. Each element (color, line direction) is based on momentum and trend-smoothing concepts, enabling traders to make decisions quickly.
Results are displayed as color-coded lines:
- Dark violet: Long-term trend.
- Blue: Medium-term trend.
- Turquoise and light blue: Short-term trends.
If all momentum lines reach a peak and begin turning downward, it may indicate an approaching bearish trend.
If all lines reach a bottom and start turning upward, it may signal the beginning of a bullish trend.
Reversals can also serve as signals for exiting positions.
MoneyFlow
The PrimeMomentum indicator includes a visualization of MoneyFlow, allowing traders to assess capital flows within the selected timeframe. This functionality helps to analyze market trends more accurately and make well-informed decisions.
MoneyFlow Features:
Dynamic MoneyFlow Visualization:
MoneyFlow is displayed as an area that changes color based on its value:
- Green (with transparency) when MoneyFlow is above zero (positive flow).
- Red (with transparency) when MoneyFlow is below zero (negative flow).
Automatic Scaling:
MoneyFlow values automatically adjust to the chart’s scale to ensure visibility alongside the Momentum lines.
Double Smoothing:
To ensure a smoother and more representation, MoneyFlow uses double smoothing based on EMA.
Customizable Colors and Transparency:
Traders can customize the colors for positive and negative MoneyFlow and adjust the transparency level to fit their preferences.
How MoneyFlow Works:
- MoneyFlow calculations are based on the MFI (Money Flow Index), which considers both price and volume.
- MoneyFlow values are integrated into the overall PrimeMomentum chart and combined with other signals for deeper analysis.
Advantages of the New Functionality:
- Helps quickly identify capital flows into or out of the market.
- Complements Momentum analysis to provide a more comprehensive view of market conditions.
- Enhances decision-making efficiency through flexible visualization settings.
Note: MoneyFlow adapts to the selected timeframe and displays data corresponding to the current interval on the price chart.
Simplicity for Beginners and Depth for Professionals
The indicator is designed to be user-friendly for traders of all experience levels. Beginners benefit from intuitive signals, while experienced traders can leverage in-depth analysis for more complex strategies.
PrimeMomentum Usage Modes
PrimeMomentum adapts to various strategies and supports three modes:
Short-term: Recommended to use a 2H timeframe. Optimal for intraday trading with small TakeProfit levels.
Medium-term: Recommended to use a 1D timeframe for trades lasting several days.
Long-term: Use the 1W timeframe for analyzing global trends.
Support for Different Strategies
Thanks to its flexible settings and support for multiple timeframes, PrimeMomentum is suitable for both day trading and long-term analysis.
Why Is PrimeMomentum Worth Your Attention?
Unlike standard indicators, which often rely solely on basic mathematical models or publicly available components, PrimeMomentum offers a comprehensive approach to market analysis. It combines unique momentum assessment algorithms, multi-timeframe analysis, and volatility adaptation. This not only provides traders with signals but also helps them understand the underlying market processes, making it a truly innovative solution.
Disclaimer
The PrimeMomentum indicator is designed to assist traders in market analysis but does not guarantee future profitability. Its use should be combined with traders' own research and informed decision-making.
FRAMA Channel [BigBeluga]This is a trend-following indicator that utilizes the Fractal Adaptive Moving Average (FRAMA) to create a dynamic channel around the price. The FRAMA Channel helps identify uptrends, downtrends, and ranging markets by examining the relationship between the price and the channel's boundaries. It also marks trend changes with arrows, optionally displaying either price values or average volume at these key points.
🔵 IDEA
The core idea behind the FRAMA Channel indicator is to use the fractal nature of markets to adapt to different market conditions. By creating a channel around the FRAMA line, it not only tracks price trends but also adapts its sensitivity based on market volatility. When the price crosses the upper or lower bands of the channel, it signals a potential shift in trend direction. If the price remains within the channel and crosses over the upper or lower bands without a breakout, the market is likely in a ranging phase with low momentum. This adaptive approach makes the FRAMA Channel effective in both trending and ranging market environments.
🔵 KEY FEATURES & USAGE
◉ Dynamic FRAMA Channel with Trend Signals:
The FRAMA Channel uses a fractal-based moving average to create an adaptive channel around the price. When the price crosses above the upper band, it signals an uptrend and plots an upward arrow with the price (or average volume) value. Conversely, when the price crosses below the lower band, it signals a downtrend and marks the point with a downward arrow. This dynamic adaptation to market conditions helps traders identify key trend shifts effectively.
◉ Ranging Market Detection:
If the price remains within the channel, and only the high crosses the upper band or the low crosses the lower band, the indicator identifies a ranging market with low momentum. In this case, the channel turns gray, signaling a neutral trend. This is particularly useful for avoiding false signals during periods of market consolidation.
◉ Color-Coded Candles and Channel Bands:
Candles and channel bands are color-coded to reflect the current trend direction. Green indicates an upward trend, blue shows a downward trend, and gray signals a neutral or ranging market. This visual representation makes it easy to identify the market condition at a glance, helping traders make informed decisions quickly.
◉ Customizable Display of Price or Average Volume:
On trend change signals, the indicator allows users to choose whether to display the price at the point of trend change or the average volume of 10 bars. This flexibility enables traders to focus on the information that is most relevant to their strategy, whether it's the exact price entery or the volume context of the market shift. Displaying the average volume allows to see the strength of the trend change.
Price Data:
Average Volume of points:
🔵 CUSTOMIZATION
Length & Bands Distance: Adjust the length for the FRAMA calculation to control the sensitivity of the channel. A shorter length makes the channel more reactive to price changes, while a longer length smooths it out. The Bands Distance setting determines how far the bands are from the FRAMA line, helping to define the breakout and ranging conditions.
Signals Data: Choose between displaying the price or the average volume on trend change arrows. This allows traders to focus on either the exact price level of trend change or the market volume context.
Color Settings: Customize the colors for upward momentum, downward momentum, and neutral states to suit your charting preferences. You can also toggle whether to color the candles based on the momentum for a clearer visual of the trend direction.
The FRAMA Channel indicator adapts to market conditions, providing a versatile tool for identifying trends and ranging markets with clear visual cues.

Candle Spread
Candle Spread is an indicator that helps traders measure the range of price movement within each candle over a specified time period. It calculates the range of the candle between the High and Low (High - Low) and displays it in a separate window below the chart as columns.
Key Features:
Colored Bars: The bars are colored based on the candle's direction:
Bullish Candle: Bars are Green.
Bearish Candle: Bars are Red.
Moving Average: The indicator includes a 30-period Simple Moving Average (SMA), which represents the overall average range of the candles.
Helps Identify Market Volatility: This indicator helps traders identify wide-range candles (signaling high volatility in the market), which could indicate a surge in momentum or potential trend reversals.

TechniTrendMasterIntroducing "TechniTrendMaster"
The TechniTrendMaster indicator is designed to bring clarity and depth to your trading strategy. This indicator combines robust trend analysis with volume insights, giving you a comprehensive view of the market’s pulse. Let's break down the features.
🔵 Analysis Mode
TechniTrendMaster's Analysis Mode provides various configurations tailored to specific market behaviors. Here are the options you can utilize:
🔹Strong Movements: Focuses on powerful market shifts, ideal for capturing major trend changes and high-momentum moves. Perfect for identifying strong breakout opportunities.
🔹Reversal: Detects potential turning points in the market, signaling when a trend might be about to change direction, allowing for well-timed entries and exits.
🔹Consolidations: Spots periods of low volatility where the market moves sideways, helping you avoid trading traps and anticipate breakout scenarios.
🔹Momentum-Driven: Prioritizes momentum in the market, identifying when the force behind price movement is accelerating or decelerating.
🔹Balanced: Offers a well-rounded view of the market by weighing both trend direction and volume equally, making it suitable for stable market conditions.
🔹Volatility Adapted: Adjusts to periods of increased or decreased volatility, providing accurate signals regardless of market conditions.
🔹Trend Confirmation: Confirms the strength and sustainability of a trend, allowing traders to enter trades with higher confidence.
🔹Short-Term Scalping: Tailored for traders who focus on Short-Term and Scalp trades, offering rapid insights for intraday or short-term trading strategies.
🔵 Trend Analysis Mode
The Trend Analysis Mode allows you to customize how trends are detected and analyzed:
🔹Default: A balanced mode for general use, offering reliable trend identification across different market conditions.
🔹Aggressive: A more sensitive setting that reacts quickly to market changes, ideal for traders looking to capitalize on smaller, quicker movements.
🔹Conservative: Takes a cautious approach, favoring long-term stability over short-term fluctuations, perfect for risk-averse traders.
🔹Volatility Aware: Focuses on adapting to volatility shifts, giving accurate trend signals even in erratic markets.
🔹Range Bound: Targets horizontal price movements and channel trades, helping traders take advantage of well-defined ranges.
🔵 Divergence
Divergence is a powerful tool within TechniTrendMaster, highlighting discrepancies between price movement and underlying volume. These differences can indicate potential reversals or trend continuations before they are visible on price charts alone.
🔵 Hidden Divergence
Hidden divergence is a subtle yet crucial signal that reveals when an existing trend might resume after a temporary correction. This mode provides early detection of trend continuity opportunities, giving traders a significant advantage in timing.
🔵 Divergence Mode
TechniTrendMaster includes different divergence detection settings to suit your analysis style:
🔹Standard: Captures typical divergence patterns for general analysis.
🔹Short-Term Focused: Concentrates on short-lived divergences, offering rapid detection of shifts for active traders.
🔹Long-Term Analysis: Highlights divergence in a broader context, which is better for understanding the overall market direction.
🔹High Sensitivity: Prioritizes capturing even the smallest shifts in the market, making it excellent for high-frequency trading or volatile environments.
🔹Low Sensitivity: Reduces market noise, only reacting to more significant changes in trend or volume. It’s perfect for traders who seek higher accuracy with fewer false signals.
🔵 Dynamic Channel
TechniTrendMaster features a Dynamic Channel, that automatically adapts to market conditions. This channel provides a visual guide to price action, adjusting in real-time based on current trends and volatility. It identifies key support and resistance zones, making it easier to spot breakouts, trend continuations, or potential reversals.
🔵 Volume Integration
Volume is a critical part of TechniTrendMaster, offering deeper insights beyond just price movement. By analyzing volume patterns alongside trends, the indicator highlights the strength and reliability of market shifts. This integration ensures that traders can distinguish between genuine movements backed by solid volume and weak trends that might not hold.
🔵 A Solution for All Trading Styles
TechniTrendMaster’s strength lies in its versatility. No matter your trading approach—be it scalping, swing trading, trend following, or range trading—this indicator adapts to your needs. Here's how it caters to different trader profiles:
🔹Scalpers get precise, quick-response insights through the Short-Term Scalping and High Sensitivity settings, helping them capture minute price movements.
🔹Swing Traders benefit from modes like Reversal, Balanced, and Momentum-Driven, which focus on identifying trends and shifts that occur over several days.
🔹Long-Term Investors will find the Conservative, Low Sensitivity, and Long-Term Analysis modes ideal for filtering noise and sticking to broader market trends.
🔹Volatility Traders can rely on the Volatility Adapted and Volatility Aware options to get accurate signals even during unpredictable periods.
🔓 Unlock Access :
Check out the Author's Instructions or Dm me to Unlock the Access.

Bullrun Profit Maximizer [QuantraSystems]Bullrun Profit Maximizer
Quantra Systems guarantees that the information created and published within this document and on the Tradingview platform is fully compliant with applicable regulations, does not constitute investment advice, and is not exclusively intended for qualified investors.
Important Note!
The system equity curve presented here has been generated as part of the process of testing and verifying the methodology behind this script.
Crucially, it was developed after the system was conceptualized, designed, and created, which helps to mitigate the risk of overfitting to historical data. In other words, the system was built for robustness, not for simply optimizing past performance.
This ensures that the system is less likely to degrade in performance over time, compared to hyper optimized systems that are tailored to past data. No tweaks or optimizations were made to this system post backtest.
Even More Important Note!!
The nature of markets is that they change quickly and unpredictably. Past performance does not guarantee future results - this is a fundamental rule in trading and investing.
While this system is designed with broad, flexible conditions to adapt quickly to a range of market environments, it is essential to understand that no assumptions should be made about future returns based on historical data. Markets are inherently uncertain, and this system - like all trading systems - cannot predict future outcomes.
Introduction
The "Adaptive Pairwise Momentum System" is not a prototype to the Bullrun Profit Maximizer (BPM) . The Bullrun Profit Maximizer is a fully re-engineered, higher frequency momentum system.
The Bullrun Profit Maximizer (BPM) uses a completely different filter logic and refines momentum calculations, specifically to support higher frequency trading on Crypto's Blue Chip assets. It correctly calculates fees and slippage by compounding them against System Profit before plotting the equity curve.
Unlike prior systems, this script utilizes a completely new filter logic and refined momentum calculation, specifically built to support higher frequency trading on blue-chip assets, while minimizing the impact of fees and slippage.
While the APMS focuses on Macro Trend Alignment, the BPM instead applies an equity curve based filter, allowing for targeted precision on the current asset’s trend without relying on broader market conditions. This approach delivers more responsive and asset specific signals, enhancing agility in today’s fast paced crypto markets.
The BPM dynamically optimizes capital allocation across up to four high performing assets, ensuring that the portfolio adapts swiftly to changing market conditions. The system logic consists of sophisticated quantitative methods, rapid momentum analysis and alpha cyclicality/seasonality optimizations. The overarching goal is to ensure that the portfolio is always invested in the highest performing asset based on dynamic market conditions, while at the same time managing risk through rapid asset filters and internal mechanisms like alpha cyclicality, volatility and beta analysis.
In addition to these core functionalities, the BPM comes with the typical Quantra Systems UI design, structured to reduce data clutter and provide users with only the most essential, impactful information. The BPM UI format delivers clear and easy to read signals. It enables rapid decision making in a high frequency environment without compromising on depth or accuracy.
Bespoke Logic Filtering with Equity Curve Precision
The BPM script utilizes a completely new methodology and focuses on intraday rotations of blue-chip crypto assets, while previously built systems were designed with a longer term focus in mind.
In response to the need for more precise signal generation, the BPM replaces the previous macro trend filter with a new, highly specific equity curve activation filter. This unique logic filter is driven solely by the performance trends of the asset currently held by the system. By analyzing the equity curve directly, this system can make more targeted, timely allocations based on asset specific momentum, allowing for quick adjustments that are more relevant to the held asset rather than general market conditions.
The benefits of this new, unique approach are twofold: first, it avoids premature allocation shifts based on broader macro movements, and second, it enables the system to adapt dynamically to the performance of each asset individually. This asset specific filtering allows traders to capitalize on localized strength within individual blue-chip cryptoassets without being affected by lags in the overall market trend.
High Frequency Momentum Calculation for Enhanced Flexibility
The BPM incorporates a newly designed momentum calculation that increases its suitability across lower timeframes. This new momentum indicator captures and processes more data points within a shorter window than ever before, rather than extending bar intervals and potentially losing high frequency detail. This creates a smooth, data rich featureset that is especially suited for blue-chip assets, where liquidity reduces slippage and fees, making higher frequency trading viable.
By retaining more data, this system captures subtle shifts in momentum more effectively than traditional approaches, offering higher resolution insights. These modifications result in a system capable of generating highly responsive signals on faster timeframes, empowering traders to act quickly in volatile markets.
User Interface and Enhanced Readability
The BPM also features a reimagined, streamlined user interface, making it easier than ever to monitor essential signals at a glance. The new layout minimizes extraneous data points in the tables, leaving only the most actionable information for traders. This cleaner presentation is purpose built to help traders identify the strongest asset in real time, with clear, color coded signals to facilitate swift decision making in fast moving markets.
Equity Stats Table : Designed for clarity, the stats table focuses on the current allocation’s performance metrics, emphasizing the most critical metrics without unnecessary clutter.
Color Coded Highlights : The interface includes the option to highlight both the current top performing asset, and historical allocations - with indicators of momentum shifts and performance metrics readily accessible.
Clear Signals : Visual cues are presented in an enhanced way to improve readability, including simplified line coloring, and improve visualization of the outperforming assets in the allocation table.
Dynamic Asset Reallocation
The BPM dynamically allocates capital to the strongest performing asset in a selected pool. This system incorporates a re-engineered, pairwise momentum measurement designed to operate at higher frequencies. The system evaluates each asset against others in real time, ensuring only the highest momentum asset receives allocation. This approach keeps the portfolio positioned for maximum efficiency, with an updated weighting logic that favors assets showing both strength and sustainability.
Position Changes and Slippage Calculation
Position changes are optimized for faster reallocation, with realistic slippage and fee calculations factored into each trade. The system’s structure minimizes the impact of these costs on blue-chip assets, allowing for more active management on short timeframes without incurring significant drag on performance.
A Special Note on Fees + Slippage
In the image above, the system has been applied to four different timeframes - 12h, 8h, 4h and 1h - using identical settings and a selected slippage and fees amount of 0.2%. In this stress test, we isolate the choppy downwards period from the previous Bitcoin all time high - set in March 2024, to the current date where Bitcoin is currently sitting at around the same level.
This illustrates an important concept: starting at the 12h, the system performed better as the timeframes decreased. In fact, only on the 4hr chart did the system equity curve make a new all time high alongside Bitcoin. It is worth noting that market phases that are “non-trending” are generally the least profitable periods to use a momentum/trend system - as most systems will get caught by false momentum and will “buy the top,” and then proceed to “sell the bottom.”
Lower timeframes typically offer more data points for the algorithm to compute over, and enable quicker entries and exits within a robust system, often reducing downside risk and compounding gains more effectively - in all market environments.
However, slippage, fees, and execution constraints are still limiting factors. Although blue-chip cryptocurrencies are more liquid and can be traded with lower fees compared to low cap assets, frequent trading on lower timeframes incurs cumulative slippage costs. With the BPM system set to a realistic slippage rate of 0.2% per trade, this example emphasizes how even lower fees impact performance as trade frequency increases.
Finding the optimal balance between timeframe and slippage impact requires careful consideration of factors such as portfolio size, liquidity of selected tokens, execution speed, and the fee rate of the exchange you execute trades on.
Number of Position Changes
Understanding the number of position changes in a strategy is critical to assessing its feasibility in real world trading. Frequent position changes can lead to increased costs due to slippage and fees. Monitoring the number of position changes provides insight into the system’s behavior - helping to evaluate how active the strategy is and whether it aligns with the trader's desired time input for position management.
Equity Curve and Performance Calculations
To provide a benchmark, the script also generates a Buy-and-Hold (or "HODL") equity curve that represents a 100% allocation to Bitcoin, the highest market cap cryptoasset. This allows users to easily compare the performance of the dynamic rotation system with that of a more traditional investment strategy.
The script tracks key performance metrics for both the dynamic portfolio and the HODL strategy, including:
Sharpe Ratio
The Sharpe Ratio is a key metric that evaluates a portfolio’s risk adjusted return by comparing its ‘excess’ return to its volatility. Traditionally, the Sharpe Ratio measures returns relative to a risk-free rate. However, in our system’s calculation, we omit the risk-free rate and instead measure returns above a benchmark of 0%. This adjustment provides a more universal comparison, especially in the context of highly volatile assets like cryptocurrencies, where a traditional risk-free benchmark, such as the usual 3-month T-bills, is often irrelevant or too distant from the realities of the crypto market.
By using 0% as the baseline, we focus purely on the strategy's ability to generate raw returns in the face of market risk, which makes it easier to compare performance across different strategies or asset classes. In an environment like cryptocurrency, where volatility can be extreme, the importance of relative return against a highly volatile backdrop outweighs comparisons to a risk-free rate that bears little resemblance to the risk profile of digital assets.
Sortino Ratio
The Sortino Ratio improves upon the Sharpe Ratio by specifically targeting downside risk and leaves the upside potential untouched. In contrast to the Sharpe Ratio (which penalizes both upside and downside volatility), the Sortino Ratio focuses only on negative return deviations. This makes it a more suitable metric for evaluating strategies like the Bullrun Profit Maximizer - that aim to minimize drawdowns without restricting upside capture. By measuring returns relative to a 0% baseline, the Sortino ratio provides a clearer assessment of how well the system generates gains while avoiding substantial losses in highly volatile markets like crypto.
Omega Ratio
The Omega Ratio is calculated as the ratio of gains to losses across all return thresholds, providing a more complete view of how the system balances upside and downside risk even compared to the Sortino Ratio. While it achieves a similar outcome to the Sortino Ratio by emphasizing the system's ability to capture gains while limiting losses, it is technically a mathematically superior method. However, we include both the Omega and Sortino ratios in our metric table, as the Sortino Ratio remains more widely recognized and commonly understood by traders and investors of all levels.
Usage Summary:
While the backtests in this description are generated as if a trader held a portfolio of just the strongest tokens, this was mainly designed as a method of logical verification and not a recommended investment strategy. In practice, this system can be used in multiple ways.
It can be used as above, or as a factor in forming part of a broader asset selection tool, or even a method of filtering tokens by strength in order to inform a day trader which tokens might be optimal to look at, for long-only trading setups on an intrabar timeframe.
Summary
The Bullrun Profit Maximizer is an advanced tool tailored for traders, offering the precision and agility required in today’s markets. With its asset specific equity curve filter, reworked momentum analysis, and streamlined user interface, this system is engineered to maximize gains and minimize risk during bullmarkets, with a strong focus on risk adjusted performance.
Its refined approach, focused on high resolution data processing and adaptive reallocation, makes it a powerful choice for traders looking to capture high quality trends on clue-chip assets, no matter the market’s pace.

Madhan_HMT_Ultimate_StrategyThis indicator is a trend-following strategy designed to identify buy and sell signals based on price action relative to dynamic channels and smoothing mechanisms. It uses two separate sets of parameters that adjust to market conditions, with each set of parameters acting as an independent trend filter. The indicator creates arrows on the chart to signal potential trade entries, with these arrows appearing when the price crosses certain thresholds established by the indicator's internal calculation.
The strategy can be customized with various parameters, including:
Stop loss and take profit levels based on multiple options: ATR (Average True Range), fixed points, or percentage-based values.
Trading mode options that allow the user to choose whether the strategy trades both long and short positions, or restricts trades to only one direction (long or short).
The indicator visually represents the entry levels, stop loss, and take profit levels, with backgrounds filling to highlight potential risk and reward areas. By adjusting the parameters, traders can tailor the indicator to suit different market conditions and their risk tolerance.

Salman Indicator: Multi-Purpose Price ActionSalman Indicator: Multi-Purpose Price Action Tool for Pin Bars, Breakouts, and VWAP Anchoring
This indicator provides a comprehensive suite of price action insights, designed for active traders looking to identify key market structures and potential reversals. The script incorporates a Quarterly VWAP for trend bias, marks pin bars for possible reversal points, highlights outside bars for volatility signals, and indicates simple breakouts and pivot-level breaks. Customizable settings allow for flexibility in various trading styles, with default settings optimized for daily charts.
Outside Bars : Represented by an ⤬ symbol on the chart, these indicate bars where the current high is greater than the previous bar’s high, and the low is lower than the previous bar’s low, signaling high volatility and potential market reversals.
Pin Bars : Denoted by a small dot at the top or bottom of a candle’s wick, these are crucial signals of potential reversal areas. Pin bars are identified based on the percentage length of their shadows, with adjustable strictness in settings.
Quarterly VWAP : The light blue line on the chart represents the VWAP (Volume-Weighted Average Price), which is anchored to the Quarterly period by default. The VWAP acts as a directional bias filter, helping you to determine underlying market trends. This period, source, and offset are fully adjustable in the script’s settings.
Simple Breaks : Hollow candles on the chart indicate "simple breaks," defined when the current bar closes above the previous high or below the previous low. This is an effective way to highlight directional momentum in the market.
Bonus Pivot Breaks : The tilde symbol ~ appears when the price closes above or below prior pivot high/low levels, helping traders spot significant breakout or breakdown points relative to recent pivots.
Alerts
Simple Breaks : Alerts you when a breakout occurs beyond the previous bar’s high or low. Pin Bars : Notifies you of potential reversal points as indicated by bullish or bearish pin bars. Outside Bars : Triggers an alert whenever an outside bar is detected, indicating possible volatility changes.
How to Use
VWAP for Trend Bias : Use the Quarterly VWAP line to gauge overall market trend, with settings that allow adjustment to daily, weekly, monthly, or even larger time frames.
Pin Bars for Reversal Potential : Look for the dot markers on candle wicks, where the strictness of the pin bar detection can be adjusted via settings to match your trading preference.
Simple and Pivot Breaks for Momentum : Watch for hollow candles and the tilde symbol ~ as indicators of potential breakout momentum and pivot break levels, respectively.
This script can serve traders on multiple timeframes, from daily to weekly and beyond. The flexible configuration allows for adjustments in VWAP anchoring and pin bar criteria, providing a tailored fit for individual trading strategies.

SuperATR 7-Step Profit - Strategy [presentTrading] Long time no see!
█ Introduction and How It Is Different
The SuperATR 7-Step Profit Strategy is a multi-layered trading approach that integrates adaptive Average True Range (ATR) calculations with momentum-based trend detection. What sets this strategy apart is its sophisticated 7-step take-profit mechanism, which combines four ATR-based exit levels and three fixed percentage levels. This hybrid approach allows traders to dynamically adjust to market volatility while systematically capturing profits in both long and short market positions.
Traditional trading strategies often rely on static indicators or single-layered exit strategies, which may not adapt well to changing market conditions. The SuperATR 7-Step Profit Strategy addresses this limitation by:
- Using Adaptive ATR: Enhances the standard ATR by making it responsive to current market momentum.
- Incorporating Momentum-Based Trend Detection: Identifies stronger trends with higher probability of continuation.
- Employing a Multi-Step Take-Profit System: Allows for gradual profit-taking at predetermined levels, optimizing returns while minimizing risk.
BTCUSD 6hr Performance
█ Strategy, How It Works: Detailed Explanation
The strategy revolves around detecting strong market trends and capitalizing on them using an adaptive ATR and momentum indicators. Below is a detailed breakdown of each component of the strategy.
🔶 1. True Range Calculation with Enhanced Volatility Detection
The True Range (TR) measures market volatility by considering the most significant price movements. The enhanced TR is calculated as:
TR = Max
Where:
High and Low are the current bar's high and low prices.
Previous Close is the closing price of the previous bar.
Abs denotes the absolute value.
Max selects the maximum value among the three calculations.
🔶 2. Momentum Factor Calculation
To make the ATR adaptive, the strategy incorporates a Momentum Factor (MF), which adjusts the ATR based on recent price movements.
Momentum = Close - Close
Stdev_Close = Standard Deviation of Close over n periods
Normalized_Momentum = Momentum / Stdev_Close (if Stdev_Close ≠ 0)
Momentum_Factor = Abs(Normalized_Momentum)
Where:
Close is the current closing price.
n is the momentum_period, a user-defined input (default is 7).
Standard Deviation measures the dispersion of closing prices over n periods.
Abs ensures the momentum factor is always positive.
🔶 3. Adaptive ATR Calculation
The Adaptive ATR (AATR) adjusts the traditional ATR based on the Momentum Factor, making it more responsive during volatile periods and smoother during consolidation.
Short_ATR = SMA(True Range, short_period)
Long_ATR = SMA(True Range, long_period)
Adaptive_ATR = /
Where:
SMA is the Simple Moving Average.
short_period and long_period are user-defined inputs (defaults are 3 and 7, respectively).
🔶 4. Trend Strength Calculation
The strategy quantifies the strength of the trend to filter out weak signals.
Price_Change = Close - Close
ATR_Multiple = Price_Change / Adaptive_ATR (if Adaptive_ATR ≠ 0)
Trend_Strength = SMA(ATR_Multiple, n)
🔶 5. Trend Signal Determination
If (Short_MA > Long_MA) AND (Trend_Strength > Trend_Strength_Threshold):
Trend_Signal = 1 (Strong Uptrend)
Elif (Short_MA < Long_MA) AND (Trend_Strength < -Trend_Strength_Threshold):
Trend_Signal = -1 (Strong Downtrend)
Else:
Trend_Signal = 0 (No Clear Trend)
🔶 6. Trend Confirmation with Price Action
Adaptive_ATR_SMA = SMA(Adaptive_ATR, atr_sma_period)
If (Trend_Signal == 1) AND (Close > Short_MA) AND (Adaptive_ATR > Adaptive_ATR_SMA):
Trend_Confirmed = True
Elif (Trend_Signal == -1) AND (Close < Short_MA) AND (Adaptive_ATR > Adaptive_ATR_SMA):
Trend_Confirmed = True
Else:
Trend_Confirmed = False
Local Performance
🔶 7. Multi-Step Take-Profit Mechanism
The strategy employs a 7-step take-profit system
█ Trade Direction
The SuperATR 7-Step Profit Strategy is designed to work in both long and short market conditions. By identifying strong uptrends and downtrends, it allows traders to capitalize on price movements in either direction.
Long Trades: Initiated when the market shows strong upward momentum and the trend is confirmed.
Short Trades: Initiated when the market exhibits strong downward momentum and the trend is confirmed.
█ Usage
To implement the SuperATR 7-Step Profit Strategy:
1. Configure the Strategy Parameters:
- Adjust the short_period, long_period, and momentum_period to match the desired sensitivity.
- Set the trend_strength_threshold to control how strong a trend must be before acting.
2. Set Up the Multi-Step Take-Profit Levels:
- Define ATR multipliers and fixed percentage levels according to risk tolerance and profit goals.
- Specify the percentage of the position to close at each level.
3. Apply the Strategy to a Chart:
- Use the strategy on instruments and timeframes where it has been tested and optimized.
- Monitor the positions and adjust parameters as needed based on performance.
4. Backtest and Optimize:
- Utilize TradingView's backtesting features to evaluate historical performance.
- Adjust the default settings to optimize for different market conditions.
█ Default Settings
Understanding default settings is crucial for optimal performance.
Short Period (3): Affects the responsiveness of the short-term MA.
Effect: Lower values increase sensitivity but may produce more false signals.
Long Period (7): Determines the trend baseline.
Effect: Higher values reduce noise but may delay signals.
Momentum Period (7): Influences adaptive ATR and trend strength.
Effect: Shorter periods react quicker to price changes.
Trend Strength Threshold (0.5): Filters out weaker trends.
Effect: Higher thresholds yield fewer but stronger signals.
ATR Multipliers: Set distances for ATR-based exits.
Effect: Larger multipliers aim for bigger moves but may reduce hit rate.
Fixed TP Levels (%): Control profit-taking on smaller moves.
Effect: Adjusting these levels affects how quickly profits are realized.
Exit Percentages: Determine how much of the position is closed at each TP level.
Effect: Higher percentages reduce exposure faster, affecting risk and reward.
Adjusting these variables allows you to tailor the strategy to different market conditions and personal risk preferences.
By integrating adaptive indicators and a multi-tiered exit strategy, the SuperATR 7-Step Profit Strategy offers a versatile tool for traders seeking to navigate varying market conditions effectively. Understanding and adjusting the key parameters enables traders to harness the full potential of this strategy.

70% rule strength/trend/reversalThis indicator tells you which candle closed strong for the day by identifying if the price closed above 70% of the candle's total height. this can help you identify reversals/new trends/ renewed strength in the current trend.
The indicator colors such candle green and if the candle closes with increase in price by 5% or higher then marks an asterisk under the candle.
HOPE THIS HELPS

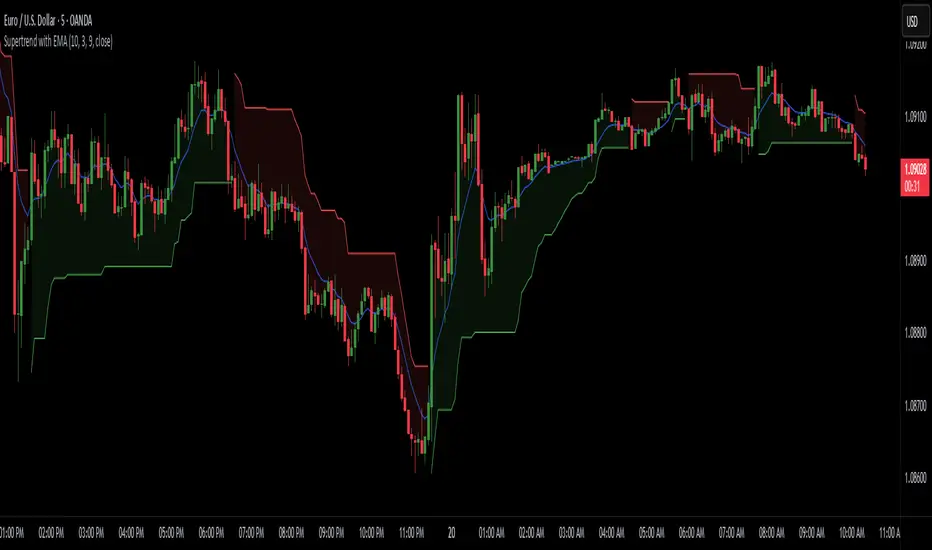
Supertrend with EMASupertrend + EMA Indicator
This custom indicator combines the popular Supertrend and Exponential Moving Average (EMA) indicators to enhance trend analysis and signal accuracy. The Supertrend tracks price volatility to identify potential trend directions, while the EMA provides a smooth moving average to help refine entries and exits based on trend momentum.
Features:
Supertrend: Detects trend reversals by using price action and volatility, making it effective in trending markets.
Exponential Moving Average (EMA): Smoothens price fluctuations, helping you gauge the trend’s strength and filter out false signals.
Versatile for multiple timeframes and asset classes.
Ideal for traders looking to catch sustained trends and avoid false breakouts, this indicator offers an improved way to follow market momentum and confirm trend strength. Customize the Supertrend ATR multiplier and EMA length to suit your trading style and timeframe.
Range Tightening Indicator (RTI)The Range Tightening Indicator (RTI) quantifies price volatility relative to recent price action, helping traders identify low-volatility consolidations that often precede breakouts.
Range Tightening is calculated by measuring the range between each bar’s high and low prices over a chosen lookback period.
A 5-bar period is recommended for shorter-term momentum setups and a 15-bar period is recommended for swing trading. An option for a custom period is available to suit specific strategies. The default look back for custom is 50, ideal for longer term traders.
Other Key Features:
Dynamic Color Coding: The RTI line turns green when volatility doubles after a drop to or below 20, flagging significant volatility shifts commonly seen before breakouts.
Low-Volatility Dots: Orange dots appear on the RTI line when two or more consecutive bars show RTI values below 20, visually marking extended low-volatility periods.
Volatility Zones: Shaded zones provide quick context:
Zone 1 (0-5): Extremely tight volatility, shown in red.
Zone 2 (5-10): Low volatility, shown in light green.
Zone 3 (10-15): Moderate low volatility, shown in green.
The RTI indicator is ideal for traders looking to anticipate breakout conditions, with features that highlight consolidation phases, support momentum strategies, and help improve entry timing by focusing on shifts in volatility.
This indicator was inspired after Deepvue's RMV Indicator, but uses a different calculation. Results may vary.

Gabriel's Witcher Strategy [65 Minute Trading Bot]Strategy Description: Gabriel's Witcher Strategy
Author: Gabriel
Platform: TradingView Pine Script (Version 5)
Backtested Asset: Avalanche (Coinbase Brokage for Volume adjustment)
Timeframe: 65 Minutes
Strategy Type: Comprehensive Trend-Following and Momentum Strategy with Scalping and Risk Management Features
Overview
Gabriel's Witcher Strategy is an advanced trading bot designed for the Avalanche pair on a 65-minute timeframe. This strategy integrates a multitude of technical indicators to identify and execute high-probability trading opportunities. By combining trend-following, momentum, volume analysis, and range filtering, the strategy aims to capitalize on both long and short market movements. Additionally, it incorporates scalping mechanisms and robust risk management features, including take-profit (TP) levels and commission considerations, to optimize trade performance and profitability.
====Key Components====
Source Selection:
Custom Source Flexibility: Allows traders to select from a wide range of price and volume sources (e.g., Close, Open, High, Low, HL2, HLC3, OHLC4, VWAP, On-Balance Volume, etc.) for indicator calculations, enhancing adaptability to various trading styles.
Various curves of Volume Analysis are employed:
Tick Volume Calculation: Utilizes tick volume as a fallback when actual volume data is unavailable, ensuring consistency across different data feeds.
Volume Indicators: Incorporates multiple volume-based indicators such as On-Balance Volume (OBV), Accumulation/Distribution (AccDist), Negative Volume Index (NVI), Positive Volume Index (PVI), and Price Volume Trend (PVT) for comprehensive market analysis.
Trend Indicators:
ADX (Average Directional Index): Measures trend strength using either the Classic or Masanakamura method, with customizable length and threshold settings. It's used to open positions when the mesured trend is strong, or exit when its weak.
Jurik Moving Average (JMA): A smooth moving average that reduces lag, configurable with various parameters including source, resolution, and repainting options.
Parabolic SAR: Identifies potential reversals in market trends with adjustable start, increment, and maximum settings.
Custom Trend Indicator: Utilizes highest and lowest price points over a specified timeframe to determine current and previous trend bases, visually represented with color-filled areas.
Momentum Indicators:
Relative Strength Index (RSI): Evaluates the speed and change of price movements, smoothed with a custom length and source. It's used to not enter the market for shorts in oversold or longs for overbought conditions, and to enter for long in oversold or shorts for overboughts.
Momentum-Based Calculations: Employs both Double Exponential Moving Averages (DEMA) on a MACD-based RSI to enhance momentum signal accuracy which is then further accelerated by a Hull MA. This is the technical analysis tool that determines bearish or bullish momentum.
OBV-Based Momentum Conditions: Uses two exponential moving averages of OBV to determine bullish or bearish momentum shifts, anomalities, breakouts where banks flow their funds in or Smart Money Concepts trade.
Moving Averages (MA):
Multiple MA Types: Includes Simple Moving Average (SMA), Exponential Moving Average (EMA), Weighted Moving Average (WMA), Hull Moving Average (HMA), and Volume-Weighted Moving Average (VWMA), selectable via input parameters.
MA Speed Calculation: Measures the percentage change in MA values to determine the direction and speed of the trend.
Range Filtering:
Variance-Based Filter: Utilizes variance and moving averages to filter out trades during low-volatility periods, enhancing trade quality.
Color-Coded Range Indicators: Visualizes range filtering with color changes on the chart for quick assessment.
Scalping Mechanism:
Heikin-Ashi Candles: Optionally uses Heikin-Ashi candles for smoother price action analysis.
EMA-Based Trend Detection: Employs fast, medium, and slow EMAs to determine trend direction and potential entry points.
Fractal-Based Filtering: Detects regular or BW (Black & White) fractals to confirm trade signals.
Take Profit (TP) Management:
Dynamic TP Levels: Calculates TP levels based on the number of consecutive long or short entries, adjusting targets to maximize profits.
TP Signals and Re-Entry: Plots TP signals on the chart and allows for automatic re-entry upon TP hit, maintaining continuous trade flow.
Risk Management:
Commission Integration: Accounts for trading commissions to ensure net profitability.
Position Sizing: Configured to use a percentage of equity for each trade, adjustable via input parameters.
Pyramiding: Allows up to one additional position per direction to enhance gains during strong trends.
Alerts and Visual Indicators:
Buy/Sell Signals: Plots visual indicators (triangles and flags) on the chart to signify entry and TP points.
Bar Coloring: Changes bar colors based on ADX and trend conditions for immediate visual cues.
Price Levels: Marks significant price levels related to TP and position entries with cross styles.
Input Parameters
Source Settings:
Custom Sources (srcinput): Choose from various price and volume sources to tailor indicator calculations.
ADX Settings:
ADX Type (ADX_options): Select between 'CLASSIC' and 'MASANAKAMURA' methods.
ADX Length (ADX_len): Defines the period for ADX calculation.
ADX Threshold (th): Sets the minimum ADX value to consider a strong trend.
RSI Settings:
RSI Length (len_3): Period for RSI calculation.
RSI Source (src_3): Source data for RSI.
Trend Strength Settings:
Channel Length (n1): Period for trend channel calculation.
Average Length (n2): Period for smoothing trend strength.
Jurik Moving Average (JMA) Settings:
JMA Source (inp): Source data for JMA.
JMA Resolution (reso): Timeframe for JMA calculation.
JMA Repainting (rep): Option to allow JMA to repaint.
JMA Length (lengths): Period for JMA.
Parabolic SAR Settings:
SAR Start (start): Initial acceleration factor.
SAR Increment (increment): Acceleration factor increment.
SAR Maximum (maximum): Maximum acceleration factor.
SAR Point Width (width): Visual width of SAR points.
Trend Indicator Settings:
Trend Timeframe (timeframe): Period for trend indicator calculations.
Momentum Settings:
Source Type (srcType): Select between 'Price' and 'VWAP'.
Momentum Source (srcPrice): Source data for momentum calculations.
RSI Length (rsiLen): Period for momentum RSI.
Smooth Length (sLen): Smoothing period for momentum RSI.
OBV Settings:
OBV Line 1 (e1): EMA period for OBV line 1.
OBV Line 2 (e2): EMA period for OBV line 2.
Moving Average (MA) Settings:
MA Length (length): Period for MA calculations.
MA Type (matype): Select MA type (1: SMA, 2: EMA, 3: HMA, 4: WMA, 5: VWMA).
Range Filter Settings:
Range Filter Length (length0): Period for range filtering.
Range Filter Multiplier (mult): Multiplier for range variance.
Take Profit (TP) Settings:
TP Long (tp_long0): Percentage for long TP.
TP Short (tp_short0): Percentage for short TP.
Scalping Settings:
Scalping Activation (ACT_SCLP): Enable or disable scalping.
Scalping Length (HiLoLen): Period for scalping indicators.
Fast EMA Length (fastEMAlength): Period for fast EMA in scalping.
Medium EMA Length (mediumEMAlength): Period for medium EMA in scalping.
Slow EMA Length (slowEMAlength): Period for slow EMA in scalping.
Filter (filterBW): Enable or disable additional fractal filtering.
Pullback Lookback (Lookback): Number of bars for pullback consideration.
Use Heikin-Ashi Candles (UseHAcandles): Option to use Heikin-Ashi candles for smoother trend analysis.
Strategy Logic
Indicator Calculations:
Volume and Source Selection: Determines the primary data source based on user input, ensuring flexibility and adaptability.
ADX Calculation: Computes ADX using either the Classic or Masanakamura method to assess trend strength.
RSI Calculation: Evaluates market momentum using RSI, further smoothed with custom periods.
Trend Strength Assessment: Utilizes trend channel and average lengths to gauge the robustness of current trends.
Jurik Moving Average (JMA): Smooths price data to reduce lag and enhance trend detection.
Parabolic SAR: Identifies potential trend reversals with adjustable parameters for sensitivity.
Momentum Analysis: Combines RSI with DEMA and OBV-based conditions to confirm bullish or bearish momentum.
Moving Averages: Employs multiple MA types to determine trend direction and speed.
Range Filtering: Filters out low-volatility periods to focus on high-probability trades.
Trade Conditions:
Long Entry Conditions:
ADX Confirmation: ADX must be above the threshold, indicating a strong uptrend.
RSI and Momentum: RSI below 70 and positive momentum signals.
JMA and SAR: JMA indicates an uptrend, and Parabolic SAR is below the price.
Trend Indicator: Confirms the current trend direction.
Range Filter: Ensures market is in an upward range.
Scalping Option: If enabled, additional scalping conditions must be met.
Short Entry Conditions:
ADX Confirmation: ADX must be above the threshold, indicating a strong downtrend.
RSI and Momentum: RSI above 30 and negative momentum signals.
JMA and SAR: JMA indicates a downtrend, and Parabolic SAR is above the price.
Trend Indicator: Confirms the current trend direction.
Range Filter: Ensures market is in a downward range.
Scalping Option: If enabled, additional scalping conditions must be met.
Position Management:
Entry Execution: Places long or short orders based on the identified conditions and user-selected position types (Longs, Shorts, or Both).
Take Profit (TP): Automatically sets TP levels based on predefined percentages, adjusting dynamically with consecutive trades.
Re-Entry Mechanism: Allows for automatic re-entry upon TP hit, maintaining active trading positions.
Exit Conditions: Closes positions when TP levels are reached or when opposing trend signals are detected.
Visual Indicators:
Bar Coloring: Highlights bars in green for bullish conditions, red for bearish, and orange for neutral.
Plotting Price Levels: Marks significant price levels related to TP and trade entries with cross symbols.
Signal Shapes: Displays triangle and flag shapes on the chart to indicate trade entries and TP hits.
Alerts:
Custom Alerts: Configured to notify traders of long entries, short entries, and TP hits, enabling timely trade management and execution.
Usage Instructions
Setup:
Apply the Strategy: Add the script to your TradingView chart set to BTCUSDT with a 65-minute timeframe.
Configure Inputs: Adjust the input parameters under their respective groups (e.g., Source Settings, ADX, RSI, Trend Strength, etc.) to match your trading preferences and risk tolerance.
Position Selection:
Choose Position Type: Use the Position input to select Longs, Shorts, or Both based on your market outlook.
Execution: The strategy will automatically execute and manage positions according to the selected type, ensuring targeted trading actions.
Signal Interpretation:
Buy Signals: Blue triangles below the bars indicate potential long entry points.
Sell Signals: Red triangles above the bars indicate potential short entry points.
Take Profit Signals: Flags above or below the bars signify TP hits for long and short positions, respectively.
Bar Colors: Green bars suggest bullish conditions, red bars indicate bearish conditions, and orange bars represent neutral or consolidating markets.
Risk Management:
Default Position Size: Set to 100% of equity. Adjust the default_qty_value as needed for your risk management strategy.
Commission: Accounts for a 0.1% commission per trade. Adjust the commission_value to match your broker's fees.
Pyramiding: Allows up to one additional position per direction to enhance gains during strong trends.
Backtesting and Optimization:
Historical Testing: Utilize TradingView's backtesting features to evaluate the strategy's performance over historical data.
Parameter Tuning: Optimize input parameters to align the strategy with current market dynamics and personal trading objectives.
Alerts Configuration:
Set Up Alerts: Enable and configure alerts based on the predefined alertcondition statements to receive real-time notifications of trade signals and TP hits.
Additional Features
Comprehensive Indicator Integration: Combines multiple technical indicators to provide a holistic view of market conditions, enhancing trade signal accuracy.
Scalping Options: Offers an optional scalping mechanism to capitalize on short-term price movements, increasing trading flexibility.
Dynamic Take Profit Levels: Adjusts TP targets based on the number of consecutive trades, maximizing profit potential during favorable trends.
Advanced Volume Analysis: Utilizes various volume indicators to confirm trend strength and validate trade signals.
Customizable Range Filtering: Filters trades based on market volatility, ensuring trades are taken during optimal conditions.
Heikin-Ashi Candle Support: Optionally uses Heikin-Ashi candles for smoother price action analysis and reduced noise.
====Recommendations====
Thorough Backtesting:
Historical Performance: Before deploying the strategy in a live trading environment, perform comprehensive backtesting to understand its performance under various market conditions. These are the premium settings for Avalanche Coinbase.
Optimization: Regularly review and adjust input parameters to ensure the strategy remains effective amidst changing market volatility and trends. Backtest the strategy for each crypto and make sure you are in the right brokage when using the volume sources as it will affect the overall outcome of the trading strategy.
Risk Management:
Position Sizing: Adjust the default_qty_value to align with your risk tolerance and account size.
Stop-Loss Implementation: Although the strategy includes TP levels, they're also consided to be a stop-loss mechanisms to protect against adverse market movements.
Commission Adjustment: Ensure the commission_value accurately reflects your broker's fees to maintain realistic backtesting results. Generally, 0.1~0.3% are most of the average broker's comission fees.
Slipage: The slip comssion is 1 Tick, since the strategy is adjusted to only enter/exit on bar close where most positions are available.
Continuous Monitoring:
Strategy Performance: Regularly monitor the strategy's performance to ensure it operates as expected and make adjustments as needed. A max-drawndown hit has been added to operate in case the premium Avalanche settings go wrong, but you can turn it off an adjust the equity percentage to 50% if you are confortable with the high volatile max-drown or even 100% if your account allows you to borrow cash.
Customization:
Indicator Parameters: Tailor indicator settings (e.g., ADX length, RSI period, MA types) to better fit your specific trading style and market conditions.
Scalping Options: Enable or disable scalping based on your trading preferences and risk appetite.
Conclusion
Gabriel's Witcher Strategy is a robust and versatile trading solution designed to navigate the complexities of the Crypto market. By integrating a wide array of technical indicators and providing extensive customization options, this strategy empowers traders to execute informed and strategic trades. Its comprehensive approach, combining trend analysis, momentum detection, volume evaluation, and range filtering, ensures that trades are taken during optimal market conditions. Additionally, the inclusion of scalping features and dynamic take-profit management enhances the strategy's adaptability and profitability potential. Unlike any trading strategy, with both diligent testing and continuous monitoring under the strategy tester, it's possible to achieve sustained success by adjusting the settings to the individual Crypto that need it, for example this one is preset for Avalanche Coinbase 65 Miinutes but it can be adjust for BTCUSD or Etherium if you backtest and search for the right settings.

Momentum Squeeze Scalper [M2S} [ITZS]Overview
The Momentum Squeeze Scalper is a technical analysis tool designed to identify potential breakout opportunities in the market. It combines elements of momentum analysis with a "squeeze" concept based on Bollinger Bands and Keltner Channels.
Key Components
1. Squeeze Detection
The indicator uses two types of squeezes:
a) Loose TTM Fire (Loose Squeeze): Represented by orange dots. This occurs when one side of the Bollinger Bands is inside the Keltner Channel.
b) Strict TTM Fire (Strict/Tight Squeeze): Represented by green dots. This happens when both sides of the Bollinger Bands are inside the Keltner Channel.
These squeezes can indicate potential breakouts in either direction (long or short).
Long Squeeze: Occurs when prices are compressed at a low level, potentially leading to an upward breakout.
Short Squeeze: Happens when prices are compressed at a high level, possibly leading to a downward breakout.
2. Momentum Line
The Momentum Line is a key feature of this indicator. Its color changes based on specific conditions:
Color 0 (White): Default color, indicating neutral momentum.
Color 1 (Green): Indicates positive momentum. This color appears when:
1. The histogram is positive and increasing, or
2. The momentum is increasing during a squeeze (loose or strict), or
3. There's a strict squeeze in place.
Color 2 (Red): Indicates negative momentum. This color appears when:
1. The histogram is negative and decreasing, or
2. The momentum is decreasing during a squeeze (loose or strict), or
3. There's a strict squeeze in place.
The changing colors of the Momentum Line help traders quickly identify shifts in market momentum and potential trading opportunities.
3. Signal Line
The orange line is the signal line, which is a smoothed version of the momentum line. It can help confirm trend changes when it crosses the momentum line.
Inputs and Their Effects
1. Momentum Period (default: 17):
Purpose: Determines the lookback period for momentum calculation.
Effect: A longer period makes the indicator less sensitive to short-term price changes, resulting in smoother momentum lines but potentially slower signals. A shorter period will make the indicator more responsive to recent price action but may increase noise.
2. Signal Period (default: 8):
Purpose: Sets the smoothing period for the signal line.
Effect: A shorter period makes it more responsive to recent price action, potentially providing earlier signals but with a higher chance of false alerts. A longer period creates a smoother signal line, reducing false signals but potentially delaying entry/exit points.
3. Smooth Momentum (default: false):
Purpose: Determines whether to use EMA smoothing on the source price before momentum calculation.
Effect: When true, it can reduce noise in the momentum calculation, potentially providing clearer signals in choppy markets. When false, it responds more quickly to price changes.
Smoothing Period (default: 1):
Purpose: Sets the period for EMA smoothing when Smooth Momentum is true.
Effect: A higher value creates a smoother momentum line, potentially reducing false signals but also increasing lag.
BB Length (default: 7):
Purpose: Defines the period for Bollinger Bands calculation.
Effect: A shorter length makes the bands more sensitive to price changes, potentially identifying squeezes more quickly but also increasing the chance of false signals. A longer length creates more stable bands but may delay squeeze identification.
StDev (default: 1.0):
Purpose: Standard deviation multiplier for Bollinger Bands.
Effect: Higher values create wider bands, making squeezes less frequent but potentially more significant. Lower values create tighter bands, increasing the frequency of squeezes but potentially reducing their reliability.
Keltner Length (default: 1):
Purpose: Sets the period for Keltner Channel calculation.
Effect: A longer length creates a wider, more stable channel, reducing the frequency of squeezes but potentially making them more reliable. A shorter length creates a tighter channel, increasing squeeze frequency but potentially reducing significance.
Multiplier (default: 0.5):
Purpose: Multiplier for Keltner Channel width.
Effect: Higher values create a wider channel, making squeezes less frequent but potentially more significant. Lower values create a tighter channel, increasing squeeze frequency but potentially reducing their reliability.
KC Smoothing Period (default: 10):
Purpose: Determines the smoothing period for the momentum histogram.
Effect: A longer period creates a smoother histogram, potentially reducing false signals but increasing lag. A shorter period makes the histogram more responsive but potentially noisier.
Smoothing Type (default: None):
Purpose: Allows selection of different smoothing algorithms for the momentum histogram.
Effect: Different smoothing types (e.g., ALMA, DEMA, EMA) can affect how quickly the histogram responds to price changes and how smooth the resulting line is. This can impact the timing and frequency of momentum color changes.
How to Use the Indicator
Look for squeeze dots (orange or green) to identify periods of low volatility.
Pay attention to the color of the Momentum Line:
1. Green suggests potential bullish momentum
2. Red suggests potential bearish momentum
Use the histogram for additional confirmation of momentum strength and direction.
Consider entering trades when the squeeze dots disappear and the Momentum Line shows a strong color signal (green for long, red for short).
How to Adjust the Indicator
1. For More Frequent Signals: Decrease the Momentum Period, Signal Period, BB Length, and Keltner Length. Increase the StDev and decrease the Multiplier. This will make the indicator more sensitive but may increase false signals.
2. For Fewer, More Reliable Signals: Increase the Momentum Period, Signal Period, BB Length, and
Keltner Length. Decrease the StDev and increase the Multiplier. This will reduce sensitivity but may miss some opportunities.
3. To Detect Stronger Squeezes: Increase the StDev for Bollinger Bands and decrease the Multiplier for Keltner Channels. This will make it harder for squeezes to occur, potentially identifying stronger setups.
4. To Reduce Noise: Enable Smooth Momentum and increase the Smoothing Period. Choose a smoothing type like EMA or DEMA for the histogram. This can help in choppy or ranging markets.
5. For Faster Response: Decrease the Momentum Period and Signal Period, and choose a responsive smoothing type like EMA for the histogram. This can be useful in fast-moving markets but may increase false signals.
Interpretation and Trading
1. Squeeze Formation: When you see orange (loose) or green (strict) dots, it indicates a potential buildup of energy in the market. This compression often precedes a significant move.
2. Momentum Direction: Watch the Momentum Line color changes:
Transition to Green: Suggests increasing bullish momentum, especially during a squeeze.
Transition to Red: Suggests increasing bearish momentum, especially during a squeeze.
White: Indicates neutral momentum or no clear direction.
3. Confirmation: Look for the Momentum Line (colored) to cross above the Signal Line (orange) for bullish confirmation, or below for bearish confirmation.
4. Exit Signals: When the squeeze dots disappear and the Momentum Line color changes, it often indicates that the compressed energy has been released, and the strong move may be ending.
5. Trend Strength: The distance between the Momentum Line and the Signal Line can indicate trend strength. A wider gap suggests a stronger trend.
Remember, no indicator is perfect. Always use this tool in conjunction with other forms of analysis and proper risk management. It's recommended to backtest and practice with this indicator on historical data before using it in live trading. Adjust the inputs based on your trading style, timeframe, and the specific characteristics of the asset you're trading.
Trend Signals with TP & SL [UAlgo] StrategyThe "Trend Signals with TP & SL Strategy" is a trading strategy designed to capture trend continuation signals while incorporating sophisticated risk management techniques. This strategy is tailored for traders who wish to capitalize on trending market conditions with precise entry and exit points, automatically calculating Take Profit (TP) and Stop Loss (SL) levels based on either Average True Range (ATR) or percentage values. The strategy aims to enhance trade management by preventing multiple simultaneous positions and dynamically adapting to changing market conditions.
This strategy is highly configurable, allowing traders to adjust sensitivity, the ATR calculation method, and the cloud moving average length. Additionally, the strategy can display buy and sell signals directly on the chart, along with visual representation of entry points, stop losses, and take profits. It also features a cloud-based trend analysis using a MACD-driven color fill that indicates the strength and direction of the trend.
🔶 Key Features
Configurable Trend Continuation Signals:
Source Selection: The strategy uses the midpoint of the high-low range as the default source, but it is adjustable.
Sensitivity: The sensitivity of the trend signals can be adjusted using a multiplier, ranging from 0.5 to 5.
ATR Calculation: The strategy allows users to choose between two ATR calculation methods for better adaptability to different market conditions.
Cloud Moving Average: Traders can adjust the cloud moving average length, which is used in conjunction with MACD to provide a visual trend indication.
Take Profit & Stop Loss Management:
ATR-Based or Percent-Based: The strategy offers flexibility in setting TP and SL levels, allowing traders to choose between ATR-based multipliers or fixed percentage values.
Dynamic Adjustment: TP and SL levels are dynamically adjusted according to the selected method, ensuring trades are managed based on real-time market conditions.
Prevention of Multiple Positions:
Single Position Control: To reduce risk and enhance strategy reliability, the strategy includes an option to prevent multiple positions from being opened simultaneously.
Visual Trade Indicators:
Buy/Sell Signals: Clearly displays buy and sell signals on the chart for easy interpretation.
Entry, SL, and TP Lines: Draws lines for entry price, stop loss, and take profit directly on the chart, helping traders to monitor trades visually.
Trend Cloud: A color-filled cloud based on MACD and the cloud moving average provides a visual cue of the trend’s direction and strength.
Performance Summary Table:
In-Chart Statistics: A table in the top right of the chart displays key performance metrics, including total trades, wins, losses, and win rate percentage, offering a quick overview of the strategy’s effectiveness.
🔶 Interpreting the Indicator
Trend Signals: The strategy identifies trend continuation signals based on price action relative to an ATR-based threshold. A buy signal is generated when the price crosses above a key level, indicating an uptrend. Conversely, a sell signal occurs when the price crosses below a level, signaling a downtrend.
Cloud Visualization: The cloud, derived from MACD and moving averages, changes color to reflect the current trend. A positive cloud in aqua suggests an uptrend, while a red cloud indicates a downtrend. The transparency of the cloud offers further nuance, with more solid colors denoting stronger trends.
Entry and Exit Management: Once a trend signal is generated, the strategy automatically sets TP and SL levels based on your chosen method (ATR or percentage). The stop loss and take profit lines will appear on the chart, showing where the strategy will exit the trade. If the price reaches either the SL or TP, the trade is closed, and the respective line is deleted from the chart.
Performance Metrics: The strategy’s performance is tracked in real-time with an in-chart table. This table provides essential information about the number of trades executed, the win/loss ratio, and the overall win rate. This information helps traders assess the strategy's effectiveness and make necessary adjustments.
This strategy is designed for those who seek to engage with trending markets, offering robust tools for entry, exit, and overall trade management. By understanding and leveraging these features, traders can potentially improve their trading outcomes and risk management.
🔷 Related Script
🔶 Disclaimer
Use with Caution: This indicator is provided for educational and informational purposes only and should not be considered as financial advice. Users should exercise caution and perform their own analysis before making trading decisions based on the indicator's signals.
Not Financial Advice: The information provided by this indicator does not constitute financial advice, and the creator (UAlgo) shall not be held responsible for any trading losses incurred as a result of using this indicator.
Backtesting Recommended: Traders are encouraged to backtest the indicator thoroughly on historical data before using it in live trading to assess its performance and suitability for their trading strategies.
Risk Management: Trading involves inherent risks, and users should implement proper risk management strategies, including but not limited to stop-loss orders and position sizing, to mitigate potential losses.
No Guarantees: The accuracy and reliability of the indicator's signals cannot be guaranteed, as they are based on historical price data and past performance may not be indicative of future results.

Gaussian Kernel Smoothing MomentumOverview:
The Gaussian Kernel Smoothing Momentum indicator analyzes and quantifies market momentum by applying statistical techniques to price and returns data. This indicator uses Gaussian kernel smoothing to filter noise and provide a more accurate representation of momentum. Additionally, it includes a option to evaluate the absolute score of the momentum to determine if the beginning of a "trend" is likely or if you can expect a "trend" to come to an end.
Kernels and Their Role In Time Series Analysis:
In statistical analysis, a kernel is a weighting function used to estimate the properties of a dataset. Kernels are particularly useful in non-parametric methods, where they serve to smooth data or estimate probability density functions without assuming a specific underlying distribution. The Gaussian kernel, one of the most commonly used, is characterized by its smooth, bell-shaped curve which provides a natural way to give more weight to data points closer to the target value and less weight to those further away.
Uses of Kernels in Time Series Analysis
Kernels play a significant role in time series analysis, especially in the context of smoothing and filtering. With kernel functions, you can reduce noise and extract the underlying systematic component or signal from the data. This process is essential for identifying long-term patterns in the data, which is often obscured by short-term fluctuations and random noise.
Kernel Smoothing
Kernel smoothing is a technique that applies a kernel function to a set of data points to create a smooth curve, effectively reducing the impact of random variations. In time series analysis, kernel smoothing helps to filter out short-term noise while retaining significant trends and "patterns". The Gaussian kernel, with its emphasis on nearby points, is particularly effective for this purpose, as it smooths the data in a way that highlights the underlying structure without overfitting to random fluctuations.
Additionally, kernels are used in non-parametric volatility estimation, option pricing models, and for detecting anomalies in financial data. Their flexibility and ability to handle complex, non-linear relationships make them well-suited for the often noisy data encountered in financial markets.
Momentum Component
The momentum component of the indicator is designed to quantify the directional movement of asset prices by applying the Gaussian kernel smoothing to the expected return of the price data. The data then has the variance stabilized and normalizes the distribution of price changes to be able to more efficiently analyze the momentum.
The Gaussian kernel smoothing function serves to filter out high-frequency noise, isolating the underlying systematic component of the momentum. This is achieved by weighting the data points based on their proximity to the current observation, with closer data points exerting a stronger influence. The resulting smoothed momentum provides a clearer of the directional bias in the market, devoid of short-term volatility.
Absolute Move Component
The absolute move component is a extension of the momentum analysis, focusing on the magnitude rather than the direction of the price movements. This component captures the absolute score of the smoothed momentum series, providing a measure of strength or intensity of the price movement, independent from its direction. The absolute move component also incorporates a Kalman filter to further smooth and refine the signal. The Kalman filter dynamically adjusts based on the observed variance in the data, to reduce the impact of outliers.
What to make of this indicator
The smoothed momentum line helps determine whether the market is experiencing upward and downward momentum. If the momentum line is above zero and rising, this suggest a positive expected returns. Conversely, if the momentum line is below zero and falling, it indicates negative expected returns.
You should also pay attention to changes in the slope of the momentum line and the moving average of the smoothed momentum(weighted with an optimal sampling size algorithm). A flattening or reversal of the slope may signal a potential shift in market direction. For example, if the momentum line and moving average transitions from rising to falling, it means that the expected return is going from positive to negative so you can see the "trend" as weakening or forming a trend of negative expected returns.
The absolute move component is designed to measure the intensity or strength of the current market movement. A low absolute move value, especially when they are negative or at the lower end of their band, indicates that the momentum and expected return is close to zero, which suggest that the market is experiencing minimal directional movement, which can be a sign of consolidation. High absolute values signal that the market is undergoing a significant price movement. When the absolute move is high and/or rising, it indicates that the movement of the momentum is strong, regardless of whether it is bullish or bearish.
If the absolute move reaches unusually high levels, it could indicate that the market is experiencing an exceptional price move, which might be unsustainable. Traders can anticipate potential reversals or profit taking targets. However, you should avoid trying to trade reversals as exceptionally high values in a time series do not guarantee an immediate reversal. This high values often occur during periods of strong trends or significant events, which can continue longer than expected, and you cant time when it will return to its mean. The mean-reverting nature of some statistical models can suggest a return to the mean, but this assumption can be misleading in financial markets, where trends can persist despite overextending conditions.

Price & Momentum Reversal Indicator [TradeDots]Price & Momentum Divergence Indicator is a variant of the Chande Momentum Oscillator (CMO), designed to identify reversal patterns in overvalued and undervalued markets. This indicator aims to mitigate the common problem of all oscillating indicators: false buy/sell signals during prolonged market trends, by incorporating a volume-weighted approach and momentum analysis.
📝 HOW IT WORKS
Price Extremeness Calculation
The indicator evaluates the extremeness of the current price by analyzing price changes over a fixed window of candlesticks.
It separates the price changes into positive and negative changes, then multiplies them by the bar volume to obtain volume-weighted values, giving higher significance to bars with larger volumes.
Extremeness Ratio
The ratio is calculated by taking the difference between the total positive changes and total negative changes, and then dividing this result by the sum of the total positive and negative changes.
The result is then smoothed to reduce market noise and rescaled to a range between -100 to 100, where 100 indicates all price changes within the window are positive.
Momentum Analysis
Momentum is calculated by measuring the rate of change of the smoothed extremeness ratio, indicating whether market extremeness is slowing and showing signs of reversion.
Reversal Signal Confirmation
For an asset to be considered a reversal, it has to be in the overvalued or undervalued zone (exceeding the overvalued & undervalued threshold). It must then show a slowed momentum change and a price reversion.
Lastly, candlestick analysis is used to confirm the reversal signal, ensuring there is no room for further breakout price movement.
🛠️ HOW TO USE
Candlestick Visualization
Candlestick bodies are painted with gradient colors representing the smoothed price extremeness (OBOS Index), ranging from -100 (solid red) to 100 (solid green). The exact value is displayed in a table at the bottom right corner.
Slowing price momentum is indicated with blue (bearish) and purple (bullish) colors, showing market pressure from the opposite side.
Reversal Confirmation
A decrease in price momentum combined with a price reversal triggers a signal label on the candlestick, indicating a potential pullback or reversal. This can serve as a reference for better entry and exit points.
⭐️ Premium Features
Higher Timeframe (HTF) Analysis
The indicator includes a feature to apply the same algorithm to a selected higher timeframe, ensuring trend alignment across multiple timeframes.
Alert Functions
Real-time notifications for overvalued and undervalued conditions, allowing traders to monitor trades and reversal signals anywhere and anytime.
❗️LIMITATIONS
Accuracy decreases in volatile and noisy markets.
Extended bullish or bearish market conditions may affect performance.
See Author's instructions below to get instant access to this indicator.
RISK DISCLAIMER
Trading entails substantial risk, and most day traders incur losses. All content, tools, scripts, articles, and education provided by TradeDots serve purely informational and educational purposes. Past performances are not definitive predictors of future results.