Super Synchronicity x Musa MoneyThe goal of this indicator is to display a simple and easy method that gives traders a logical strategy that can be applied in many different ways.
This indicator uses fractal support and resistance created by close above or close below candle structures. This indicator displays sell/buy boxes that represents entries and take profit levels. It also shows multi-timeframe breakouts and structure points. In an buy box (green) the bottom of the box symbolizes the stop loss and the top of the box symbolizes the buy entry. In a sell box (red) the bottom of the box symbolizes the entry and the top of the box symbolizes the stop loss. The lines drawn are support and resistance areas on current and higher timeframe showing market structure and trend.
How to use it:
You must choose a higher timeframe and a lower timeframe. The lower timeframe will be in synchronicity with the higher timeframes trend. The boxes that appear will either be green or red depending on the higher timeframes trend. These boxes will represent your entries. The lavender boxes represents your exit. The dark colored boxes represents a higher probability trade than the light colored boxes bases on market structure (higher highs and higher lows or lower higher and lower lows).
Money

UFO + Realtime Divergences (UO x MFI)UFO + Realtime Divergences (UO x MFI) + Alerts
The UFO is a hybrid of two powerful oscillators - the Ultimate Oscillator (UO) and the Money Flow Index (MFI)
Features of the UFO include:
- Optional divergence lines drawn directly onto the oscillator in realtime.
- Configurable alerts to notify you when divergences occur, as well as centerline crossovers.
- Configurable lookback periods to fine tune the divergences drawn in order to suit different trading styles and timeframes.
- Background colouring option to indicate when the oscillator has crossed its centerline.
- Alternate timeframe feature allows you to configure the oscillator to use data from a different timeframe than the chart it is loaded on.
- 2x MTF triple-timeframe Stochastic RSI overbought and oversold confluence signals painted at the top of the panel for use as a confluence for reversal entry trades.
The core calculations of the UFO+ combine the factory settings of the Ultimate Oscillator and Money Flow Index, taking an average of their combined values for its output eg:
UO_Value + MFI_Value / 2
The result is a powerful oscillator capable of detecting high quality divergences, including on very low timeframes and highly volatile markets, it benefits from the higher weighting of the most recent price action provided by the Ultimate Oscillators calculations, as well as the calculation of the MFI, which incorporates volume data. The UFO and its incorporated 2x triple-timeframe MTF Stoch RSI overbought and oversold signals makes it well adapted for low timeframe scalping and regular divergence trades in particular.
The Ultimate Oscillator (UO)
Tradingview describes the Ultimate Oscillator as follows:
“The Ultimate Oscillator indicator (UO) is a technical analysis tool used to measure momentum across three varying timeframes. The problem with many momentum oscillators is that after a rapid advance or decline in price, they can form false divergence trading signals. For example, after a rapid rise in price, a bearish divergence signal may present itself, however price continues to rise. The Ultimate Oscillator attempts to correct this by using multiple timeframes in its calculation as opposed to just one timeframe which is what is used in most other momentum oscillators.”
You can read more about the UO and its calculations here
The Money Flow Index ( MFI )
Investopedia describes the True Strength Indicator as follows:
“The Money Flow Index ( MFI ) is a technical oscillator that uses price and volume data for identifying overbought or oversold signals in an asset. It can also be used to spot divergences which warn of a trend change in price. The oscillator moves between 0 and 100. Unlike conventional oscillators such as the Relative Strength Index ( RSI ), the Money Flow Index incorporates both price and volume data, as opposed to just price. For this reason, some analysts call MFI the volume-weighted RSI .”
You can read more about the MFI and its calculations here
The Stochastic RSI (relating to the built-in MTF Stoch RSI feature)
The popular oscillator has been described as follows:
“The Stochastic RSI is an indicator used in technical analysis that ranges between zero and one (or zero and 100 on some charting platforms) and is created by applying the Stochastic oscillator formula to a set of relative strength index ( RSI ) values rather than to standard price data. Using RSI values within the Stochastic formula gives traders an idea of whether the current RSI value is overbought or oversold. The Stochastic RSI oscillator was developed to take advantage of both momentum indicators in order to create a more sensitive indicator that is attuned to a specific security's historical performance rather than a generalized analysis of price change.”
You can read more about the Stochastic RSI and its calculations here
How do traders use overbought and oversold levels in their trading?
The oversold level, that is when the Stochastic RSI is above the 80 level is typically interpreted as being 'overbought', and below the 20 level is typically considered 'oversold'. Traders will often use the Stochastic RSI at an overbought level as a confluence for entry into a short position, and the Stochastic RSI at an oversold level as a confluence for an entry into a long position. These levels do not mean that price will necessarily reverse at those levels in a reliable way, however. This is why this version of the Stoch RSI employs the triple timeframe overbought and oversold confluence, in an attempt to add a more confluence and reliability to this usage of the Stoch RSI .
What are divergences?
Divergence is when the price of an asset is moving in the opposite direction of a technical indicator, such as an oscillator, or is moving contrary to other data. Divergence warns that the current price trend may be weakening, and in some cases may lead to the price changing direction.
There are 4 main types of divergence, which are split into 2 categories;
regular divergences and hidden divergences. Regular divergences indicate possible trend reversals, and hidden divergences indicate possible trend continuation.
Regular bullish divergence: An indication of a potential trend reversal, from the current downtrend, to an uptrend.
Regular bearish divergence: An indication of a potential trend reversal, from the current uptrend, to a downtrend.
Hidden bullish divergence: An indication of a potential uptrend continuation.
Hidden bearish divergence: An indication of a potential downtrend continuation.
How do traders use divergences in their trading?
A divergence is considered a leading indicator in technical analysis , meaning it has the ability to indicate a potential price move in the short term future.
Hidden bullish and hidden bearish divergences, which indicate a potential continuation of the current trend are sometimes considered a good place for traders to begin, since trend continuation occurs more frequently than reversals, or trend changes.
When trading regular bullish divergences and regular bearish divergences, which are indications of a trend reversal, the probability of it doing so may increase when these occur at a strong support or resistance level . A common mistake new traders make is to get into a regular divergence trade too early, assuming it will immediately reverse, but these can continue to form for some time before the trend eventually changes, by using forms of support or resistance as an added confluence, such as when price reaches a moving average, the success rate when trading these patterns may increase.
Typically, traders will manually draw lines across the swing highs and swing lows of both the price chart and the oscillator to see whether they appear to present a divergence, this indicator will draw them for you, quickly and clearly, and can notify you when they occur.
Setting alerts.
With this indicator you can set alerts to notify you when any/all of the above types of divergences occur, on any chart timeframe you choose.
Configurable pivot period.
You can adjust the default pivot lookback values to suit your prefered trading style and timeframe. If you like to trade a shorter time frame, lowering the default lookback values will make the divergences drawn more sensitive to short term price action.
Disclaimer: This script includes code from the stock UO and MFI by Tradingview as well as the Divergence for Many Indicators v4 by LonesomeTheBlue.

MFI + Realtime DivergencesMoney Flow Index (MFI) + Realtime Divergences + Alerts
This version of the MFI indicator adds the following 5 additional features to the stock MFI:
- Optional divergence lines drawn directly onto the oscillator in realtime.
- Configurable alerts to notify you when divergences occur.
- Configurable lookback periods to fine tune the divergences drawn in order to suit different trading styles and timeframes, including the ability to enable automatic adjustment of pivot period per chart timeframe.
- Background colouring option to indicate when the MFI oscillator has crossed above or below its centerline, or optionally when both the MFI has crossed its centerline and an external oscillator, which can be linked via the settings, has also crossed its centerline.
- Alternate timeframe feature allows you to configure the oscillator to use data from a different timeframe than the chart it is loaded on.
This indicator adds additional features onto the standard MFI , whose core calculations remain unchanged. Namely the configurable option to automatically, quickly and clearly draw divergence lines onto the oscillator for you as they occur in realtime. It also has the addition of unique alerts, so you can be notified when divergences occur without spending all day watching the charts. Furthermore, this version of the TSI comes with configurable lookback periods, which can be configured in order to adjust the sensitivity of the divergences, in order to suit shorter or higher timeframe trading approaches.
What is the Money Flow Index ( MFI )?
Investopedia describes the True Strength Indicator as follows:
“The Money Flow Index ( MFI ) is a technical oscillator that uses price and volume data for identifying overbought or oversold signals in an asset. It can also be used to spot divergences which warn of a trend change in price. The oscillator moves between 0 and 100.
Unlike conventional oscillators such as the Relative Strength Index ( RSI ), the Money Flow Index incorporates both price and volume data, as opposed to just price. For this reason, some analysts call MFI the volume-weighted RSI .”
What are divergences?
Divergence is when the price of an asset is moving in the opposite direction of a technical indicator, such as an oscillator, or is moving contrary to other data. Divergence warns that the current price trend may be weakening, and in some cases may lead to the price changing direction.
There are 4 main types of divergence, which are split into 2 categories;
regular divergences and hidden divergences. Regular divergences indicate possible trend reversals, and hidden divergences indicate possible trend continuation.
Regular bullish divergence: An indication of a potential trend reversal, from the current downtrend, to an uptrend.
Regular bearish divergence: An indication of a potential trend reversal, from the current uptrend, to a downtrend.
Hidden bullish divergence: An indication of a potential uptrend continuation.
Hidden bearish divergence: An indication of a potential downtrend continuation.
Setting alerts.
With this indicator you can set alerts to notify you when any/all of the above types of divergences occur, on any chart timeframe you choose.
Configurable pivot periods.
You can adjust the default pivot periods to suit your prefered trading style and timeframe. If you like to trade a shorter time frame, lowering the default lookback values will make the divergences drawn more sensitive to short term price action.
How do traders use divergences in their trading?
A divergence is considered a leading indicator in technical analysis , meaning it has the ability to indicate a potential price move in the short term future.
Hidden bullish and hidden bearish divergences, which indicate a potential continuation of the current trend are sometimes considered a good place for traders to begin, since trend continuation occurs more frequently than reversals, or trend changes.
When trading regular bullish divergences and regular bearish divergences, which are indications of a trend reversal, the probability of it doing so may increase when these occur at a strong support or resistance level . A common mistake new traders make is to get into a regular divergence trade too early, assuming it will immediately reverse, but these can continue to form for some time before the trend eventually changes, by using forms of support or resistance as an added confluence, such as when price reaches a moving average, the success rate when trading these patterns may increase.
Typically, traders will manually draw lines across the swing highs and swing lows of both the price chart and the oscillator to see whether they appear to present a divergence, this indicator will draw them for you, quickly and clearly, and can notify you when they occur.
Disclaimer: This script includes code from the stock MFI by Tradingview as well as the Divergence for Many Indicators v4 by LonesomeTheBlue.

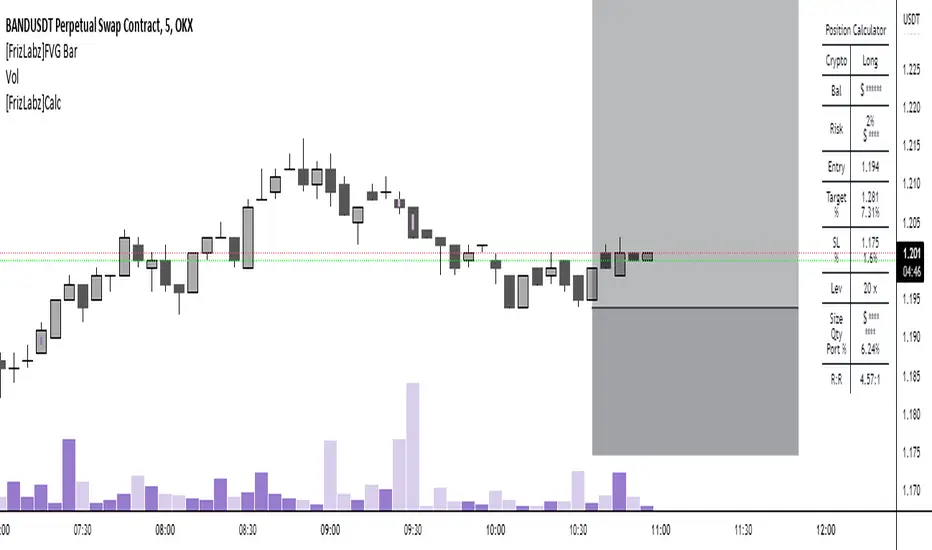
[FrizLabz]FVG Bar
For those of you that like to keep your charts nice and tidy for your Technical Analysis!
FVG = Fair Value Gap
Fair Value Gaps are when impulse movements create an imbalance in price leaving unfilled orders.. they are popular because after one is created we often observe price return to fill these unfilled orders
3 candles make a FVG
When the high/low of most recent candle is lower/high than the low/high of the bar before last
Similar to my other FVG indicator but this one allows you to delete Filled FVGs and have them adjust when filled
Uses a line whose x1 and x2 are on the FVG bar and adjust the size of the FVG with line width because line width on line.new()s doesnt have a cap on line width like plot()s do
Not much too it I made this because a few people were asking if they could delete the FVG after it was Mitigated and since my other uses plots it wasnt possible
so I hope this works for those who were asking about it
hope you enjoy please let me know if you have an idea or find a bug,
Thank You! -
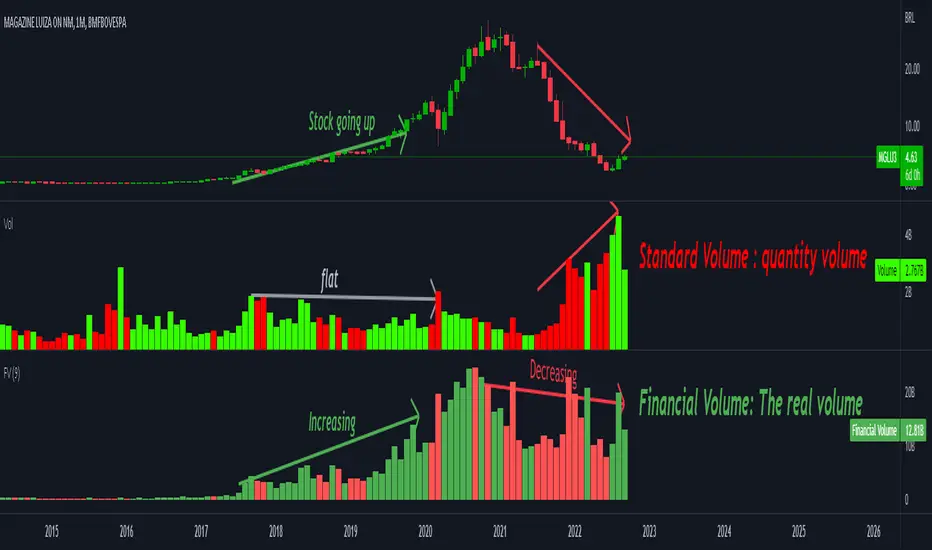
Financial VolumeFinancial Volume is the quantity of a certain asset traded mutiplied by its price. In other others, it's the amount of money traded for that particular asset.
TradingView uses the "quantity" volume as standard (for a good reason) and actually there is no "right" volume but the quantity volume alone might give the wrong idea.
In the shown example the stock crashed from 20's to below 2 brl. Since it got cheaper, it became easier to trade it and the quantity volume increased. But the amount of of money traded actually decreased, indicating less interest from the market.
Also back in the stock's golden age, the quantity volume stayed flat but the amount of money was actually increasing indicating the market was more interested in that stock.
The Gral : Alpha Scalping Demo (Atom)You want to make money. This bot will allow you to do it.
We know how it can be challenging, frustrating, struggling to make money especially in bear market. Save your energy, your emotions, your nerves! Alpha Scalping will allow you to sleep better and make money while you sleep!
We tested hundreds of indicators, strategies, mt4 ea and bots since 2010, today we will start to release a series of successful bots and automatic strategies for you, some of them will be free, some of them will be paid (monthly subscriptions)
We will also indicate how to connect the Alpha Scalping to your Binance or FTX account so you can trade automatically.
Enjoy, subscribe and stay tuned!
NB : This bot is a demo only, it will work only on ATOMUSDTPERP
Bot for ALGOUSDTPERP :

Money Flow LineWhat is this? The Money Flow Line (MFL) indicator is at its core a more even-tempered version of the Price-Volume-Trend (PVT). The primary difference is the usage of `hlc3` ((high + low + close) / 3) rather than `close` to use the "typical price" that it critical to the calculation of the Money Flow Index (MFI). Other similar indicators include the Accumulation Distribution Line (ADL) and the On Balance Volume (OBV) indicators. The purpose of all of these indicators is to attempt to measure the strength of the money flow by combining price and volume into a rolling measurement that can be compared over time to look for confirmations and divergences.
The indicator also includes an optional averaging (smoothing) line that can be enabled in the display settings. Enabling this smoothing line with a desired period allows for simpler trend comparisons and also allows the user to view how far the line has diverged from the mean. This creates an indicator very similar to Elder's Force Index (EFI), which is also a `close * volume` style indicator.
Why is this important? After an extreme movement or volume spike the MFI will "snap back" sharply as that bar eventually exits the set period. This produces a result that is meaningless and skews the indicator away from the market structure. Because of this behavior, range clamping, and the loss of comparative history I prefer to shy away from oscillator style indicators. The Money Flow Line instead gives you all of the history so you may compare and see the broader trend without sharp snaps in history based on an arbitrary period setting.
Why is this better? This produces a no-lag indicator that isn't subject to the harsh skewing produced by they Money Flow Index's period calculation. It doesn't lose history like MFI or EFI, is clear about the trend direction, and prefers a "typical price" (averaging the entire range of each bar) rather than whatever happens to be the closing price for a given bar.
How can I use it? The indicator is attempting to measure supply and demand in the markets. No indicator is perfect, but we can use all of the information we have available to make our best predictions. There are only 3 pieces of data the market gives us:
1. Price (action)
2. Volume
3. Time
The Money Flow Line combines all of these data points into a readable rolling data set that attempts to show subtle balance of power shifts based on changes in volume and "smart money" (or "big money") stepping in and out of the picture. Much like PVT, we look for the same things:
- Trend Identification: an up or down trend appears in the MFL
- Confirmations: the MFL agrees with price action in direction and magnitude
- Divergence: the MFL disagrees with price action, indicating a reversal may be coming soon
When applying the smoothing line we can also look for similar things we would with EFI. The primary case would be to look for the MFL to jump very far away from the mean (a high magnitude movement) which indicates that price may be reverting towards the mean soon (a "mean reversion"). On the other hand, it may indicate strength in the current price direction. All of these predictions depend heavily on price action and market structure. Good luck!

Technimentals S&P Weighted FlowThis script runs a proprietary money flow algorithm three times with different user defined inputs on the subsectors of the S&P, weights their outputs directly according to their weighting in the S&P and then plots the cumulative total of the 33 outputs as a single line which overlays the chart.
The algorithm works by measuring relative volatility on each candlestick compared to the previous candlestick and compares that with it's smoothed recent volatility . This produces a binary (signum) output which is then weighted and accumulated.
The script is designed for use on shorter term timeframes. I do not recommend using this indicator on the daily timeframe or higher unless you lower the timeframe setting inside the script itself. The reason for this is that the signals it provides are often very slow and require zooming the chart out to get enough context to interpret the signals. For example, using this indicator on the one minute timeframe may produce signals several days out, or more!

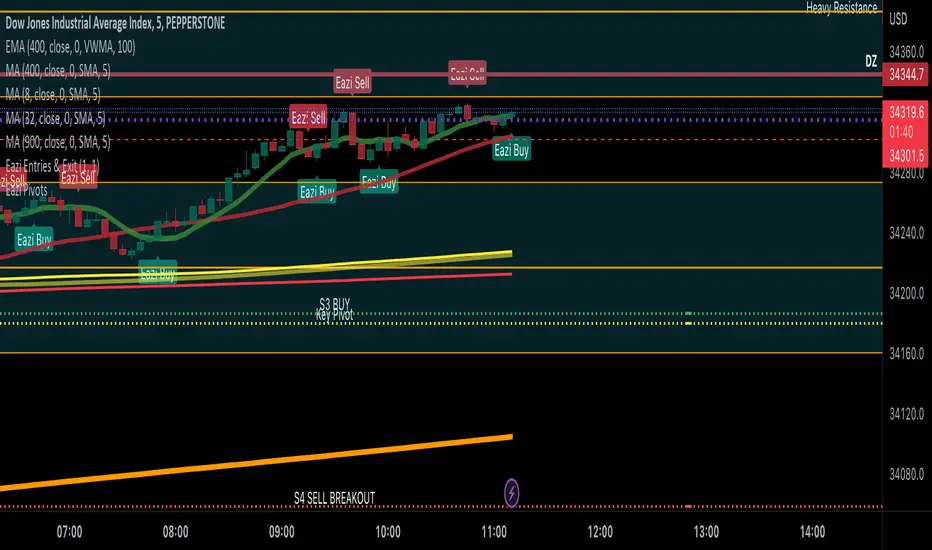
Eazi Money Pro+ Pivot [ 4Reel ]This Indicator is designed to catch the daily low / high pivot point!
If you're looking to maximize your pip count, then this is the tool you need to catch that ULTIMATE ENTRY.
Eazi Money Pro+ [ 4Reel ]This Indicator is designed to catch the daily low / high pivot point!
If you're looking to maximize your pip count, then this is the tool you need to catch that ULTIMATE ENTRY.
Technimentals NDX Weighted FlowThis script runs a proprietary money flow algorithm three times with different user defined inputs on the top 20 components of the NDX, weights their outputs directly according to their weighting in the NDX and then plots the cumulative total of the 60 outputs as a single line which overlays the chart.
The algorithm works by measuring relative volatility on each candlestick compared to the previous candlestick and compares that with it's smoothed recent volatility . This produces a binary (signum) output which is then weighted and accumulated.
The script is designed for use on shorter term timeframes. I do not recommend using this indicator on the daily timeframe or higher unless you lower the timeframe setting inside the script itself. The reason for this is that the signals it provides are often very slow and require zooming the chart out to get enough context to interpret the signals. For example, using this indicator on the one minute timeframe may produce signals several days out.

EMP PEG / TWAP 1.01 Crypto DefiThis script is for my EMP friends. This addon is based upon Etherium price. It will take the Etherium price and divide by 4,000 to get the PEG price. From there, it will multiply by 1.01 to get the TWAP 1.01. Since it takes 1.01 for the boardroom to print, the yellow line is the important line. TWAP will be showed by default. You can switch between or have both indicators on. You can drag the indicator screen up to get a bigger chart. You can also use this for looking back to see where PEG or TWAP 1.01 was during certain EMP prices. Understand this will get you close to seeing when Boardroom will print. Nothing is exact. How I use it: I place a green and yellow horizontal line on an EMP chart from Dexscreener dexscreener.com You can check this chart to find out what to move your horizontal lines to. Come join the fun at emp.money

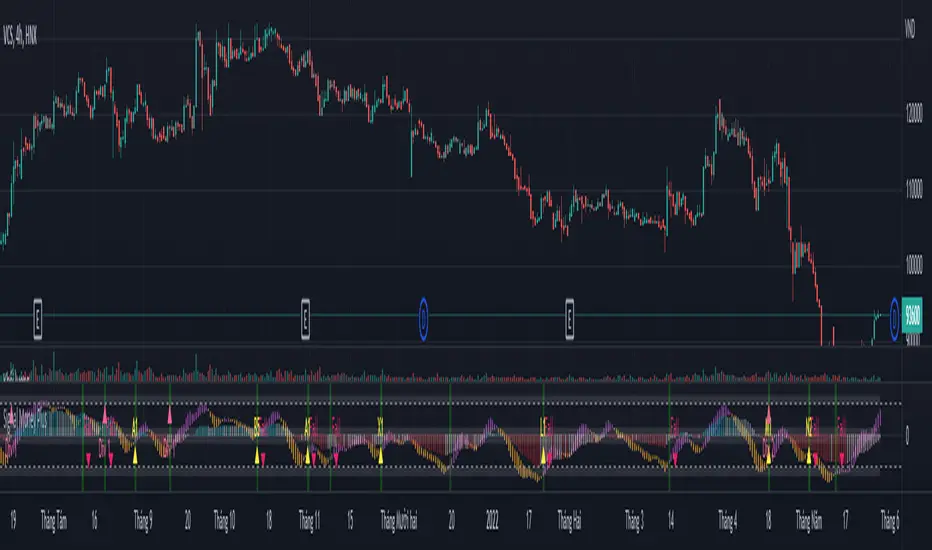
Signal Money PlusSignal Money Plus is a trend analysis indicator including Signal Money and Signal Money Plus.
Signal Money:
- Signal Money enters the overbought or oversold area and the price fluctuates around the strong support or resistance area, giving a reliable signal.
- Signal Money creates a divergence, and the price fluctuates around a strong support or resistance area, giving a reliable signal.
- The price fluctuates in a narrow range but the Signal Money correcting according to the elliott wave pattern gives a reliable signal.
Signal Money Plus:
- Money Plus > 0 for positive cash flow trend. Money Plus < 0 for negative cash flow trend. Money Plus fluctuates around -20 to 20, showing an accumulation trend waiting for a confirmation signal.
- Money Plus creates divergence for reliable signal
Use combination Signal Money Plus:

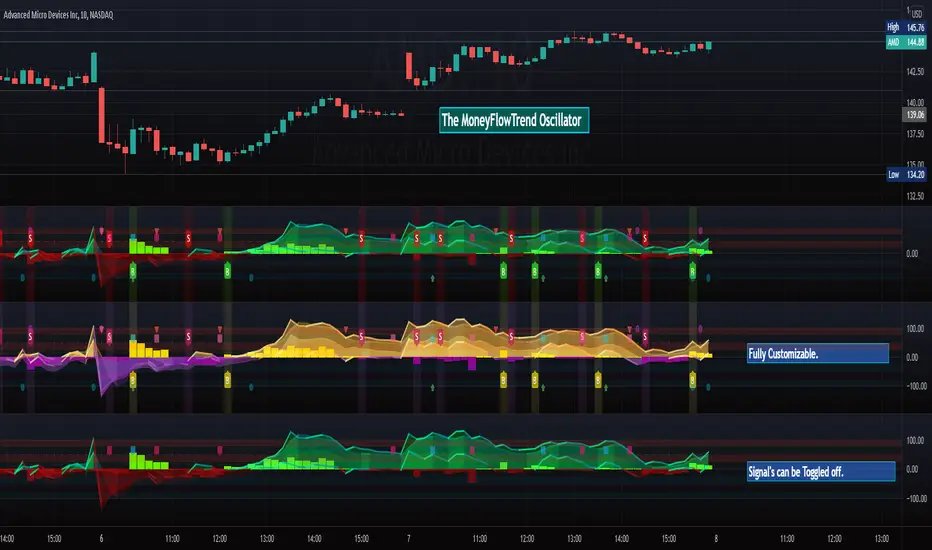
MoneyFlowTrend Oscillator (cc) [M.Right]Hey Traders,
Tonight I present to you a brand new indicator.
I call it the MoneyFlowTrend Oscillator . This is another one that I've been piecing together for years and learning how to code pine has allowed me to bring it to life.
Built on the idea of Supply & Demand Zones , this utilizes money flow and numerous calculations to create a picture of what is happening underneath the surface of the price action.
Richard Wykoff was one of the first market analysts to explain how the economic cycle can be applied to explain market price action; thus, technical analysis. He described two zones among the total of 4 phases; the two zones are Distribution and Accumulation zones, also known as Supply & Demand zones.
______________________________
Since most of you already know the economic cycle, I will try to be concise.
The basic ideas:
When supply is greater than demand, the price goes up down.
When demand is greater than supply, price goes up.
When demand is equal to supply, the price stays about the same (going sideways).
Price action has --Uptrends, downtrends, and price ranges (consolidation).
Wykoff's 4 phases to explain this price action :
1) Accumulation ( Demand zone)
2) Markup (Uptrend)
3) Distribution ( Supply zone)
4) Markdown (Downtrend)
______________________________
With all that said, usually you will either see a sharp jump from a supply or demand zone or it will consolidate within it. Until a new one is formed on the chart.
This indicator attempts to put all of that into a lower indicator. I tried to separate the retailers and the banks and then put them back together to get a full picture.
The MoneyFlowTrend Oscillator Signals are super accurate.
((accuracy can't always be this close to perfect.))
These are the signals + highlight that I have activated, you can toggle on and off between them.
Fully customizable and includes alerts.
Good luck traders.
Cheers,
Mike
Fed Balance Sheet Growth Rate p.a.Plots the rate of change in the Fed Balance sheet.
Defaults to annual rate of change.
Option to plot the raw balance sheet data.

money managementthis indicator has been designed to make your calculations easier and faster.
you can use this indicator to set tp and sl prices based on your entry price, balance,risk and leverage.
it has been designed only for cryptocurrency market and it is not recommended to use it in other markets!
1- enter your balance in the setting of the indicator.
2- enter risk percentage of your balance.
3- enter your sl percentage.
4- enter your tp percentage.
5- set your leverage if you are trading in futures market.
6- and at last set your entry price.
your position size both in spot market and futures market and the exact price of tp and sl , will be shown top right of the screen.
caution: before using this indicator in real market, please make sure that you understand this indicator's behavior and test it.
--------------------------------------------------------------------
این اندیکاتور برای تسریع محاسبات مدیریت سرمایه و سهولت رعایت آن طراحی شده است.
شما میتوانید با وارد کردن پارامترهاقیمت ورودی، سرمایه کل، ریسک و اهرم، قیمت حد سود و ضرر خود را محاسبه کنید.
همچنین اندازه حجم معاملات شما توسط این اندیکاتور محاسبه خواهد شد.
این اندیکاتور برای بازار کریپتوکارنسی طراحی شده است و استفاده از آن در سایر بازارها پیشنهاد نمیشود.
از بخش تنظیمات اندیکاتورمراحل زیر را انجام دهید:
1- میزان سرمایه خود را در قسمت بالانس وارد کنید
2- میزان ریسک سرمایه در هر معامله را مشخص کنید (به درصد)
3- میزان حد ضرر خود را مشخص کنید (به درصد)
4- میزان حد سود خود را مشخص کنید (به درصد)
5- عدد اهرم خود را وارد کنید
6- قیمت ورود به معامله را وارد کنید
توجه: قبل از استفاده این اندیکاتور در بازار لایو لطفا آن را تست کنید و از کارکرد صحیح آن با مدیریت سرمایه خود اطمینان حاصل فرمایید.


Dziwne MFI Overlay (with highlight)It is simply your traditional MFI , except that your 50 line became the actual price.
Why and how could it be useful? This indicator helps to spot more easily and efficiently divergences .
You could also use it for trend reversals as you usually do with your 50 line, but I would suggest to set a higher length for the MFI, like 155 or something like that.

Fixed price Stop Loss [Takazudo]This strategy is a demo for fixed price stop loss.
This strategy enables you to specify fixed price stop loss. Let's say your deposit is USD. When you trade EURCAD, you need to specify the quantity for trade. Here comes three chances for trade.
A: SL pips: 500
B: SL pips: 200
C: SL pips: 100
In these trade, the risk is different for each. ABC risk ratio is 5:2:1. And, you cannot know how much to lose if the price hits the stop loss. This is a huge problem.
With this strategy, You can specify the fixed risk price for each trade. If you specify 100 USD for the risk, this strategy calculates how much quantity to buy or sell for each entry. In the case above, this strategy guides you how much quantity to buy or sell like below.
A: 2,000 qty (SL: 500pips)
B: 5,000 qty (SL: 200pips)
C: 10,000 qty (SL: 100pips)
If you make entries with those quantity and the price hits the stop loss, You will lose the money like below.
A: 100 USD
B: 100 USD
C: 100 USD
This is what this script does. Fixed price SL.
I tested this caliculation for OANDA's main 28 currency pairs forex listed below.
AUDUSD, EURUSD, GBPUSD, NZDUSD, USDCAD, USDCHF, USDJPY, AUDCAD, AUDCHF, AUDJPY, AUDNZD, CADCHF, CADJPY, CHFJPY, EURAUD, EURCAD, EURCHF, EURGBP, EURJPY, EURNZD, GBPAUD, GBPCAD, GBPCHF, GBPJPY, GBPNZD, NZDCAD, NZDCHF, NZDJPY
I may add more pairs later.
Note: The entry strategy in this script is not intented to win. Check the result. Be careful.

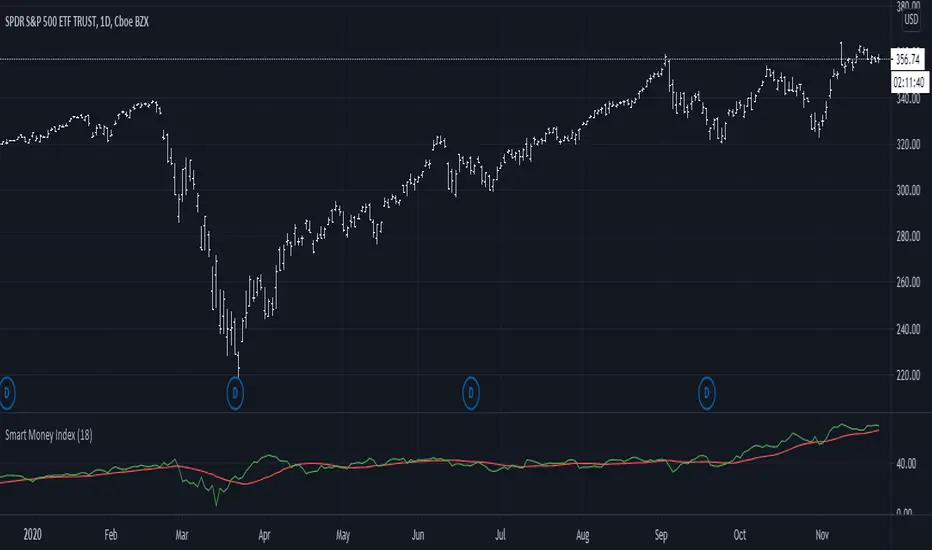
Smart Money Index (SMI)It came to my attention that one very common implementation of SMI was incorrect; rather than subtracting the first hour delta and adding the last hour delta it subtracts the whole day delta and adds the last 30m delta. While this indicator might have had some use, it is not what I understand to be the actual Smart Money Index and so I post this as a correction for use in other scripts.
Total Inflation ModelMeasure of the total economy wide inflation of the US Dollar.
Total Inflation = growth rate of money supply / economic output

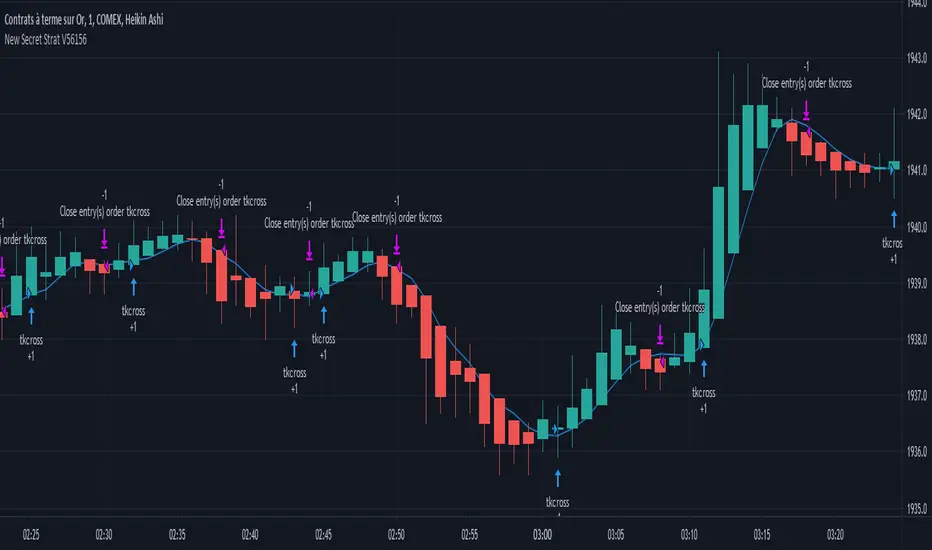
New Secret Strat V56156After years of resserch and development, I finally finished created the best strategy ever made.
It works on every security you can think of: futures, forex, bitcoin, and so on.
It will adapt the pattern of every chart to make the most money possible.
This is the masterpieace I was hopping to produce one day, and now it is.
Right before you.
Enjoy the best strategy that has ever been created.
Good luck !