Money Flow Index (MFI)

Dziwne MFI Overlay (with highlight)It is simply your traditional MFI , except that your 50 line became the actual price.
Why and how could it be useful? This indicator helps to spot more easily and efficiently divergences .
You could also use it for trend reversals as you usually do with your 50 line, but I would suggest to set a higher length for the MFI, like 155 or something like that.

ArtY Money Flow IndexThis is modification of built-in Money Flow Index with painting of oversold and overbought areas.

GOD's EYEGet to know when to accumulate when biggies are buying and when to stay away from the stock

Money Flow Index (MFI)User request. A tuned version of the built-in True Strength Index (TSI) indicator with the following options included:
MFI - Signal Histogram
MFI/Signal Crossovers
MFI/Signal Ribbon
Bands breakouts highlighting
Middle line crossovers background

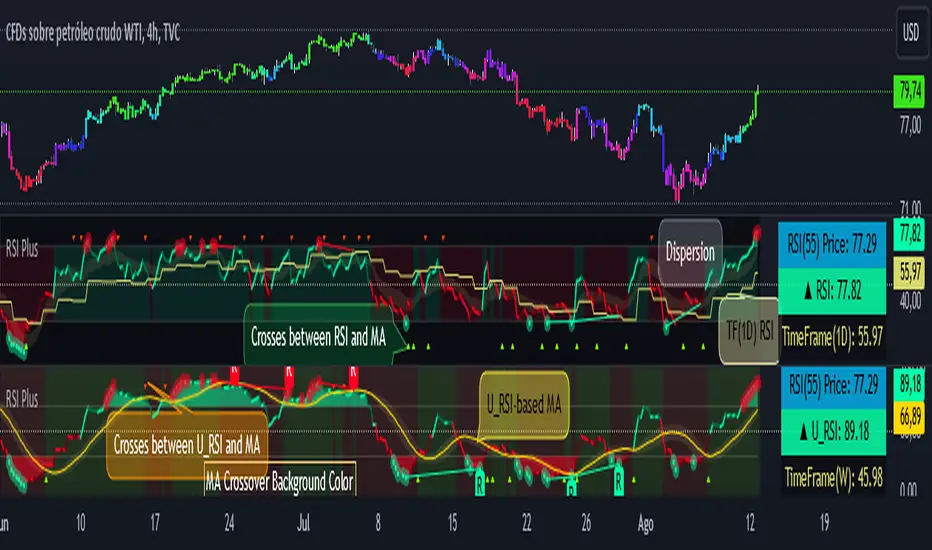
RSI PlusRSI Plus:
☑️ Show the divergences.
☑️ Shows the approximate price of an RSI level (by default it is level 55 but it can be changed for any other level).
☑️ Shows the bulls and bears zones, in green when crossing level 50 up and red when crossing down.
☑️ Circle the highest and lowest levels as possible purchases and sales.
☑️ Includes a smoothed RSI.
RSI Plus:
☑️ Muestra las divergencias.
☑️ Muestra el precio aproximado de un nivel del RSI (por defecto viene el nivel 55 pero se lo puede cambiar por cualquier otro nivel).
☑️ Muestra la zonas de toros y osos, en verde cuando cruza hacia arriba el nivel 50 y rojo cuando cruza hacia abajo.
☑️ Marca con un circulo los niveles mas alto y mas bajos como posibles compras y ventas.
☑️ Incluye un RSI suavizado.
Griffin Money Flow IndexThis is a modification of the commonly used money flow index. The major change is to the way the average price is calculated. Typically this is done with a hlc3 method,
meaning the average of the period high, low, and closing prices. This calculation infers that volume is evenly distributed between those three points. Generally this is not the case.
My version calculates the average price by including the open price and making the assumption that the majority of the volume occurs within the body of the candle, between
the open and close. I calculate a weighted average that places more significance on the close and open, then an equal weighting on the high and low.
In general this will result in a trend that does not differ greatly from the regular MFI calculation however there may be subtle changes.

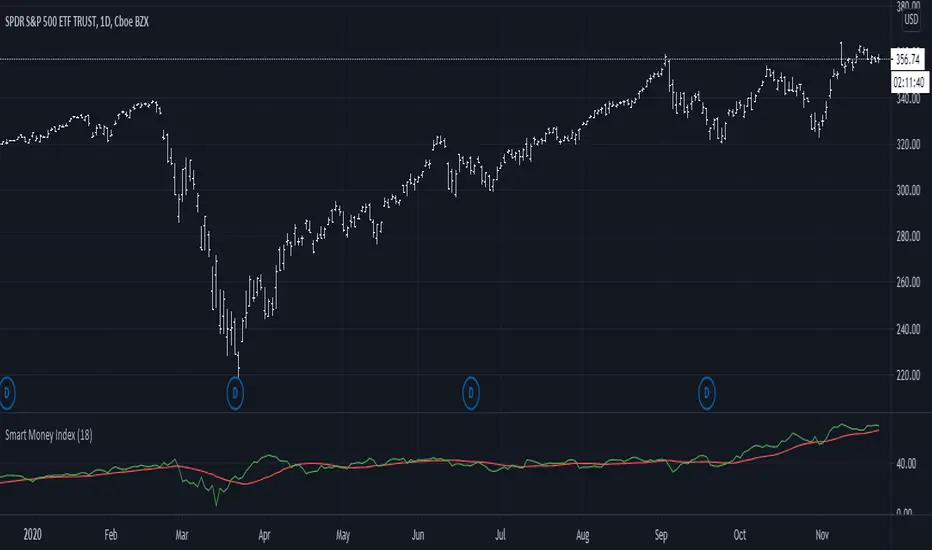
Smart Money Index (SMI)It came to my attention that one very common implementation of SMI was incorrect; rather than subtracting the first hour delta and adding the last hour delta it subtracts the whole day delta and adds the last 30m delta. While this indicator might have had some use, it is not what I understand to be the actual Smart Money Index and so I post this as a correction for use in other scripts.
MFI & EMA & Bollinger BandsIn this script
I combined the various of the oscillator
MFI ( Money Flow Index ) with BB ( Bollinger Bands ).
As the MFI crosses the BB base, a green / red point is formed accordingly.
As a sign it is possible to continue up / down.
I added EMA8 to MFI (style circles)
When the oscillator is above the EMA - it is possible that this is a clear sign of an increase.
Band 50 was also added to facilitate the calculations.

DAX Money FlowMoney Flow (MFL of MFI) indicator for the DAX index, which works on the hourly timeframe.
In order for this indicator to work for you, you must have access to the Xetra (XETR:DAX) tickers, where the underlying stocks of DAX are trading.
For some reason Xetra does NOT provide hourly volume so you can't see the money flow using the built-in TradingView indicator. But now, with this indicator, you can! :)

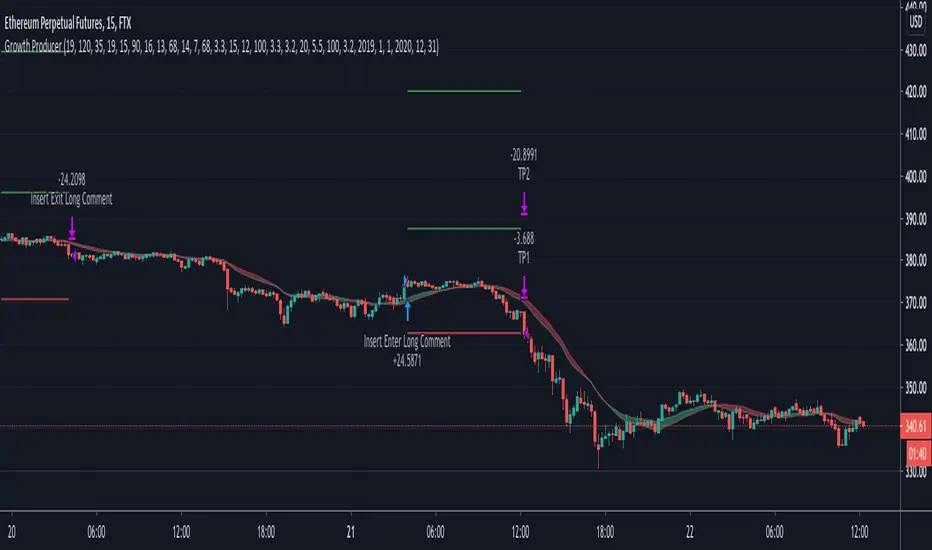
Growth Producer
Applicable to FTX:ETHPERP 15 min
Relative volatility index (RVI) that will determine the entry and exit points only when the volatility will start to increase and Money Flow index as an additional point for entry.
IMPORTANT
• Input Partial take profits in your Bot settings
• This is a trend strategy and works better in the trending market
• We added the trend identifier using the EMA and SMA interaction
• We added Take profit and stop loss levels
• We added inputs for the period selection, so you could see how the strategy is performing on a monthly basis.
• RVI for the entry conditions
• MFI was added for the additional entries.
• Partial Take-profits
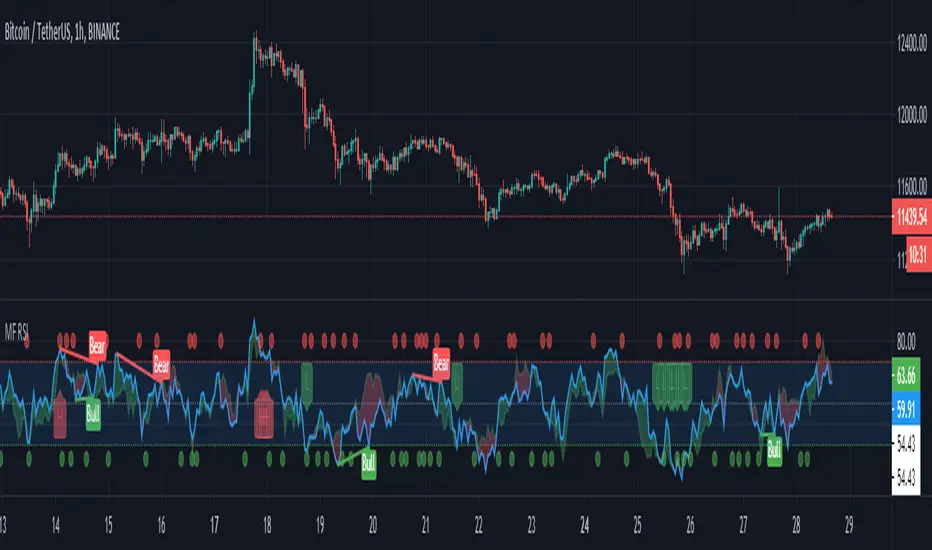
MF RSIUsing built-in code from Divergence Indicator I've created the MF RSI indicator.
A great way to combine two great indicators and divergence.
A alert condition is available on a potential reversal MFI crosses RSI on overbought or oversold.
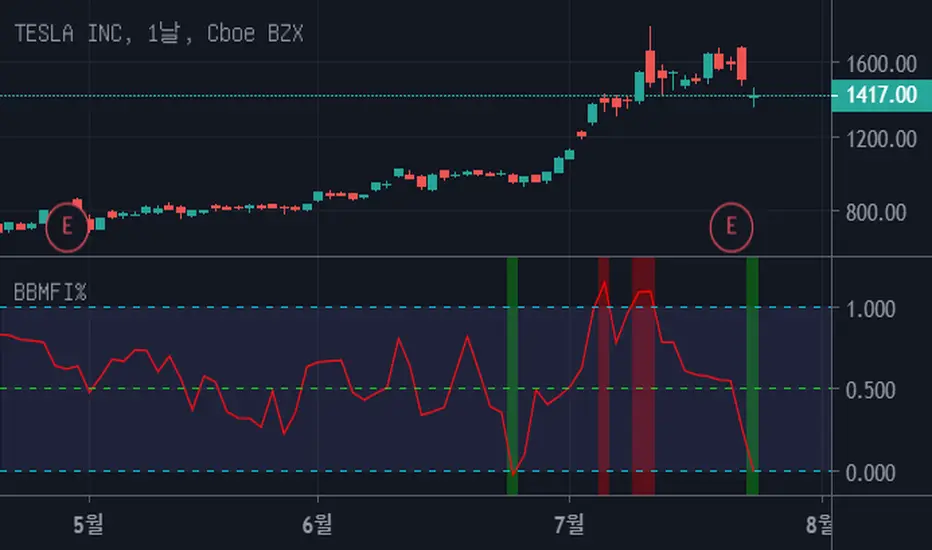
Bollinger Bands Money Flow Index %This script is similar to the previous one "Bollinger Bands Money Flow Index" but it's a little easier to interpret.
Fix the top line of the "BBMFI" to 1, and the bottom line to 0.
Indicates where "Money Flow Index" is located between the top and bottom lines.
If it's bigger than 1, it's overbuying. If it's less than 0, it's overselling.
Consider a trade if you are out of range from 0 to 1.
It's also a good trade timing to out of range and come back in.
Bollinger Bands Money Flow IndexThis script embodies the application of the Bollinger Band and Money Flow Index in John A. Bollinger's book "Bollinger on Bollinger Bands."
"Bollinger on Bollinger Bands" suggests a relatively method of analysis by applying the Bollinger Band to an indicator.
Here's one of the indicators, Money Flow Index.
Money Flow Index is an indicator of overbuying and overselling by reflecting the volume of transactions.
"Bollinger on Bollinger Bands" suggests using the Bollinger Band to create relative top and bottom lines for various indicators, such as Money Flow Index.
Original Money Flow Index is considered to be over-purchased if it is more than 80% and over-selling if it is less than 20%.
But if you put a bolinger band on it, you can set the standard for higher or lower over-selling and over-selling in a sustained bullish, bearish market.
This script uses the following values as the default values as recommended by "Bollinger on Bollinger Bands".
Money Flow Index for 10 days.
a bollinger band of forty days
standard deviation of 2
The above values are suitable for most stocks and markets, but sometimes there is too much or too little data inside the Bollinger Band.
It is recommended to modify each value little by little to adjust 85% to 90% of the total data to fit inside the Bollinger Band.
If the value is higher than the top line, it is considered over-purchased, and a red background color appears.
If the bottom line is crossed down, it is considered over-sold and the green background color appears.

RedK_AvgMoneyFlow Oscillator v1This is a compact & simple study that tracks the short-term average price change and the (average) volume associated with it, to generate a very clear signal when a change of buying/selling flow is detected. these buy/sell cycles can happen within a longer "demand / trend-up" or "supply / trend down" phases as we know.
this concept is a bit different from MFI or CMF. The math we use here is simpler, and more "relative" and short-term focused, deliberately.
how does it work
===============
once the average price change and the average volumes are calculated for the specified length, we then turn that into a +100/-100 oscillator format - using the stoch() function - which helps to generate a clearly identifiable unambiguous signal (crossing the zero line up or down) that help traders (mainly with entries)
-- the stoch() function also makes the oscillator "relative" to the specified period length, meaning, we can be in a uptrend (demand mode) and the MFO is showing flow "out" (negative) - that's specific to the short-term period - and that's exactly what i was trying to see
- the thinking here is that the best spot to go long is when the existing selling has been depleted and no more supply exists (during an uptrend), and vice verca.
- other stuff: i use WMA() throughout the script -- and we apply a smoothing for the final plot. keep smoothing to a minimum to avoid unnecessary lag in the signals
- the signal should be considered *after* a bar is fully closed.
Suggested Use
==============
i suggest you use this in combination with other indicators that can show the overall short-term and long-term bias (for example, i use the Ribbon here for that) - and take only entry signals in the same direction - a signal to go long, for example, would be when the bias / trend is up *and* the MFO crosses the zero line *going up* .. you may need to wait for that setup to show before you hit the trigger.
another benefit here, is that MFO will also detect strengths and weaknesses - when we see diversion with price movement. this shows couple of times in the example below
Please Note
============
i do not do short-term trading / scalping - those who do, i hope may find this useful - if you decide to use it and you do find it useful, please post feedback here for the common learning
Good luck!

CCU MFI + RSI + STOCH RSIThis demonstrates the accuracy of entry signal of the MFI + RSI + STOCH RSI strategy

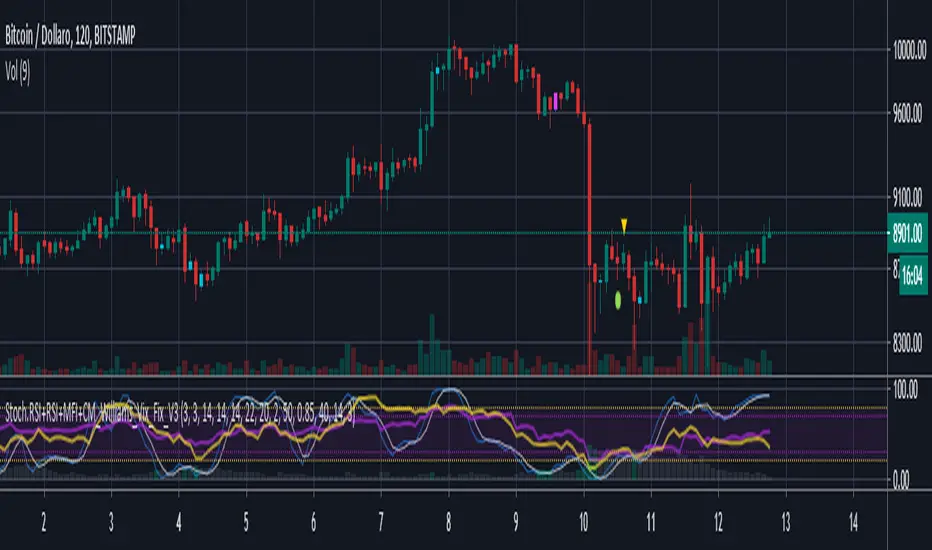
Stoch.RSI+RSI+MFI+CM_Williams_Vix_Fix_V3An update of my previous code "Stoch.RSI+RSI+DoubleStrategy+CMWilliamsVixFix+MFI".
Updates:
- Script converted to v4 and to study version
- Removed the "Double strategy" code because it doesn't work much well
- Replaced the "CM_Williams_Vix_Fix" (by ChrisMoody) code with its updated version "CM_Williams_Vix_Fix_V3" that also features custom filtered alerts directly onto candlesticks (don't forget to check its author's profile)
- Other minor graphical adjustments
UVOL DVOL Strength and Stagnant HistogramI liked the style of one of Noldo's scripts pertaining to Put/Call ratio so I adapted my existing UVol / DVol ratio script using his code from
I am also reducing the number of securities referenced to only Nasdaq which speeds up displaying
The yellow bars are meant to represent stagnant volume, with green / red representing strong up or down volume.
Note the indicator will display the same no matter which individual stock you are watching since it uses UVol and DVol from the whole Nasdaq exchange NOT the stock or security you are currently viewing.

Bulls vs BearsThe script measures relative strenth of bull bars vs bear bars that complete the next rules:
1) rising price with rising volume calculates as bullish only if the next candle is higher
2) falling price with falling volume calculates as bullish only if the next candle is higher
3) rising price with falling volume calculates as bearish only if the next candle is lower
4) falling price with rising volume calculates as bearish only if the next candle is lower
examples
ethusdt
shitperp
bsvusdt
btcusdt

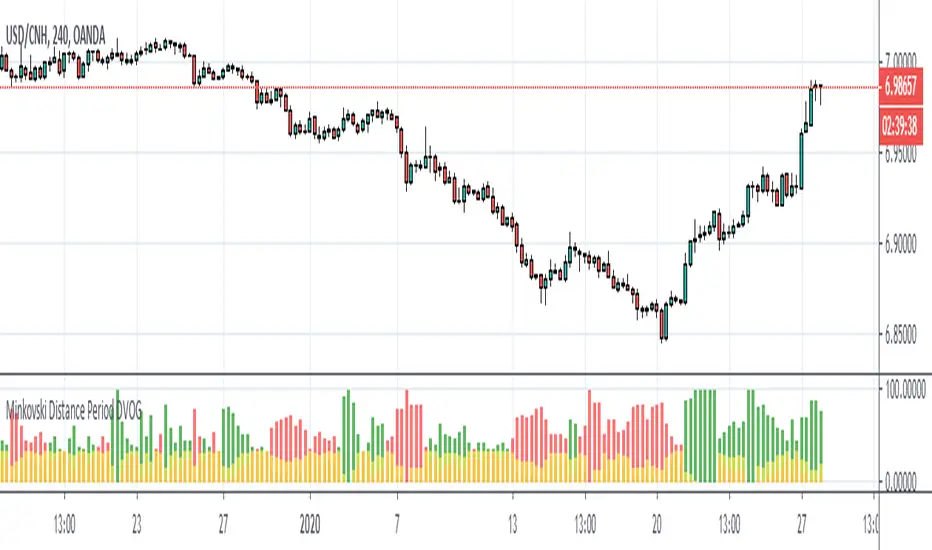
Minkovski Distance Period DVOGThis script was created by building my Dependent Variable Odd Generator script on the Minkovski Distance Adaptive Period.
I have tried this on MACD before.
Script related to MACD :
I used an older version that does not use Dow Factor to suit multi timeframe analysis.
In this way, market situations provide the opportunity to see histograms in an adaptive period as a Multi Timeframe.
Minkowski Distance Function Original Script by RicardoSantos :
Regards.
MFI - Money Flow Index [UTS]Money Flow Index (MFI) is the technical indicator, which indicates the rate at which money is invested into a security and then withdrawn from it.
Construction and interpretation of the indicator is similar to Relative Strength Index with the only difference that volume is important to MFI.
Usage:
When analyzing the money flow index one needs to take into consideration the following points:
divergences between the indicator and price movement. If prices grow while MFI falls (or vice versa), there is a great probability of a price turn;
Money Flow Index value, which is over 80 or under 20, signals correspondingly of a potential peak or bottom of the market.
Common known variants of this type of indicator are the On Balance Volume, Chaikin Oscillator or Chaikin Money Flow.
Based on www.metatrader5.com

Open Interest Stochastic Money Flow IndexThis is the improved version of Stochastic Money Flow Index script that uses Open Interest instead of volume in Future markets.
I think it will make a difference especially in Future and CFD markets.
Since the system will pull data from Quandl, CFTC reports may cause repaint when disclosed.
So if you use it during the weekly time frame (1W), it will definitely not repaint.
You can also use the volume by selecting "Others" from the menu.This option applies to each instrument, you can use it on any financial instrument with or without COT data.
Bitcoin is included in the "Futures" option.
In Futures, you can observe the difference of Open Interest's success by comparing, since it counts exchanges between the two parties singularly, it reacts more firmly to speculative movements.
This script also includes alerts and bar color options, you can use from the menu.
It is also suitable for mutable variables.This script was freed from the integer loads.You can modify it in any adaptive or fractional period.
I hope it will help your analyzes, regards .

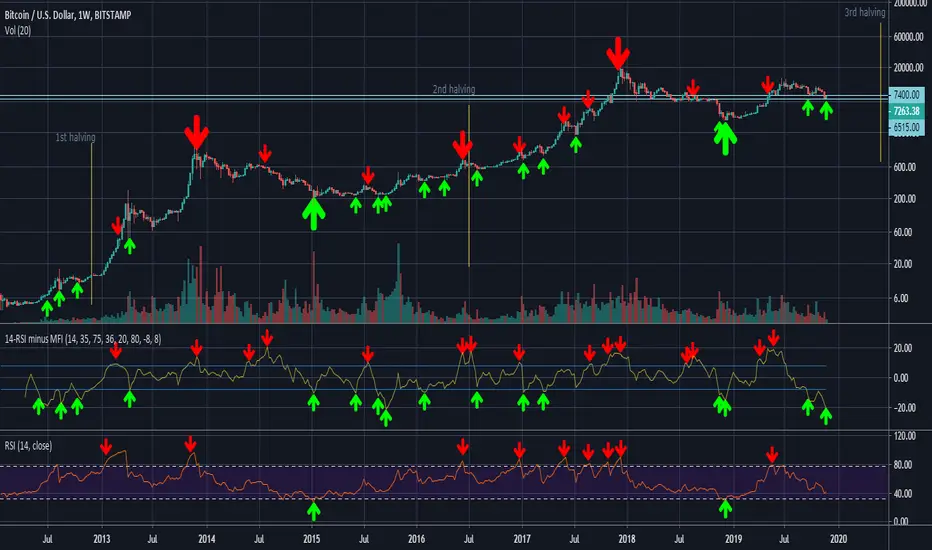
14-RSI minus 36-MFI (weekly)On the weekly chart of BTC/USD, the difference between the 14-RSI and the 36-MFI, combined with the 14-RSI alone, gives good buy and sell signals.