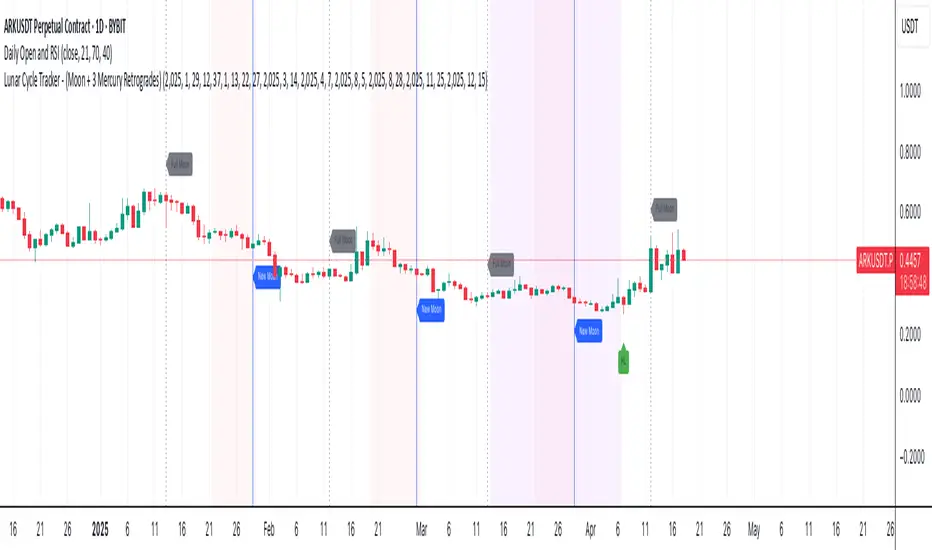
Lunar Cycle Tracker - (Moon + 3 Mercury Retrogrades)This script overlays the lunar and Mercury retrograde cycles directly onto your chart, helping traders visualize natural timing intervals that may influence market behavior.
Key Features:
🌑 New Moon & Full Moon Markers:
Vertical lines and labels indicate new and full moon events each month. You can fully customize their colors.
🌗 Last Quarter Moon Fill:
A soft pink background highlights the last quarter moon phase (from 7.4 days after the full moon to the next new moon).
🪐 Three Mercury Retrograde Zones:
Highlight up to three retrograde periods per year with customizable date inputs and background color. Great for spotting potential reversal or volatility windows.
Customization:
Moon event dates and colors
Manual input for Mercury retrograde periods (year, month, day)
Full compatibility with all timeframes (1H, 4H, daily, etc.)
Great for astro-cycle traders, Gann-based analysts, or anyone who respects time symmetry in the markets.
Fully customizable & works across all timeframes.
This tool was created by AngelArt as part of a larger astro-market model using lunar timing and planetary retrogrades for cycle-based market analysis.
Fasi Lunari
Lunar Cycles Projected Forward; Moon phases into futureProjecting Lunar Cycles/ half-cycles forward in time
User sets the recent Full moon in history to anchor from; Indicator projects 1/2 cycles forward in time
//inputs//
-input number of full lunar cycles to project forward from input full moon time
-choose color/opacity/border color/text display

RoboDCARoboDCA is an indicator I developed to help me accrue Bitcoin at its low point. It won't necessarily be at its lowest point but it's low enough that if you dollar cost average for the long term, the difference is negligible. While using this indicator, I find it also suitable for swing trades in the 4H timeframe every once in a while. Might be the indicator to use if you only do 2-5 trades a month last a few days between trades.
The fundamentals of RoboDCA came from these 2 theories:
Bill Williams Balance Line
Moon Phase
Bill Williams Balance Line
Bill Williams is fantastic, a lot of how I see the chart borrows from his books. For this particular case, his balance line is interesting to me because it's a series of highs and lows that are when broken through inspires a powerful move.
Moon Phase
Every month for as long as the moon and earth have danced in the cosmos, the moons gravity affects the earth physically. Some myth and legends like werewolves even came from this cosmic relationship. For prices though it paints a more honest relationship I would say. It is mostly accurate more than 50% of the time that when the moon's light intensity hits 90% or above, its gravity pulls prices to its lower if not lowest point for about 15 days in the past and 15 days in the future. While a new moon with its light intensity at the lowest would present a local peak.
I wasn't sure about this the first time but charts don't lie, they can't. For dollar cost average purposes, this is one of the best way of not just buying blindly into the market.
RoboDCA
Based on the 2 fundamentals above, I tried to create an indicator to help me see price movements and its direction more honestly. What I can say is this indicator tries to tell you if prices are in a good position to buy.
Numbers have always been interesting for me and while developing this indicator I came across an interesting one, number 528 . The number is supposedly an angelic number that communicates wealth and prosperity, sound like my kind of number. I thought to myself, the simplest prove is to just put the number to a moving average indicator. I opted for EMA to keep it close to prices compared to regular MA and I was pleasantly surprised.
As you can see, the EMA line acts as a perfect support and resistance. Breaking up or down the line would start a powerful move to the direction it was breaking at while touching the line through wicks held as strong support and resistance.
The problem I don't enjoy with moving averages is it's hard to measure zones, you'd need to zoom in into the candles to define the zones manually. I wanted something that would define the zones on screen without my intervention. This brought me back to Bill Williams Balance Line, they have highs and lows. The next step was to put the high/low from the balance line and EMA both lines creating a zone.
The zone created fits perfectly to my needs. Now I can see powerful moves before it happens. When a zone has been tested 2 or 3 times, the chances of prices making powerful moves is humongous. This is a zone that is derived from exponential moving averages of the last 528 high and low balance lines, this in itself is a strong indication for direction.
Let's couple the zone with moon phases like what the chart below illustrates.
In this daily chart, the blue upwards arrow represent an opportunity to buy while the red downward arrows represent an opportunity to sell based on Moon Phases. For dollar cost average, you can see that blue arrows that showed up near to the balance line ribbon represent a perfect buy entry, conviction to buy is as strong as it can be.
Although both Moon Phases and the zone should be enough to know when to buy, it doesn't tell a story of how the upcoming move came to be. Someone told me about another angelic number, this time it's number 247 . Let's how this stack up when put both EMA528 and EMA247 together.
It's a sight to behold.
When prices are moving back and forth between the both EMAs, it's telling you that a powerful move is soon coming. Most traders would also know the meaning of crossovers between a slower MA versus a faster MA or the other way around.
Conclusion
This indicator is written to help me dollar cost average, I hope the explanation above is enough to describe to you how to use the indicator opportunistically. I regret that for this indicator I decided to not share its source code. The logic for this indicator is described above which I'm sure can be a base for anyone to write their own version of it.
Above said, I wish everyone a 528 vibe of wealth and prosperity. Cheers!

The Moon█ OVERVIEW
The Moon is a script that is designed to help Traders analyse their charts using the moon. This script consists of three main features :
1. Moon Phases Pro : This is a more powerful version of the default built-in Moon Phases where it would plot both past cycles and Future cycles with a better accuracy.
2. Moon Lines : This plots the moon's longitude into price. you can also select your desired $/degree ( price vs time unit) to make these lines better suited for your chart and the asset your playing with. We also didn't forget to add an option to enable harmonics of these lines. In addition, you can select "reverse" to get the downtrending plants as well.
3. Moon Angles : This allows you to highlight areas where the moon is at X degree. you can get the Moon at zero aris or 180 degrees or any other degree!.
We also added some styling options to help with the visuals.
█ Future Plans and upgrades to this script may include :
1. Enhanced algorithm for a faster loading/processing script.
2. More future dates plotting.
And more! Feel free to contact me with any feature that you would like to see in this script
█ How to use :
1. Open the settings.
2. Enable your desired tool and adjust the settings.
Give the script a few seconds and you should be set. Don't enable more than 2 tools at the same time, but if you want to do that, you can insert the same script twice or more in your chart.
This script is coded as an addon to the Gann ToolBox package/scripts.

[astropark] Moon Phases [alarms]Dear Followers,
today I'm glad to present you an indicator which calculates Moon Phases and let's you set an alert over it.
This is a public free indicator based on the public one by @paaax:
I added my usual alert system logic, plus some more customization inputs for easy coloring.
The lower the timeframe you use it and set your alerts on, the more precise the alert value you get.
Here below the script for backtesting it:
Enjoy!
-- astropark

Moon Phase This Script is calculating the Moon Phase IE full moon and new moon. In the past most of the time during these times the price action does a nice size move either up or down depending on the current trend that we are in. the New Moon and Full Moon are indicated by color and a moon printed on the chart.

Moon CyclesInformative Script for astrological seasonal changes
Equinoxes and Solstices
Full,New,Growing and waning lunar phases
Lunar Maturation counter
Trend coloring from one of my oscillators to give script something more than vanilla calculations and labels
Labels can be customized
Plotting set to absolute
First version is placeholder and will be updated with eclipse tracking,background coloration
Script is for seasonal and lunar study,Its not generating signals
The decay and lunar calculations borrowed from MQL

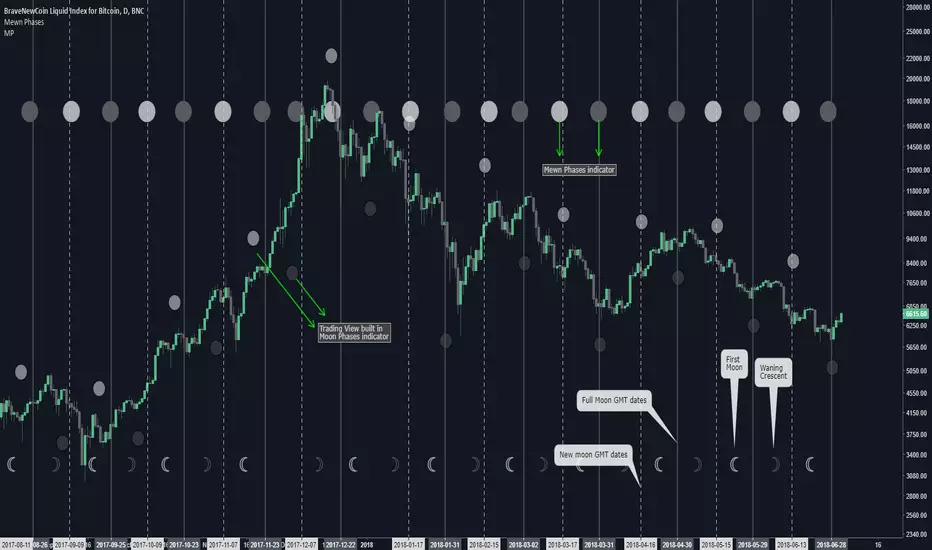
Mewn PhasesPhases of the moon, based on Julian date. Commissioned indicator. Option to highlight the background for the 4 other phases of the moon.
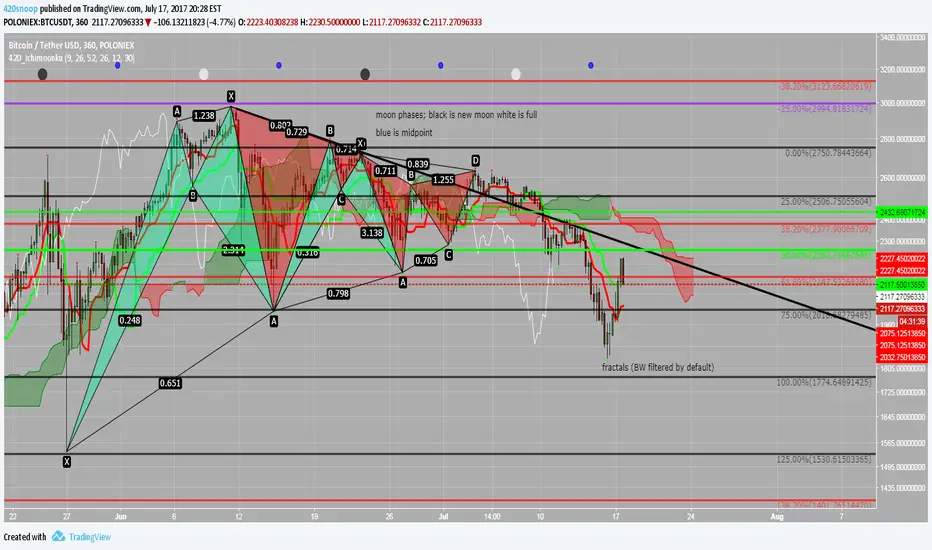
420_IchimoonkuSup all,
Snoop here with another script -- this time it is an ichimoku-type script. The ichimoku system is very powerful and the base script I have chosen to work from is the work of BrainZZ and Chris Moody; I added some alerts based on their signals and recolored to my liking. I suggest using the 'alert once per bar (on close)' if utilizing the alerts for TS crossing KS or the KS slope direction.
This script is great because it includes a moonphase indicator as well. This moonphase indicator was the work of Glaz and I appreciate the work he did on the base script which I have further modified and incorporated into this indicator. New moons are black, full moons are white, and the Q1 and Q3 are shown as blue.
The last thing in this script is the Williams Fractal and Higher High Higher Low fractal recognition. This is the work of JustUncleL and I appreciate the work he has done.
I hope everyone can get some good useage out of this it is packed full of some very powerful tools; feel free to PM me if you need resources on the ichimoku system or check out the education section of ichimoku_trader's posts.
As always good luck and happy trading!
xoxo
-- Snoop