Moving average cloud strategyHi folks!
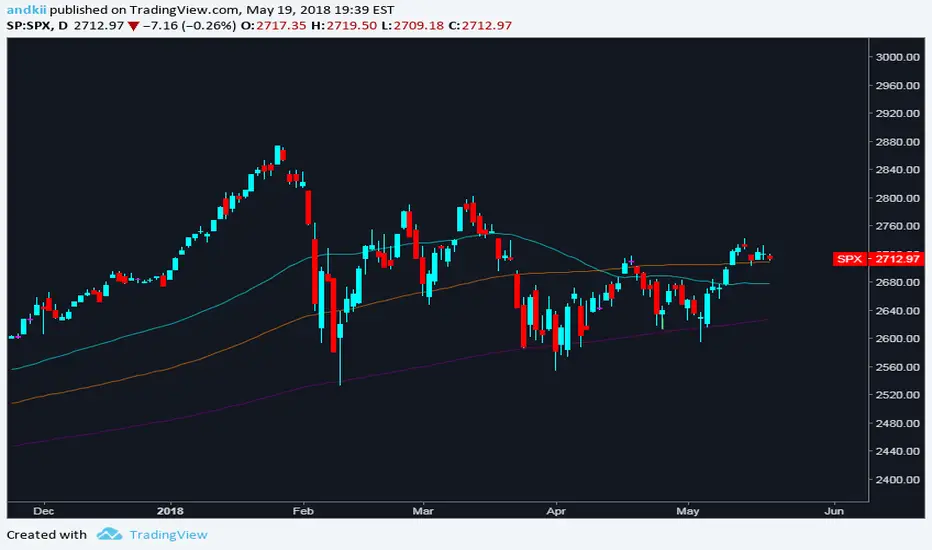
Here a script uses the moving average cloud. A sma (50, aqua) and a sma (200, olive) are plotted on the cart. When both sma go up the cloud is green. When both sma go down the cloud is red. When sma (200, olive) goes down and sma (50, aqua) goes up the cloud is orange. When sma (200, olive) goes up and sma (50, aqua) goes down the cloud is lime.
There three entry points in this strategy.
Long
Aggressive: When the cloud turns orange and price closes above the sma (200).
Neutral: When the both sma make the golden cross.
Cautious: When the cloud is green and price closes sma (200) after searching for support. So not when there's a great distance between them.
In case you missed the entry point you can jump in when price CLOSES above sma (50). So after it searched for support on that line. The cloud has to be green at that moment.
Short
Aggressive: When the cloud turns lime and price CLOSES below the sma (200).
Neutral: When the both sma make the death cross.
Cautious: When the cloud is green and price is above the sma (200).
In case you missed the entry point you can jump in when price CLOSES above sma (50). So after it searched for support on that line.
There are also two exit points in this strategy.
Cautious: When price closes on the other side of the sma (50).
Neutral: When the cloud changes color.
Aggressive: When price closes on the other side of the sma (200). There's always the opportunity that the price searches for support at the sma (200) line and goes from that moment in the direction you want.
Don't wait for the cross of the both sma. Very usually you give a huge part of your profit away at that point.
Remember: Above the cloud is bullish area, never go short there. Below the cloud is bearish area, never go long there.
Remember 2: When the clouds changes rapidly from color we're not in a trend. The sma (200) will be almost flat at those situations. It's a sign not to go into a trade since the market doesn't know in which direction it will go.
Moving

Leeloo Triple Simple Moving AverageAllows you to have three simple moving averages in one indicator.


6 SMA's (fit to BTC) 9,20,30,50,128,200 (exponential optional)I've been using these for a while trading Bitcoin and I've found them to be the most useful to me. I replaced the 7 you may have seen in the first set with the 9 as I'm seeing it tested across many time frames quite frequently. The least used of the six is the 30 period, but it does have some influence I've found on the large time frames, mainly the weekly.

ALL Philakone's EMA's (8,13,21,55,100, 200)These are Philakone's EMA's. I added the 100 day in there as I didn't see that anyone had done that.
The 100 might be the same color as the 200 looking at the code, I changed it on my chart, but just make sure you check the colors.


InItForTheGame Moving AveragesThis indicator was made to allow four moving averages to be displayed without needing to use up 3 charting indicators individually

Secp's DMA ScriptUses SMA10 and SMA20 with HA color changes to make calls.
Fairly simple to understand. Please comment if you have questions. The source will not be shared but you can use the script.

Absolute Time 1H, 4H, 1D Moving Average, 절대 시간에 대한 MAAbsolute Time 1H, 4H, 1D Moving Average, 절대 시간에 대한 MA

crashm111 3-200 Moving Average RibbonAll the moving averages bewteen 3 and 200 in increments of 5.
with the ability to change colours
and change between simple and exponential.
It provides an easy and fast way to determine the trend direction and possible reversals.

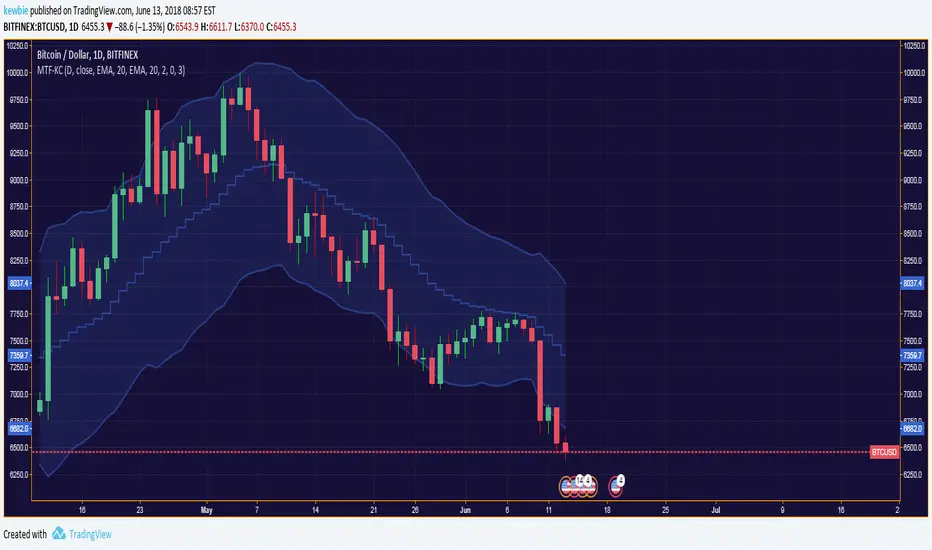
Multiple-Timeframe Keltner ChannelKeltner Channels are volatility-based envelopes set above and below a moving average first devised by Chester W. Keltner then later revised by Linda Bradford Raschke.
This script allows for the overlay of the Keltner Channel across multiple-timeframes.
Additionally allows for the selection of the true range average type with a user defined lookback period.
Default settings is the traditional type of KC seen on TV.
Note: When inputting the MA-Basis strings it is case sensitive; enter only lowercase or all uppercase. If a typo is made it will by default revert to an EMA base.
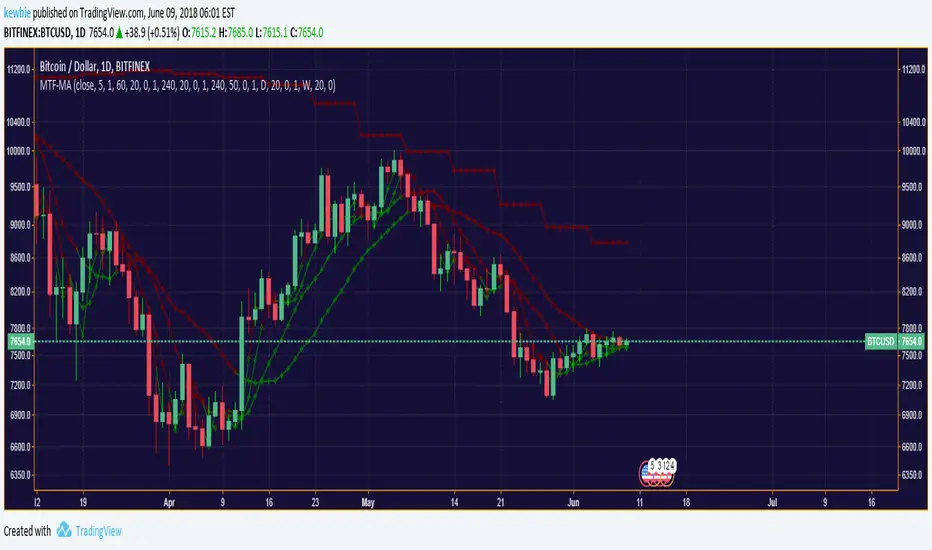
Multiple Timeframe Moving Average SystemModified code from ChrisMoody, RicardoSantos & Ricardo M Arjona.
Allows for multiple moving average types across custom time-frames.
Simple Moving Averages (7, 30, 50, 100, 200)7, 30, 50, 100, 200 simple moving averages, bundled in one indicator (for users who are using the free TradingView service and can only load limited number of indicators at any given time).
You can turn each moving average on or off at will and change the colors.

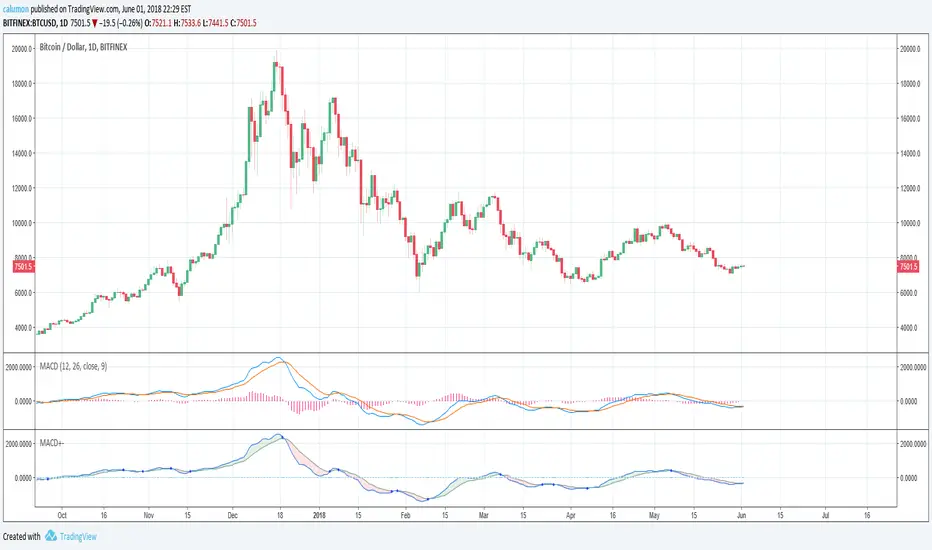
MACD with highlighted positive and negative trendThe values used by this indicator are equal to MACD 12 26 9 (and Signal). Only changes are made to looks:
If MACD closes higher than Signal, then we are seeing green. Else, we are seeing red.
Another point is that we get a blue circle when there is a trend change from bullish to bearish or vice versa. Please note that there needs to be an offset for this. We will only see the circle, when there already WAS (instead of is) a trend change.
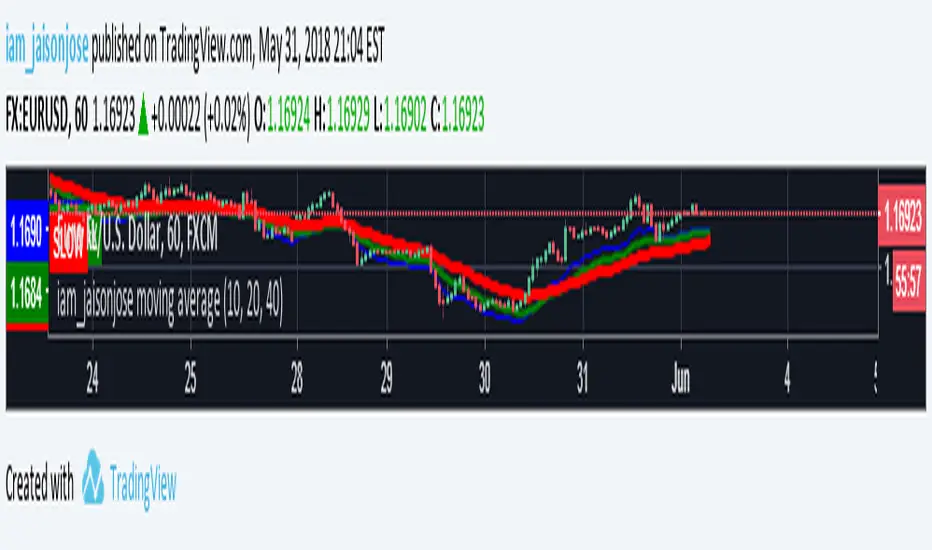
iam_jaisonjose 3 Moving Average (Exponential)This Indicator is a combination of 10, 20 & 40 EMA, which is very useful for determining the current trend.
SMA/EMA 12|26|50SMA/EMA 12|26|50
Exactly as title says
SMA is bold
EMA is light
Orange 12
Green 26
Blue 50


Moving Averages 20,50,128,200 (Exponential optional)4 moving averages in one indicator...
I found the 128 (over the 100) to be more in tune with the BTCUSD Bitfinex chart and more in tune with crypto in general...
With this indicator the stock setting is for Simple Moving Averages and if you want to use Exponential just check the box in the settings

Moving Averags Bundle (EMA/SMA)//@v3 Moving Averages Bundle (EMA/SMA)
//By Tantamount
//Save your TV indicator use count. Toggle between Exponential or Simple moving averages.
//Customize your own MA's by changing the input options from default: SMA (20, 50, 100, 200) or EMA (8, 13, 21, 55)

Simple Moving Average's Bundle//@v2 Simple Moving Averages Bundle
//Choose from the Buffet (20, 50, 100, 200), save your TV indicator use count. Customize periods and or toggle On/Off which SMA's you require.

EMA Enhanced11 Exponential moving averages all in one script. Based on SMA 3-987 script from traderUS180

