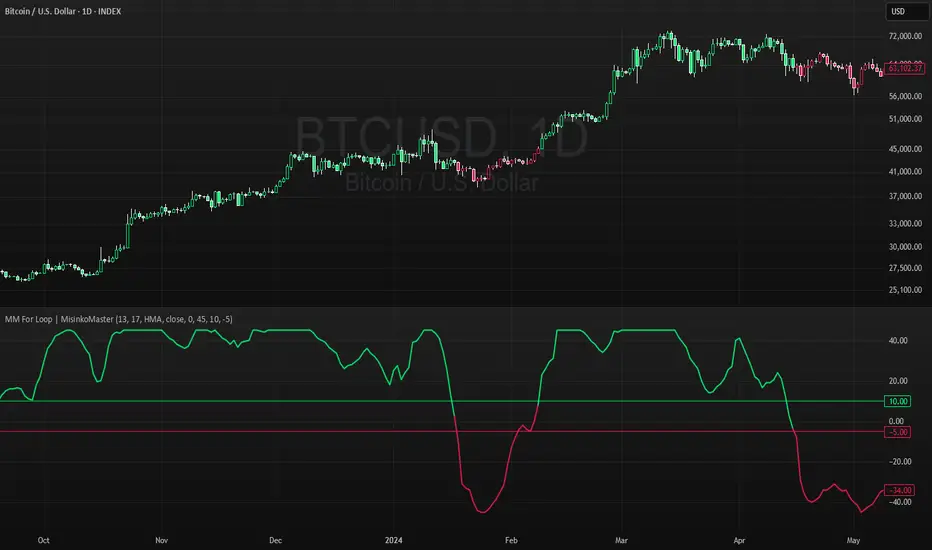
MA-Median For Loop | MisinkoMasterThe MA-Median For Loop is a new Trend Following tool that gives the user smooth yet responsive trend signals, allowing you to see clear and accurate trends by combining the Moving Average & Median in a For Loop concept.
How does it work?
1. Select user defined inputs
=> Adjust it to your liking, everyone can set it to their liking.
2. Calculate the MA and the Median
=> Simple, but important
3. Calculate the For Loop
=> For every bar back where the median or ma of that bar is higher than the current median or ma subtract 0.5 from the trend score, and for every bar back where the current median/ma is higher than the previous one add 0.5 to the trend score.
This simple yet effective approach enhances speed, decreases noise, and produces accurate signals everyone can utilize to get an edge in the market
Enjoy G´s
Medie mobili
EMA MACD - 5-20Based on Crossover and Big timeframe EMA Support and resistance this strategy is developed.

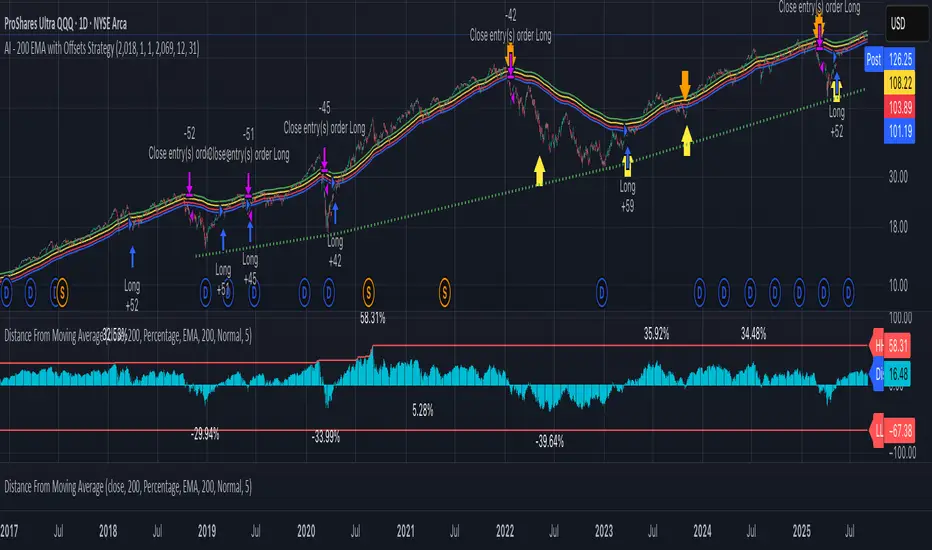
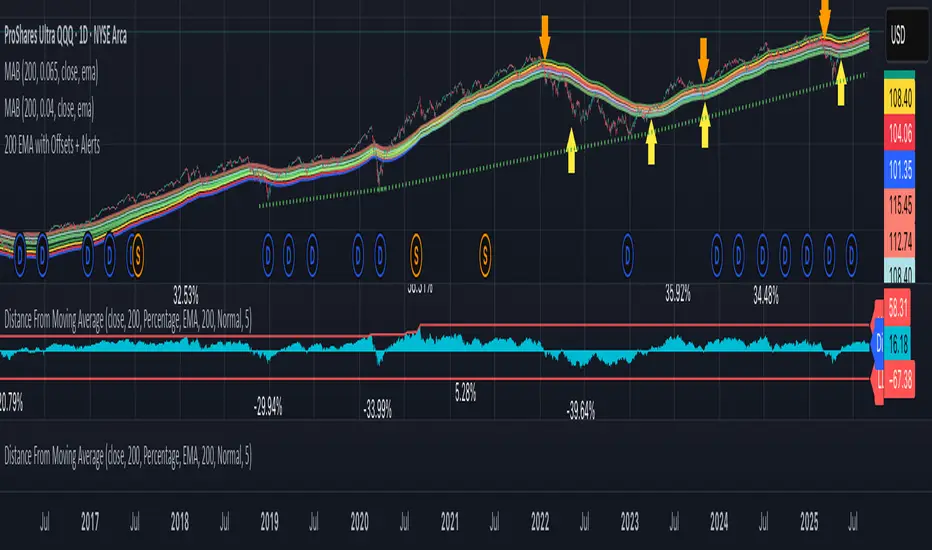
AI - 200 EMA with Offsets StrategyLong when close price crosses above +4% offset 200 day EMA
Sell when close price crosses below -6.5% offset 200 day EMA
EMA20 Cross Strategy with countertrades and signalsEMA20 Cross Strategy Documentation
Overview
The EMA20 Cross Strategy with Counter-Trades and Instant Signals is a Pine Script (version 6) trading strategy designed for the TradingView platform. It implements an Exponential Moving Average (EMA) crossover system to generate buy and sell signals, with optional trend filtering, session-based trading, instant signal processing, and visual/statistical feedback. The strategy supports counter-trades (closing opposing positions before entering new ones) and operates with a fixed trade size in EUR.
Features
EMA Crossover Mechanism:
Uses a short-term EMA (configurable length, default: 1) and a long-term EMA (default: 20) to detect crossovers.
A buy signal is generated when the short EMA crosses above the long EMA.
A sell signal is generated when the short EMA crosses below the long EMA.
Instant Signals:
If enabled (useInstantSignals), signals are based on the current price crossing the short EMA, rather than waiting for the candle close.
This allows faster trade execution but may increase sensitivity to price fluctuations.
Trend Filter:
Optionally filters trades based on the trend direction (useTrendFilter).
Long trades are allowed only when the short EMA (or price, for instant signals) is above the long EMA.
Short trades are allowed only when the short EMA (or price) is below the long EMA.
Session Filter:
Restricts trading to specific market hours (sessionStart, default: 09:00–17:00) if enabled (useSessionFilter).
Ensures trades occur only during active market sessions, reducing exposure to low-liquidity periods.
Customizable Timeframe:
The EMA calculations can use a higher timeframe (e.g., 5m, 15m, 1H, 4H, 1D, default: 1H) via request.security.
This allows the strategy to base signals on longer-term trends while operating on a shorter-term chart.
Trade Management:
Fixed trade size of €100,000 per trade (tradeAmount), with a maximum quantity cap (maxQty = 10,000) to prevent oversized trades.
Counter-trades: Closes short positions before entering a long position and vice versa.
Trades are executed with a minimum quantity of 1 to ensure valid orders.
Visualization:
EMA Lines: The short EMA is colored based on the last signal (green for buy, red for sell, gray for neutral), and the long EMA is orange.
Signal Markers: Displays buy/sell signals as arrows (triangles) above/below candles if enabled (showSignalShapes).
Background/Candle Coloring: Optionally colors the chart background or candles green (bullish) or red (bearish) based on the trend (useColoredBars).
Statistics Display:
If enabled (useStats), a label on the chart shows:
Total closed trades
Open trades
Win rate (%)
Number of winning/losing trades
Profit factor (gross profit / gross loss)
Net profit
Maximum drawdown
Configuration Inputs
EMA Short Length (emaLength): Length of the short-term EMA (default: 1).
Trend EMA Length (trendLength): Length of the long-term EMA (default: 20).
Enable Trend Filter (useTrendFilter): Toggles trend-based filtering (default: true).
Color Candles (useColoredBars): Colors candles instead of the background (default: true).
Enable Session Filter (useSessionFilter): Restricts trading to specified hours (default: false).
Trading Session (sessionStart): Defines trading hours (default: 09:00–17:00).
Show Statistics (useStats): Displays performance stats on the chart (default: true).
Show Signal Arrows (showSignalShapes): Displays buy/sell signals as arrows (default: true).
Use Instant Signals (useInstantSignals): Generates signals based on live price action (default: false).
EMA Timeframe (emaTimeframe): Timeframe for EMA calculations (options: 5m, 15m, 1H, 4H, 1D; default: 1H).
Strategy Logic
Signal Generation:
Standard Mode: Signals are based on EMA crossovers (short EMA crossing long EMA) at candle close.
Instant Mode: Signals are based on the current price crossing the short EMA, enabling faster reactions.
Trade Execution:
On a buy signal, closes any short position and opens a long position.
On a sell signal, closes any long position and opens a short position.
Position size is calculated as the minimum of €100,000 or available equity, divided by the current price, capped at 10,000 units.
Filters:
Trend Filter: Ensures trades align with the trend direction (if enabled).
Session Filter: Restricts trades to user-defined market hours (if enabled).
Visual Feedback
EMA Lines: Provide a clear view of the short and long EMAs, with the short EMA’s color reflecting the latest signal.
Signal Arrows: Large green triangles (buy) below candles or red triangles (sell) above candles for easy signal identification.
Chart Coloring: Highlights bullish (green) or bearish (red) trends via background or candle colors.
Statistics Label: Displays key performance metrics in a label above the chart for quick reference.
Usage Notes
Initial Capital: €100,000 (configurable via initial_capital).
Currency: EUR (set via currency).
Order Processing: Orders are processed at candle close (process_orders_on_close=true) unless instant signals are enabled.
Dynamic Requests: Allows dynamic timeframe adjustments for EMA calculations (dynamic_requests=true).
Platform: Designed for TradingView, compatible with any market supported by the platform (e.g., stocks, forex, crypto).
Example Use Case
Scenario: Trading on a 5-minute chart with a 1-hour EMA timeframe, trend filter enabled, and session filter set to 09:00–17:00.
Behavior: The strategy will:
Calculate EMAs on the 1-hour timeframe.
Generate buy signals when the short EMA crosses above the long EMA (and price is above the long EMA).
Generate sell signals when the short EMA crosses below the long EMA (and price is below the long EMA).
Execute trades only during 09:00–17:00.
Display green/red candles and performance stats on the chart.
Limitations
Instant Signals: May lead to more frequent signals, increasing the risk of false positives in volatile markets.
Fixed Trade Size: Does not adjust dynamically based on market conditions beyond equity and max quantity limits.
Session Filter: Simplified and may not account for complex session rules or holidays.
Statistics: Displayed on-chart, which may clutter the view in smaller charts.
Customization
Adjust emaLength and trendLength to suit different market conditions (e.g., shorter for scalping, longer for swing trading).
Toggle useInstantSignals for faster or more stable signal generation.
Modify sessionStart to align with specific market hours.
Disable useStats or showSignalShapes for a cleaner chart.
This strategy is versatile for both manual and automated trading, offering flexibility for various markets and trading styles while providing clear visual and statistical feedback.

Optimized ADX DI CCI Strategy### Key Features:
- Combines ADX, DI+/-, CCI, and RSI for signal generation.
- Supports customizable timeframes for indicators.
- Offers multiple exit conditions (Moving Average cross, ADX change, performance-based stop-loss).
- Tracks and displays trade statistics (e.g., win rate, capital growth, profit factor).
- Visualizes trades with labels and optional background coloring.
- Allows countertrading (opening an opposite trade after closing one).
1. **Indicator Calculation**:
- **ADX and DI+/-**: Calculated using the `ta.dmi` function with user-defined lengths for DI and ADX smoothing.
- **CCI**: Computed using the `ta.cci` function with a configurable source (default: `hlc3`) and length.
- **RSI (optional)**: Calculated using the `ta.rsi` function to filter overbought/oversold conditions.
- **Moving Averages**: Used for CCI signal smoothing and trade exits, with support for SMA, EMA, SMMA (RMA), WMA, and VWMA.
2. **Signal Generation**:
- **Buy Signal**: Triggered when DI+ > DI- (or DI+ crosses over DI-), CCI > MA (or CCI crosses over MA), and optional ADX/RSI filters are satisfied.
- **Sell Signal**: Triggered when DI+ < DI- (or DI- crosses over DI+), CCI < MA (or CCI crosses under MA), and optional ADX/RSI filters are satisfied.
3. **Trade Execution**:
- **Entry**: Long or short trades are opened using `strategy.entry` when signals are detected, provided trading is allowed (`allow_long`/`allow_short`) and equity is positive.
- **Exit**: Trades can be closed based on:
- Opposite signal (if no other exit conditions are used).
- MA cross (price crossing below/above the exit MA for long/short trades).
- ADX percentage change exceeding a threshold.
- Performance-based stop-loss (trade loss exceeding a percentage).
- **Countertrading**: If enabled, closing a trade triggers an opposite trade (e.g., closing a long opens a short).
4. **Visualization**:
- Labels are plotted at trade entries/exits (e.g., "BUY," "SELL," arrows).
- Optional background coloring highlights open trades (green for long, red for short).
- A statistics table displays real-time metrics (e.g., capital, win rates).
5. **Trade Tracking**:
- Tracks the number of long/short trades, wins, and overall performance.
- Monitors equity to prevent trading if it falls to zero.
### 2.3 Key Components
- **Indicator Calculations**: Uses `request.security` to fetch indicator data for the specified timeframe.
- **MA Function**: A custom `ma_func` handles different MA types for CCI and exit conditions.
- **Signal Logic**: Combines crossover/under checks with recent bar windows for flexibility.
- **Exit Conditions**: Multiple configurable exit strategies for risk management.
- **Statistics Table**: Updates dynamically with trade and capital metrics.
## 3. Configuration Options
The script provides extensive customization through input parameters, grouped for clarity in the TradingView settings panel. Below is a detailed breakdown of each setting and its impact.
### 3.1 Strategy Settings (Global)
- **Initial Capital**: Default `10000`. Sets the starting capital for backtesting.
- **Effect**: Determines the base equity for calculating position sizes and performance metrics.
- **Default Quantity Type**: `strategy.percent_of_equity` (50% of equity).
- **Effect**: Controls the size of each trade as a percentage of available equity.
- **Pyramiding**: Default `2`. Allows up to 2 simultaneous trades in the same direction.
- **Effect**: Enables multiple entries if conditions are met, increasing exposure.
- **Commission**: 0.2% per trade.
- **Effect**: Simulates trading fees, reducing net profit in backtesting.
- **Margin**: 100% for long and short trades.
- **Effect**: Assumes no leverage; adjust for margin trading simulations.
- **Calc on Every Tick**: `true`.
- **Effect**: Ensures real-time signal updates for precise execution.
### 3.2 Indicator Settings
- **Indicator Timeframe** (`indicator_timeframe`):
- **Options**: `""` (chart timeframe), `1`, `5`, `15`, `30`, `60`, `240`, `D`, `W`.
- **Default**: `""` (uses chart timeframe).
- **Effect**: Determines the timeframe for ADX, DI, CCI, and RSI calculations. A higher timeframe reduces noise but may delay signals.
### 3.3 ADX & DI Settings
- **DI Length** (`adx_di_len`):
- **Default**: `30`.
- **Range**: Minimum `1`.
- **Effect**: Sets the period for calculating DI+ and DI-. Longer periods smooth trends but reduce sensitivity.
- **ADX Smoothing Length** (`adx_smooth_len`):
- **Default**: `14`.
- **Range**: Minimum `1`.
- **Effect**: Smooths the ADX calculation. Longer periods produce smoother ADX values.
- **Use ADX Filter** (`use_adx_filter`):
- **Default**: `false`.
- **Effect**: If `true`, requires ADX to exceed the threshold for signals to be valid, filtering out weak trends.
- **ADX Threshold** (`adx_threshold`):
- **Default**: `25`.
- **Range**: Minimum `0`.
- **Effect**: Sets the minimum ADX value for valid signals when the filter is enabled. Higher values restrict trades to stronger trends.
### 3.4 CCI Settings
- **CCI Length** (`cci_length`):
- **Default**: `20`.
- **Range**: Minimum `1`.
- **Effect**: Sets the period for CCI calculation. Longer periods reduce noise but may lag.
- **CCI Source** (`cci_src`):
- **Default**: `hlc3` (average of high, low, close).
- **Effect**: Defines the price data for CCI. `hlc3` is standard, but users can choose other sources (e.g., `close`).
- **CCI MA Type** (`ma_type`):
- **Options**: `SMA`, `EMA`, `SMMA (RMA)`, `WMA`, `VWMA`.
- **Default**: `SMA`.
- **Effect**: Determines the moving average type for CCI signal smoothing. EMA is more responsive; VWMA weights by volume.
- **CCI MA Length** (`ma_length`):
- **Default**: `14`.
- **Range**: Minimum `1`.
- **Effect**: Sets the period for the CCI MA. Longer periods smooth the MA but may delay signals.
### 3.5 RSI Filter Settings
- **Use RSI Filter** (`use_rsi_filter`):
- **Default**: `false`.
- **Effect**: If `true`, applies RSI-based overbought/oversold filters to signals.
- **RSI Length** (`rsi_length`):
- **Default**: `14`.
- **Range**: Minimum `1`.
- **Effect**: Sets the period for RSI calculation. Longer periods reduce sensitivity.
- **RSI Lower Limit** (`rsi_lower_limit`):
- **Default**: `30`.
- **Range**: `0` to `100`.
- **Effect**: Defines the oversold threshold for buy signals. Lower values allow trades in more extreme conditions.
- **RSI Upper Limit** (`rsi_upper_limit`):
- **Default**: `70`.
- **Range**: `0` to `100`.
- **Effect**: Defines the overbought threshold for sell signals. Higher values allow trades in more extreme conditions.
### 3.6 Signal Settings
- **Cross Window** (`cross_window`):
- **Default**: `0`.
- **Range**: `0` to `5` bars.
- **Effect**: Specifies the lookback period for detecting DI+/- or CCI crosses. `0` requires crosses on the current bar; higher values allow recent crosses, increasing signal frequency.
- **Allow Long Trades** (`allow_long`):
- **Default**: `true`.
- **Effect**: Enables/disables new long trades. If `false`, only closing existing longs is allowed.
- **Allow Short Trades** (`allow_short`):
- **Default**: `true`.
- **Effect**: Enables/disables new short trades. If `false`, only closing existing shorts is allowed.
- **Require DI+/DI- Cross for Buy** (`buy_di_cross`):
- **Default**: `true`.
- **Effect**: If `true`, requires a DI+ crossover DI- for buy signals; if `false`, DI+ > DI- is sufficient.
- **Require CCI Cross for Buy** (`buy_cci_cross`):
- **Default**: `true`.
- **Effect**: If `true`, requires a CCI crossover MA for buy signals; if `false`, CCI > MA is sufficient.
- **Require DI+/DI- Cross for Sell** (`sell_di_cross`):
- **Default**: `true`.
- **Effect**: If `true`, requires a DI- crossover DI+ for sell signals; if `false`, DI+ < DI- is sufficient.
- **Require CCI Cross for Sell** (`sell_cci_cross`):
- **Default**: `true`.
- **Effect**: If `true`, requires a CCI crossunder MA for sell signals; if `false`, CCI < MA is sufficient.
- **Countertrade** (`countertrade`):
- **Default**: `true`.
- **Effect**: If `true`, closing a trade triggers an opposite trade (e.g., close long, open short) if allowed.
- **Color Background for Open Trades** (`color_background`):
- **Default**: `true`.
- **Effect**: If `true`, colors the chart background green for long trades and red for short trades.
### 3.7 Exit Settings
- **Use MA Cross for Exit** (`use_ma_exit`):
- **Default**: `true`.
- **Effect**: If `true`, closes trades when the price crosses the exit MA (below for long, above for short).
- **MA Length for Exit** (`ma_exit_length`):
- **Default**: `20`.
- **Range**: Minimum `1`.
- **Effect**: Sets the period for the exit MA. Longer periods delay exits.
- **MA Type for Exit** (`ma_exit_type`):
- **Options**: `SMA`, `EMA`, `SMMA (RMA)`, `WMA`, `VWMA`.
- **Default**: `SMA`.
- **Effect**: Determines the MA type for exit signals. EMA is more responsive; VWMA weights by volume.
- **Use ADX Change Stop-Loss** (`use_adx_stop`):
- **Default**: `false`.
- **Effect**: If `true`, closes trades when the ADX changes by a specified percentage.
- **ADX % Change for Stop-Loss** (`adx_change_percent`):
- **Default**: `5.0`.
- **Range**: Minimum `0.0`, step `0.1`.
- **Effect**: Specifies the percentage change in ADX (vs. previous bar) that triggers a stop-loss. Higher values reduce premature exits.
- **Use Performance Stop-Loss** (`use_perf_stop`):
- **Default**: `false`.
- **Effect**: If `true`, closes trades when the loss exceeds a percentage threshold.
- **Performance Stop-Loss (%)** (`perf_stop_percent`):
- **Default**: `-10.0`.
- **Range**: `-100.0` to `0.0`, step `0.1`.
- **Effect**: Specifies the loss percentage that triggers a stop-loss. More negative values allow larger losses before exiting.
## 4. Visual and Statistical Output
- **Labels**: Displayed at trade entries/exits with arrows (↑ for buy, ↓ for sell) and text ("BUY," "SELL"). A "No Equity" label appears if equity is zero.
- **Background Coloring**: Optionally colors the chart background (green for long, red for short) to indicate open trades.
- **Statistics Table**: Displayed at the top center of the chart, updated on timeframe changes or trade events. Includes:
- **Capital Metrics**: Initial capital, current capital, capital growth (%).
- **Trade Metrics**: Total trades, long/short trades, win rate, long/short win rates, profit factor.
- **Open Trade Status**: Indicates if a long, short, or no trade is open.
## 5. Alerts
- **Buy Signal Alert**: Triggered when `buy_signal` is true ("Cross Buy Signal").
- **Sell Signal Alert**: Triggered when `sell_signal` is true ("Cross Sell Signal").
- **Usage**: Users can set up TradingView alerts to receive notifications for trade signals.

MACD Positive & Negative AlertThe MACD (Moving Average Convergence Divergence) is a momentum and trend-following indicator that helps traders identify the strength and direction of a trend, spot potential reversals, and fine-tune entry/exit timing.
Core Components
- MACD Line:
The difference between the 12-period and 26-period EMA (Exponential Moving Averages). This line highlights shifts in momentum and identifies the prevailing trend direction.
- Signal Line:
A 9-period EMA of the MACD line, acting as a trigger for buy/sell signals. When the MACD line crosses above the signal line, it suggests a bullish signal; when it crosses below, it suggests a bearish one.
- Histogram:
Shows the difference between the MACD line and the signal line as a bar graph. The histogram helps traders gauge the strength of the momentum and can warn of possible reversals. A rapidly growing histogram means strengthening momentum, while a shrinking one indicates weakening momentum.
Main Uses
- Trend Identification:
A positive MACD value typically signals a bullish trend, while a negative value signals a bearish trend.
- Momentum Analysis:
Divergences between MACD and price can warn of upcoming reversals. Increasing MACD histogram bars confirm strong momentum; shrinking bars suggest consolidation or reversal.
- Signal Generation:
Crossovers between the MACD line and the signal line generate trade signals—bullish (buy) if the MACD moves above the signal, bearish (sell) if it falls below l.
Example Interpretation
- MACD Crossover:
If the MACD line crosses above the signal line, it's often considered a buy signal; a cross below is a sell signal.
- Zero Line Cross:
If the MACD histogram moves from below zero to above, this is considered a bullish momentum shift; above zero to below is a bearish move.
The MACD is most effective in trending markets and should ideally be used alongside additional indicators for robust trading decisions.

均线趋势过滤器 (MA_trend Signal/Noise Filter)双语简介
中文:
这款指标是一个基于“信噪比”思想的终极趋势过滤器。它通过比较快速和慢速EMA均线之间的差值(即信号)与ATR(平均真实波幅,代表噪音)来判断市场趋势。只有当信号的强度超过噪音的指定倍数时,才会确认趋势的有效性。该指标可帮助交易者过滤掉噪音,精确捕捉强势趋势,避免误操作。
English:
This indicator is the Ultimate Trend Filter based on the Signal-to-Noise ratio concept. It compares the difference between the fast and slow EMA (Signal) to the ATR (Noise) to determine market trends. A trend is confirmed only when the signal strength exceeds the noise by a specified multiplier. This indicator helps traders filter out noise and accurately capture strong trends, avoiding false signals.

RSI+MA by RAThis Indicator generates buy and sell signal on the crossover of RSI and MA, HTF RSI is also plotted for HTF trend.

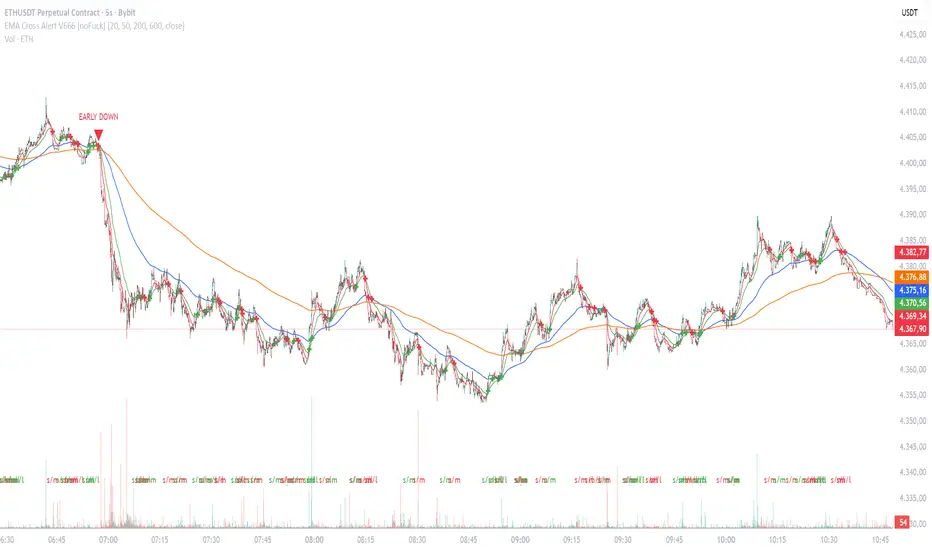
EMA Cross Alert V666 [noFuck]EMA Cross Alert — What it does
EMA Cross Alert watches three EMAs (Short, Mid, Long), detects their crossovers, and reports exactly one signal per bar by priority: EARLY > Short/Mid > Mid/Long > Short/Long. Optional EARLY mode pings when Short crosses Long while Mid is still between them—your polite early heads-up.
Why you might like it
Three crossover types: s/m, m/l, s/l
EARLY detection: earlier hints, not hype
One signal per bar: less noise, more focus
Clear visuals: tags, big cross at signal price, EARLY triangles
Alert-ready: dynamic alert text on bar close + static alertconditions for UI
Inputs (plain English)
Short/Mid/Long EMA length — how fast each EMA reacts
Extra EMA length (visual only) — context EMA; does not affect signals
Price source — e.g., Close
Show cross tags / EARLY triangles / large cross — visual toggles
Enable EARLY signals (Short/Long before Mid) — turn early pings on/off
Count Mid EMA as "between" even when equal (inclusive) — ON: Mid counts even if exactly equal to Short or Long; OFF (default): Mid must be strictly between them
Enable dynamic alerts (one per bar close) — master alert switch
Alert on Short/Mid, Mid/Long, Short/Long, EARLY — per-signal alert toggles
Quick tips
Start with defaults; if you want more EARLY on smooth/low-TF markets, turn “inclusive” ON
Bigger lengths = calmer trend-following; smaller = faster but choppier
Combine with volume/structure/risk rules—the indicator is the drummer, not the whole band
Disclaimer
Alerts, labels, and triangles are not trade ideas or financial advice. They are informational signals only. You are responsible for entries, exits, risk, and position sizing. Past performance is yesterday; the future is fashionably late.
Credits
Built with the enthusiastic help of Code Copilot (AI)—massively involved, shamelessly proud, and surprisingly good at breakfasting on exponential moving averages.
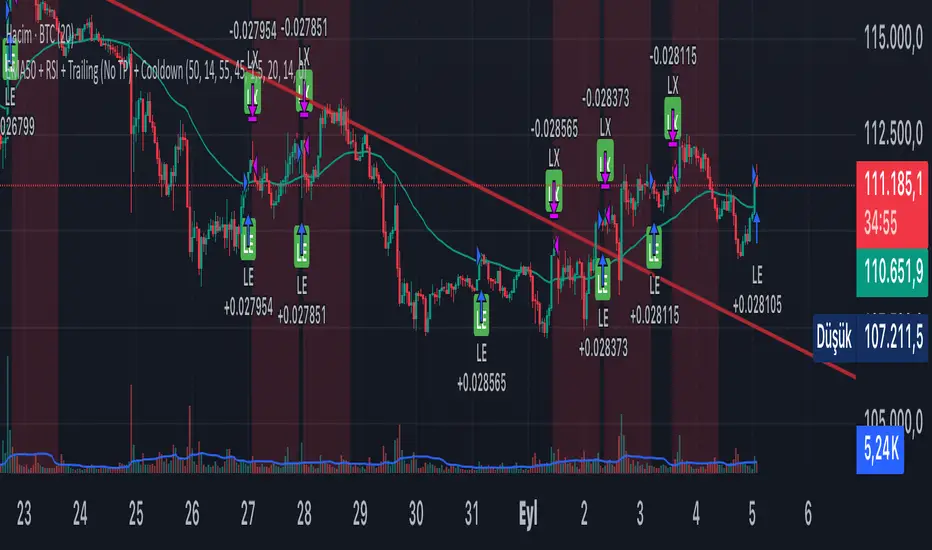
Mikey’s Strategy (AutoEMA+)
⚙️ Core Idea:
A long-only EMA crossover strategy that automatically selects the optimal EMA length (5–25) based on historical performance using a custom scoring system.
🎯 Entry Conditions:
Price crosses above the selected EMA.
(Optional) Price is above HTF EMA200 (higher timeframe trend).
(Optional) ADX is above a minimum threshold.
(Optional) Volume is above average × multiplier.
A cooldown period has passed since the last exit.
❌ Exit Condition:
Price closes fully below the EMA (current candle: high, low, and close all below),
and the previous candle was above or touched the EMA.
🧠 Auto EMA Selection Logic:
Scans EMAs in the range (e.g., 8–21) every N bars.
Scores each EMA based on:
Time price spent above the EMA
Respect for EMA (touches)
Trend consistency
Distance from EMA (when above)
Picks the EMA with the highest valid score, and updates only if it’s significantly better.
🛡️ Risk Management:
No pyramiding (1 position max).
Cooldown period after exit.
No hard stop loss or take profit.
📊 Visuals & Alerts:
Plots the selected EMA and optional HTF EMA200.
Entry markers and info label on the chart.
Alerts for valid entries and filtered signals.

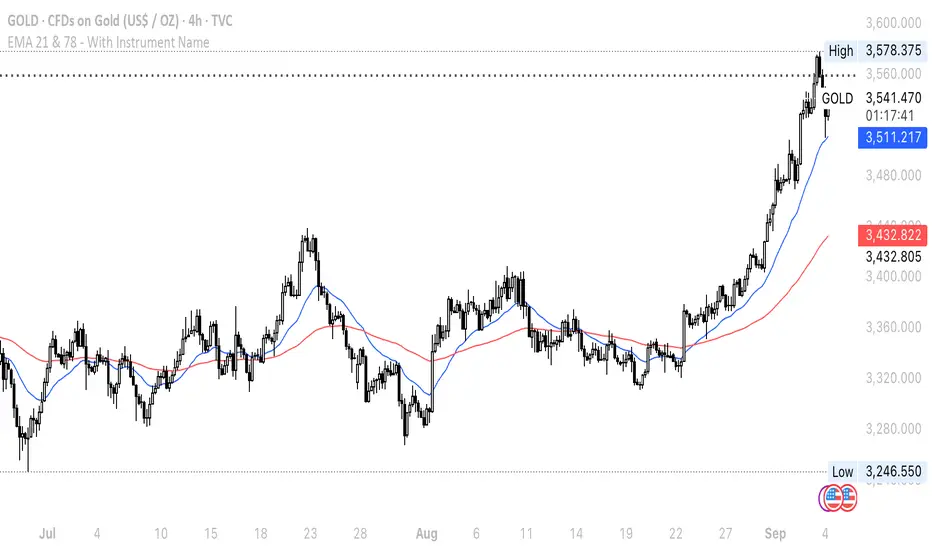
EMA 21 & 78 - With Instrument Nameonly add EMA21 and 78, I saw the 21 and 78 period is the most favor period when trading with gold
MA Median Crossover | MisinkoMasterThe MA Median Crossover is a new trend analysis tool designed to help traders catch trends with less noisy, more accuracy and speed.
While simple, this effective indicator can improve your strategy more than you might think.
How does it work?
1. Get user defined input
=> set up your indicator to your likings, and make it capture what you want it to
2. Calculate the Moving Average and Median Base
=> this is the foundation of the indicator
3. Smooth the median
=> less noise, more accuracy, just like that!
4. Compare the MA to the smoothed Median
=> If the MA > smoothed Median, it signals an uptrend, if the MA < smoothed Median,
it signals a downtrend.
Yep, that is how simple it is.
Final note:
Changing the MA type is very influencial, so watch out when changing them.
Enjoy G´s!

Triple Tap Sniper Triple Tap Sniper v3 – EMA Retest Precision System
Triple Tap Sniper is a precision trading tool built around the 21, 34, and 55 EMAs, designed to capture high-probability retests after EMA crosses. Instead of chasing the first breakout candle, the system waits for the first pullback into the EMA21 after a trend-confirming cross — the spot where professional traders often enter.
🔑 Core Logic
EMA Alignment → Trend defined by EMA21 > EMA34 > EMA55 (bullish) or EMA21 < EMA34 < EMA55 (bearish).
Cross Detection → Signals are only armed after a fresh EMA cross.
Retest Entry → Buy/Sell signals fire only on the first retest of EMA21, with trend still intact.
Pro Filters →
📊 Higher Timeframe Confirmation: Aligns signals with larger trend.
📈 ATR Volatility Filter: Blocks weak signals in low-vol chop.
📏 EMA Spread Filter: Ignores tiny “fake crosses.”
🕯️ Price Action Filter: Requires a proper wick rejection for valid entries.
🚀 Why Use Triple Tap Sniper?
✅ Filters out most false signals from sideways markets.
✅ Focuses only on clean trend continuations after pullbacks.
✅ Beginner-friendly visuals (Buy/Sell labels) + alert-ready for automation.
✅ Flexible: works across multiple timeframes & asset classes (stocks, crypto, forex).
⚠️ Notes
This is a signal indicator, not a full strategy. For backtesting and optimization, convert to a strategy and adjust filters per market/timeframe.
No indicator guarantees profits — use with sound risk management.

1H Candlestick vs EMA Crossover# Description — 1H Candlestick vs EMA Crossover (Pine Script)
This indicator is built in **TradingView Pine Script v5** and is designed to track the relationship between the **1‑hour candlestick close** and the **1‑hour Exponential Moving Average (EMA)**. It works on any chart timeframe but always pulls in **1H data** using `request. security`.
### Core Features
* **Customizable EMA length** (default = 200)
* **Plots the 1H EMA** as an orange line on your chart
* Optionally shows the **1H close** as a faint gray line for reference
* Detects and highlights when the **1H candle close crosses above or below the 1H EMA**
* **Arrows**: Green triangles appear below the bar when a bullish crossover happens (1H close > EMA); red triangles appear above the bar when a bearish crossover happens (1H close < EMA)
* **Alerts**: Built‑in `alert condition` statements let you create TradingView alerts whenever a crossover occurs
### How to Use
1. Adjust the EMA length if you want a faster or slower moving average.
2. Enable alerts: Right‑click the chart → Add Alert → choose this indicator and select either “crossed ABOVE EMA” or “crossed BELOW EMA.”
### Trading Applications
* **Trend Confirmation**: Use the 1H EMA as a higher‑timeframe filter while trading on lower timeframes.
* **Entry/Exit Signals**: Crossovers can mark potential entry points for trend continuation or reversals.
* **Scalping/Intraday**: Even on a 5m or 15m chart, you can overlay the 1H EMA to align your trades with the bigger trend.
This makes the indicator a simple yet powerful tool for aligning trades with higher‑timeframe momentum and avoiding false signals from lower‑timeframe noise.

SMA Crossover High/Low LinesSMA Crossover High/Low Lines (@version=5)
Purpose
This indicator plots horizontal lines and optional price labels on the high and low of candles where the price crosses a Simple Moving Average (SMA). It helps identify buy/sell signals visually on the chart.
Inputs
smaLength – Length of the SMA (default: 50).
showType – Which crossovers to show: "Both", "Buy Only", or "Sell Only".
lineLength – How many bars the horizontal line extends (default: 10).
showPriceLabels – Whether to show price labels at crossover points (true/false).
Logic
SMA Calculation – Computes a simple moving average of the closing price.
Crossover Detection:
crossUp → price crosses above SMA (buy signal).
crossDown → price crosses below SMA (sell signal).
Draw Horizontal Lines – At candle high and low of crossover:
Green for buy (crossUp)
Red for sell (crossDown)
Lines extend for lineLength bars
Optional Labels – Shows the high/low price at the end of the horizontal line if showPriceLabels is true.
Visualization
SMA line plotted in blue.
Buy crossovers → green horizontal lines and labels.
Sell crossovers → red horizontal lines and labels.
In short:
This indicator highlights buy/sell points where price crosses the SMA by marking candle highs/lows with colored lines and optional price labels for easy visual reference.

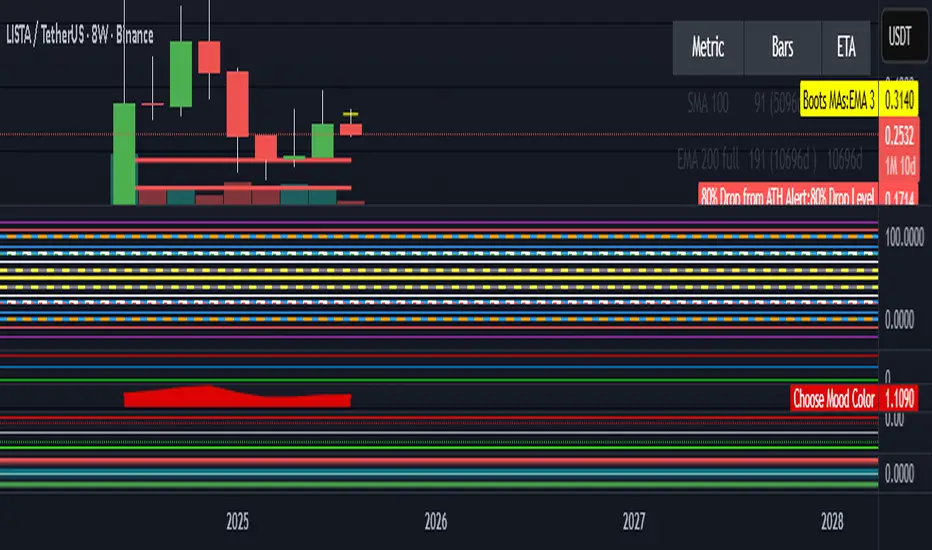
MA Availability ETA (SMA100/EMA200)This tool helps traders understand when long-term moving averages become available on any chosen timeframe.
Many new symbols, pairs, or timeframes don’t have enough price history to immediately plot long moving averages like SMA(100) and EMA(200). This script calculates and displays:
✅ Bars Remaining – how many bars are still needed before each moving average can be plotted reliably.
✅ ETA Duration – an estimate of how long (in chart time units) it will take until each MA is available.
✅ Status Table & Label – compact visual summary on the chart and in a table at the top-right corner.
✅ Vertical Marker – a dotted line showing exactly where both SMA(100) & EMA(200) first appear together.
✅ Alerts – optional alerts notify you the moment SMA(100) or EMA(200) become available.
🔑 Features
Works on any timeframe and instrument.
Highlights SMA(100) and EMA(200) on the chart for reference.
Lets you choose whether EMA(200) should be considered ready immediately, or only after a full 200-bar history.
Useful for traders who rely on long-term MA signals (golden cross, dynamic support/resistance, trend confirmation) and want to know when these tools will be ready on fresh charts.
🎯 Use Cases
New listings / low-history assets → See when SMA100 & EMA200 become usable.
Backtesting or forward-testing → Anticipate when long-term signals will first appear.
Trend-following strategies → Prepare in advance for crossovers or key support/resistance confluence zones.
⚠️ Note: ETAs are based on chart resolution and assume continuous data; real-world session gaps, weekends, or illiquid trading can make availability slightly later.
👉 Add this to your chart and you’ll always know when the big moving averages arrive — a critical moment for many upside moves and long-term strategies.
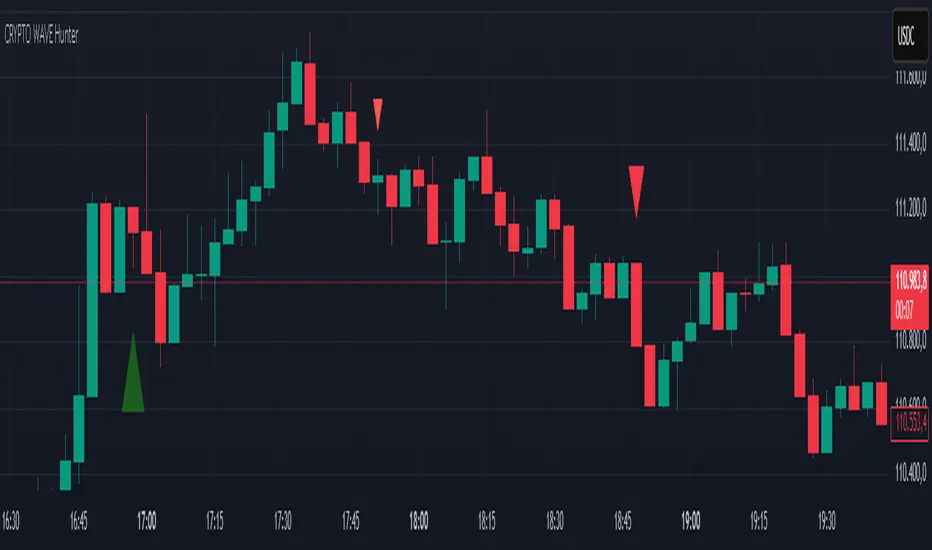
CRYPTO WAVE HUNTERWAVE HUNTER This indicator is designed to identify price movements across different time frames. Its purpose is to identify hourly, 2-hour, and 4-hour price movements on 3-minute candlestick charts. It is suitable for use on a 3-minute chart.
Monthly MA Box for S&P 500 or othersThis moving average helps detect when the asset is undervalued or overvalued. Users can adjust the spread between the moving averages.

Ultra Degen Indicator🚨 Ultra Degen Indicator 🚨
Ready to YOLO your way to the moon or get rekt trying?
The Ultra Degen Indicator is your ultimate co-pilot for navigating the wild world of crypto. This isn't your grandpa's boring, slow-moving indicator. This is pure, unadulterated degen energy, designed to help you catch pumps and dump your bags before it's too late.
We've turbocharged the classic Supertrend by adding a high-octane RSI filter. This means no more waiting for slow signals. We're getting in early and getting out fast.
What's under the hood?
Supercharged Supertrend: A lean, mean, trend-following machine that cuts through the noise to tell you whether to long or short.
RSI Momentum Filter: The secret sauce! We use RSI to confirm that the momentum is in your favor. No more buying on weak bounces or selling into strong pumps. If the Supertrend flashes a buy signal, the RSI checks for bullish momentum. If the RSI isn't feeling it, we sit on our hands and wait for a better entry.
Multi-Timeframe (MTF) Support: Want to catch a quick scalp but trade with the big boys' trend? No problem. The Ultra Degen Indicator lets you set a higher timeframe to filter your trades, so you can snipe entries on the 5-minute chart while staying aligned with the daily trend. This is how you avoid getting rekt by a whale.
This indicator is for the true degen who understands that sometimes, you just gotta ape in. Use it wisely, have fun, and may your portfolio never see a red candle again.
DYOR. NFA. LFG. 🚀

Gold Scalping Trend Strategy [Optimized] joey🟡 Gold Scalping Trend Strategy – Explained
This is a short-term scalping strategy designed for XAU/USD (gold), but it can also be applied to other volatile instruments.
It combines trend detection (moving averages + ATR filter) with scalping take-profit levels and a safety stop-loss.
The goal is to ride small but high-probability moves in the direction of the intraday trend while protecting capital.

Edric TrendThis is a very simple way for Trend by using Ema.
Created by Edric Le Hoang Dung (lehodu) from Vietnam
