[SM-021] Gaussian Trend System [Optimized]This script is a comprehensive trend-following strategy centered around a Gaussian Channel. It is designed to capture significant market movements while filtering out noise during consolidation phases. This version (v2) introduces code optimizations using Pine Script v6 Arrays and a new Intraday Time Control feature.
1. Core Methodology & Math
The foundation of this strategy is the Gaussian Filter, originally conceptualized by @DonovanWall.
Gaussian Poles: Unlike standard moving averages (SMA/EMA), this filter uses "poles" (referencing signal processing logic) to reduce lag while maintaining smoothness.
Array Optimization: In this specific iteration, the f_pole function has been refactored to utilize Pine Script Arrays. This improves calculation efficiency and rendering speed compared to recursive variable calls, especially when calculating deep historical data.
Channel Logic: The strategy calculates a "Filtered True Range" to create High and Low bands around the main Gaussian line.
Long Entry: Price closes above the High Band.
Short Entry: Price closes below the Low Band.
2. Signal Filtering (Confluence)
To reduce false signals common in trend-following systems, the strategy employs a "confluence" approach using three additional layers:
Baseline Filter: A 200-period (customizable) EMA or SMA acts as a regime filter. Longs are only taken above the baseline; Shorts only below.
ADX Filter (Volatility): The Average Directional Index (ADX) is used to measure trend strength. If the ADX is below a user-defined threshold (default: 20), the market is considered "choppy," and new entries are blocked.
Momentum Check: A Stochastic RSI check ensures that momentum aligns with the breakout direction.
3. NEW: Intraday Session Filter
Per user requests, a time-based filter has been added to restrict trading activity to specific market sessions (e.g., the New York Open).
How it works: Users can toggle a checkbox to enable/disable the filter.
Configuration: You can define a specific time range (Default: 09:30 - 16:00) and a specific Timezone (Default: New York).
Logic: The strategy longCondition and shortCondition now check if the current bar's timestamp falls within this window. If outside the window, no new entries are generated, though existing trades are managed normally.
4. Risk Management
The strategy relies on volatility-based exits rather than fixed percentage stops:
ATR Stop Loss: A multiple of the Average True Range (ATR) is calculated at the moment of entry to set a dynamic Stop Loss.
ATR Take Profit: An optional Reward-to-Risk (RR) ratio can be set to place a Take Profit target relative to the Stop Loss distance.
Band Exit: If the trend reverses and price crosses the opposite band, the trade is closed immediately to prevent large drawdowns.
Credits & Attribution
Original Gaussian Logic: Developed by @DonovanWalll. This script utilizes his mathematical formula for the pole filters.
Strategy Wrapper & Array Refactor: Developed by @sebamarghella.
Community Request: The Intraday Session Filter was added to assist traders focusing on specific liquidity windows.
Disclaimer: This strategy is for educational purposes. Past performance is not indicative of future results. Please use the settings menu to adjust the Session Time and Risk parameters to fit your specific asset class.
Medie mobili

EMA + ATR Semi-Auto strategy -Kohei Matsumura-EMAとATRを自動調節するストラテジー
This is an EMA- and ATR-based trading strategy that adapts its parameters according to recent market behavior and performance characteristics.
The strategy dynamically adjusts trend sensitivity and risk management settings to maintain robustness across varying market conditions, while operating strictly on confirmed price data.

MA Strategy: Dual Entry FilterConfigurable MA Dual-Filter Strategy
This strategy is an enhanced and highly configurable Moving Average (MA) Crossover system designed to mitigate false signals and align trades with the prevailing market trend. It is built to offer traders granular control over entry criteria, elevating it beyond basic, built-in MA crossover indicators.
Originality & Key Features
The script's originality and utility lie in the combination of its two primary, optional filtering mechanics:
Dual Entry Mode (Key Filter): Users can choose between two distinct methods for trade entry:
Crossover (Classic): Immediate entry when the price crosses the main MA.
Full Candle Confirmation (Unique Feature): This mode requires the entire candle body (open, high, low, and close) to be completely above or below the main MA after a crossover event to confirm the signal before entry. This strict confirmation helps to filter out weak crossovers, reducing whipsaws in choppy markets.
Optional Trend Filter: A second, slower MA (Trend Filter MA) can be activated. Trades are only permitted when the faster main MA is aligned with the slower Trend MA (i.e., long only if main MA > Trend MA), ensuring trades are executed with the established higher-timeframe direction.
How to Use the Strategy
The strategy logic is built on simple MA principles but utilizes Pine Script's switch function to allow users to select from six different MA types for both the main signal and the trend filter: SMA, EMA, WMA, HMA, VWMA, and RMA.
Core Logic:
Signal: A cross of the price over the Main MA (filtered by the chosen Entry Mode).
Directional Filter: The Trend Filter must confirm the direction (if enabled).
Exit: Trades are exited on the opposite price crossover of the Main MA.
Customizable Settings Include:
Main MA Type & Length (Default: 40 EMA): The primary signal generator.
Trend Filter MA Type & Length (Default: 70 EMA): The optional, slower trend bias.
Entry Mode: Switch between Crossover or Full Candle Confirmation.
Strategy Results and High-Risk Disclaimer
The default setting for trade size is set to 40% of equity for backtesting demonstration purposes only. This high value is used to generate a large and diverse sample size of trades for historical review on the chart.
This 40% value is NOT a recommended setting for live trading. Per TradingView guidelines, traders are strongly advised to change this input to a sustainable risk level, typically 5% to 10% of equity per trade. Past performance is not a guarantee of future results.

ChronoPulse MS-MACD Resonance StrategyChronoPulse MS-MACD Resonance Strategy
A systematic trading strategy that combines higher-timeframe market structure analysis with dual MACD momentum confirmation, ATR-based risk management, and real-time quality assurance monitoring.
Core Principles
The strategy operates on the principle of multi-timeframe confluence, requiring agreement between:
Market structure breaks (CHOCH/BOS) on a higher timeframe
Dual MACD momentum confirmation (classic and crypto-tuned profiles)
Trend alignment via directional EMAs
Volatility and volume filters
Quality score composite threshold
Strategy Components
Market Structure Engine : Detects Break of Structure (BOS) and Change of Character (CHOCH) events using confirmed pivots on a configurable higher timeframe. Default structure timeframe is 240 minutes (4H).
Dual MACD Fusion : Requires agreement between two MACD configurations:
Classic MACD: 12/26/9 (default)
Fusion MACD: 8/21/5 (default, optimized for crypto volatility)
Both must agree on direction before trade execution. This can be disabled to use single MACD confirmation.
Trend Alignment : Uses two EMAs for directional bias:
Directional EMA: 55 periods (default)
Execution Trend Guide: 34 periods (default)
Both must align with trade direction.
ATR Risk Management : All risk parameters are expressed in ATR multiples:
Stop Loss: 1.5 × ATR (default)
Take Profit: 3.0 × ATR (default)
Trail Activation: 1.0 × ATR profit required (default)
Trail Distance: 1.5 × ATR behind price (default)
Volume Surge Filter : Optional gate requiring current volume to exceed a multiple of the volume SMA. Default threshold is 1.4× the 20-period volume SMA.
Quality Score Gate : Composite score (0-1) combining:
Structure alignment (0.0-1.0)
Momentum strength (0.0-1.0)
Trend alignment (0.0-1.0)
ATR volatility score (0.0-1.0)
Volume intensity (0.0-1.0)
Default threshold: 0.62. Trades only execute when quality score exceeds this threshold.
Execution Discipline : Trade budgeting system:
Maximum trades per session: 6 (default)
Cooldown bars between entries: 5 (default)
Quality Assurance Console : Real-time monitoring panel displaying:
Structure status (pass/fail)
Momentum confirmation (pass/fail)
Volatility readiness (pass/fail)
Quality score (pass/fail)
Discipline compliance (pass/fail)
Performance metrics (win rate, profit factor)
Net PnL
Certification requires: Win Rate ≥ 40%, Profit Factor ≥ 1.4, Minimum 25 closed trades, and positive net profit.
Integrity Suite : Optional validation panel that audits:
Configuration sanity checks
ATR data readiness
EMA hierarchy validity
Performance realism checks
Strategy Settings
strategy(
title="ChronoPulse MS-MACD Resonance Strategy",
shorttitle="ChronPulse",
overlay=true,
max_labels_count=500,
max_lines_count=500,
initial_capital=100000,
currency=currency.USD,
pyramiding=0,
commission_type=strategy.commission.percent,
commission_value=0.015,
slippage=2,
default_qty_type=strategy.percent_of_equity,
default_qty_value=2.0,
calc_on_order_fills=true,
calc_on_every_tick=true,
process_orders_on_close=true
)
Key Input Parameters
Structure Timeframe : 240 (4H) - Higher timeframe for structure analysis
Structure Pivot Left/Right : 3/3 - Pivot confirmation periods
Structure Break Buffer : 0.15% - Buffer for structure break confirmation
MACD Fast/Slow/Signal : 12/26/9 - Classic MACD parameters
Fusion MACD Fast/Slow/Signal : 8/21/5 - Crypto-tuned MACD parameters
Directional EMA Length : 55 - Primary trend filter
Execution Trend Guide : 34 - Secondary trend filter
ATR Length : 14 - ATR calculation period
ATR Stop Multiplier : 1.5 - Stop loss in ATR units
ATR Target Multiplier : 3.0 - Take profit in ATR units
Trail Activation : 1.0 ATR - Profit required before trailing
Trail Distance : 1.5 ATR - Distance behind price
Volume Threshold : 1.4× - Volume surge multiplier
Quality Threshold : 0.62 - Minimum quality score (0-1)
Max Trades Per Session : 6 - Daily trade limit
Cooldown Bars : 5 - Bars between entries
Win-Rate Target : 40% - Minimum for QA certification
Profit Factor Target : 1.4 - Minimum for QA certification
Minimum Trades for QA : 25 - Required closed trades
Signal Generation Logic
A trade signal is generated when ALL of the following conditions are met:
Higher timeframe structure shows bullish (CHOCH/BOS) or bearish structure break
Both MACD profiles agree on direction (if fusion enabled)
Price is above both EMAs for longs (below for shorts)
ATR data is ready and above minimum threshold
Volume exceeds threshold × SMA (if volume gate enabled)
Quality score ≥ quality threshold
Trade budget available (under max trades per day)
Cooldown period satisfied
Risk Management
Stop loss and take profit are set immediately on entry
Trailing stop activates after 1.0 ATR of profit
Trailing stop maintains 1.5 ATR distance behind highest profit point
Position sizing uses 2% of equity per trade (default)
No pyramiding (single position per direction)
Limitations and Considerations
The strategy requires sufficient historical data for higher timeframe structure analysis
Quality gate may filter out many potential trades, reducing trade frequency
Performance metrics are based on historical backtesting and do not guarantee future results
Commission and slippage assumptions (0.015% + 2 ticks) may vary by broker
The strategy is optimized for trending markets with clear structure breaks
Choppy or ranging markets may produce false signals
Crypto markets may require different parameter tuning than traditional assets
Optimization Notes
The strategy includes several parameters that can be tuned for different market conditions:
Quality Threshold : Lower values (0.50-0.60) allow more trades but may reduce average quality. Higher values (0.70+) are more selective but may miss opportunities.
Structure Timeframe : Use 240 (4H) for intraday trading, Daily for swing trading, Weekly for position trading
Volume Gate : Disable for low-liquidity pairs or when volume data is unreliable
Dual MACD Fusion : Disable for mean-reverting markets where single MACD may be more responsive
Trade Discipline : Adjust max trades and cooldown based on your risk tolerance and market volatility
Non-Repainting Guarantee
All higher timeframe data requests use lookahead=barmerge.lookahead_off to prevent repainting. Pivot detection waits for full confirmation before registering structure breaks. All visual elements (tables, labels) update only on closed bars.
Alerts
Three alert conditions are available:
ChronoPulse Long Setup : Fires when all long entry conditions are met
ChronoPulse Short Setup : Fires when all short entry conditions are met
ChronoPulse QA Certification : Fires when Quality Assurance console reaches CERTIFIED status
Configure alerts with "Once Per Bar Close" delivery to match the non-repainting design.
Visual Elements
Structure Labels : CHOCH↑, CHOCH↓, BOS↑, BOS↓ markers on structure breaks
Directional EMA : Orange line showing trend bias
Trailing Stop Lines : Green (long) and red (short) trailing stop levels
Dashboard Panel : Real-time status display (structure, MACD, ATR, quality, PnL)
QA Console : Quality assurance monitoring panel
Integrity Suite Panel : Optional validation status display
Recommended Usage
Forward test with paper trading before live deployment
Monitor the QA console until it reaches CERTIFIED status
Adjust parameters based on your specific market and timeframe
Respect the trade discipline limits to avoid over-trading
Review quality scores and adjust threshold if needed
Use appropriate commission and slippage settings for your broker
Technical Implementation
The strategy uses Pine Script v6 with the following key features:
Multi-timeframe data requests with lookahead protection
Confirmed pivot detection for structure analysis
Dynamic trailing stop management
Real-time quality score calculation
Trade budgeting and cooldown enforcement
Comprehensive dashboard and monitoring panels
All source code is open and available for review and modification.
Disclaimer
This script is for educational and informational purposes only. It is not intended as financial, investment, or trading advice. Past performance does not guarantee future results. Trading involves substantial risk of loss and is not suitable for all investors. Always conduct your own research and consult with a qualified financial advisor before making any trading decisions. The author and TradingView are not responsible for any losses incurred from using this strategy.

AI ALGO [Ganesh]Core Strategy Components\
1. EMA (Exponential Moving Average) SystemThe strategy uses three EMAs to identify trend direction:
EMA 48 (longer-term trend)
EMA 2 (short-term momentum)
EMA 21 (medium-term trend)
How it works:
Bullish trend: When price is above EMA 21 (green cloud)
Bearish trend: When price is below EMA 21 (red cloud)
EMA Cloud: The area between EMA 2 and EMA 48/21 provides visual trend confirmation
Optional higher timeframe (HTF) analysis for multi-timeframe confirmation
2. DEMA ATR (Double EMA + Average True Range)
This is a dynamic support/resistance indicator that adapts to volatility:Components:
DEMA (Double Exponential Moving Average): Smooths price action with less lag
ATR Bands: Creates upper and lower bands based on volatility (ATR × 1.7 factor)
Signal Generation:
Green line: Uptrend (DEMA ATR rising)
Red line: Downtrend (DEMA ATR falling)
Acts as a trailing stop-loss level that adjusts with market volatility
3. Smart Trail System (Fibonacci-Based)
An advanced trailing stop system using modified true range calculations:Key Features:
Calculates true range using Wilder's smoothing method
Creates Fibonacci retracement levels (61.8%, 78.6%, 88.6%) from the trail line
Adaptive stop-loss: Adjusts based on ATR factor (4.2) and smoothing (4)
Trend Detection:
Bullish: Price > Trailing line (blue zones)
Bearish: Price < Trailing line (red zones)
The Fibonacci zones show potential support/resistance areas
4. ZigZag Indicator Identifies significant swing highs and lows:
Length parameter: 13 (sensitivity control)
Labels: Higher Highs (HH), Lower Lows (LL), etc.
Helps identify trend reversals and key pivot points
5. Support & Resistance Levels
Strength-based S/R: Identifies horizontal support/resistance zones
Zone width: Adjustable percentage-based zones
High/Low zones: Marks significant price levels
Trading LogicEntry Conditions (Implied)The strategy likely enters trades when:Long Entry:
Price crosses above DEMA ATR (green)
Price is above EMA 21 (bullish EMA cloud)
Smart Trail confirms uptrend
Price bounces from Fibonacci support levels
Short Entry:
Price crosses below DEMA ATR (red)
Price is below EMA 21 (bearish EMA cloud)
Smart Trail confirms downtrend
Price rejects from Fibonacci resistance levels
Exit/Stop-Loss Strategy
Trailing stops: Using Smart Trail Fibonacci levels
Dynamic stops: DEMA ATR line acts as a moving stop-loss
Risk management: Position sizing at 50% of equity per trade
Dashboard Features1. Weekly Performance Table
Tracks trades per day of the week
Shows win/loss statistics
Calculates win rate percentage
2. Monthly Performance Table
Monthly P&L breakdown
Yearly performance summary
Color-coded returns (green = profit, red = loss)
Strategy Parameters
Initial Capital: $5,000
Commission: 0.02% per trade
Position Size: 50% of equity
Pyramiding: Disabled (no adding to positions)
Calculation: On bar close (not tick-by-tick)
Visual Elements
EMA clouds: Green (bullish) / Red (bearish)
DEMA ATR line: Dynamic support/resistance
Smart Trail zones: Fibonacci-based colored bands
ZigZag lines: Swing high/low connections
S/R zones: Horizontal support/resistance areas
Strategy Philosophy
This is a trend-following strategy with dynamic risk management that:
Uses multiple timeframes for confirmation
Adapts to volatility through ATR-based indicators
Provides clear visual cues for trend direction
Includes comprehensive performance tracking
Combines momentum (EMAs) with volatility (ATR) for robust signals
The strategy works best in trending markets and uses the Fibonacci trail system to maximize profits while protecting against reversals with adaptive stop-losses.

Katik EMA BUY SELLThis strategy uses EMA 9, EMA 20, and EMA 200 to generate Buy and Sell signals.
BUY Conditions
EMA 9 crosses above EMA 20
Stoploss: Recent Swing Low
Target: EMA 9 touches or crosses EMA 200
SELL Conditions
EMA 9 crosses below EMA 20
Stoploss: Recent Swing High
Target: EMA 9 touches or crosses EMA 200
Features
Automatic Long & Short entries
Dynamic swing-based stoploss
Clear EMA plots with line width 3
Works on all timeframes

Sniper PRO: The "Buffett Mode" VFI System"The stock market is a device for transferring money from the impatient to the patient." — Warren Buffett
Most traders lose money because they try to catch every small move. Sniper PRO is designed for the opposite: It identifies the massive, multi-week and multi-month trends driven by Institutional "Smart Money", and keeps you in the trade until the real move is over.
This is not a scalping tool. This is a Wealth Compounding Engine.
🚀 Why is this the "Secret Weapon"?
We combined the most searched and respected indicators into a single, high-probability algorithm:
VFI (Smart Money Flow): Tracks what the "Whales" are doing, not the retail traders.
Fibonacci Golden Ratio: Uses math to secure profits, not guesswork.
Trend Protocol: Filters out 90% of market noise.
🔥 The "Diamond Hands" Logic (VFI Shield)
The biggest problem in long-term trading is getting shaken out by a temporary dip. Sniper PRO solves this with the VFI Shield:
Even if price drops below your Stop Loss, the algorithm checks the Institutional Volume.
If Big Money is still holding? The Shield holds. You stay in the trade.
This feature alone allows you to ride trends for Weeks and Months (like NVDA, TSLA, BTC runs) without exiting prematurely.
⚙️ How It Works
1. The "Buffett" Entry We only enter when the odds are stacked in our favor:
Trend: Price must be above the EMA 50 (Bull Market).
Volume: VFI must be Positive (Accumulation Phase).
Volatility: The market must be active, not chopping sideways.
2. The Compounding Exit (Fibonacci Ladder) Instead of selling too early, the system builds a Fibonacci Ladder behind the price.
As the asset grows, your Stop Loss climbs automatically to the next Fibonacci level (0.382 -> 0.5 -> 0.618).
This locks in profits step-by-step while giving the asset room to breathe and grow.
3. Asymmetric Safety Shorting is risky in a long-term bull market. The system automatically reduces the size of Short trades to protect your capital, while maximizing exposure to Long rallies.
📊 Visual Guide
🔵 Blue Line: The Trend Baseline.
🔴 Red Steps: Your "Locked" Profit Level (Trailing Stop).
🟣 Purple 'X': Where the trade finally closed (Transparency).
Background Color:
Green: Bull Market (Safe to hold).
Orange: Choppy/Dangerous (Cash is King).
Best For:
Swing Traders & Investors (1D, 4H Timeframes).
People who want to catch the Big Moves and ignore the noise.
Disclaimer: This tool is designed for trend following. Past performance is not indicative of future results. Always manage your risk.

Crypto Intraday Strategy by SAIFOverview
A comprehensive intraday trading strategy designed for cryptocurrency markets, combining multiple technical indicators and risk management principles to identify high-probability trading opportunities.
Key Features
Multi-Timeframe Analysis
Utilizes exponential moving averages for trend identification
Incorporates swing structure analysis for support and resistance levels
Applies momentum and trend strength filters
Risk Management
Configurable risk-reward ratios (default 1.6:1)
Maximum risk per trade capped at 3.1% of equity
Dynamic stop-loss placement based on market structure
Position sizing at 2% of equity per trade
Advanced Filters
Trend strength confirmation using ADX indicator
Momentum validation through multiple oscillators
Market correlation analysis for additional confluence
Optional weekend trading filter to avoid low-liquidity periods
Swing Structure Recognition
Automatically identifies key swing highs and lows
Uses pivot points to determine optimal entry zones
Prevents entries too far from established support/resistance
Trade Execution
The strategy employs a one-way trading approach, entering positions only when multiple technical conditions align. Each trade includes pre-defined stop-loss and take-profit levels calculated at entry.
Customization Options
Adjustable swing detection sensitivity
Configurable EMA distance thresholds
Optional correlation filters
Weekend trading toggle
Risk parameters can be modified to suit individual preferences
Important Disclaimers
⚠️ Educational Purpose Only: This strategy is provided for educational and informational purposes. Past performance does not guarantee future results.
⚠️ Risk Warning: Trading cryptocurrencies carries substantial risk of loss. Only trade with capital you can afford to lose.
⚠️ Not Financial Advice: This tool does not constitute financial, investment, or trading advice. Always conduct your own research and consult with qualified financial professionals.
⚠️ Backtesting Limitations: Historical backtesting results may not reflect actual trading conditions due to slippage, execution delays, and changing market dynamics.
Fees & Slippage
Commission: 0.12% per trade
Slippage: 2 ticks accounted for in backtesting
Recommended Usage
Thoroughly backtest on your preferred trading pairs
Start with small position sizes when live trading
Monitor performance across different market conditions
Adjust parameters based on asset volatility and your risk tolerance

OLPF - Octavio Low-Pass Filter StrategyOCTAVIO LOW-PASS FILTER (OLPF) v1.0
---
DESCRIPTION
The Octavio Low-Pass Filter (OLPF) is an advanced Finite Impulse Response (FIR) low-pass filter designed for financial time series analysis. It builds upon the foundational work of the New Low-Pass Filter (NLF) by Alex Pierrefeu, introducing three key enhancements that significantly improve signal quality and reduce common filtering artifacts.
---
KEY INNOVATIONS
1. HERMITE SMOOTHING POLYNOMIAL
Replaces the simple quadratic base (x²) with the cubic Hermite interpolation polynomial . This mathematical refinement provides C¹ continuity at kernel boundaries, ensuring smoother transitions and eliminating edge discontinuities that can introduce artificial noise into the filtered signal.
2. LANCZOS SIGMA FACTOR WINDOWING
Applies a Lanczos-type attenuation factor to each harmonic component in the sine series. This windowing technique dramatically reduces the Gibbs phenomenon - the characteristic overshooting and ringing that occurs near sharp price transitions. The result is a cleaner signal with minimized false crossover signals.
3. ADAPTIVE WEIGHT NORMALIZATION
Implements dynamic normalization of kernel weights, guaranteeing that the sum of all filter coefficients equals unity. This ensures proper amplitude preservation across all market conditions and prevents signal drift or scaling artifacts.
---
MATHEMATICAL FOUNDATION
The OLPF kernel function is defined as:
K(x, N) = x²(3-2x) + Σ (1/i) × σ(i) × sin(πxi)
Where:
- x ∈ is the normalized position within the filter window
- N is the filter order (degree of the sine series)
- σ(i) = sin(πi/(N+1)) / (πi/(N+1)) is the Lanczos sigma factor
The filter output is computed via discrete convolution:
F(M, N) = Σ src × / W
Where W is the sum of all weights for normalization.
---
APPLICATIONS
- Trend identification with reduced lag compared to traditional MAs
- Noise reduction in volatile market conditions
- Generation of trading signals via fast/slow filter crossovers
- Foundation for more complex indicator development
---
STRATEGY IMPLEMENTATION
This script implements a dual-filter crossover strategy with:
- Fast OLPF for responsive signal generation
- Slow OLPF for trend confirmation
- EMA filter for additional trend validation
- ATR-based dynamic stop-loss positioning
- Risk-based position sizing (percentage of equity)
---
AUTHOR
Name: Hector Octavio Piccone Pacheco
Filter: Octavio Low-Pass Filter (OLPF)
Version: 1.0
Based on: New Low-Pass Filter (NLF) by Alex Pierrefeu
Date: 2025
Original Contributions:
- Hermite smoothing polynomial kernel base
- Lanczos sigma factor windowing for Gibbs reduction
- Adaptive weight normalization system
- Integrated risk management framework
---
LICENSE
This work is licensed under the Mozilla Public License 2.0. You are free to use, modify, and distribute this code with attribution.
---
DISCLAIMER
Trading involves substantial risk of loss. This indicator is provided for educational and research purposes only. Past performance does not guarantee future results. Always conduct your own analysis and risk assessment.

Hyper Insight MA Strategy [Universal]Hyper Insight MA Strategy ** is a comprehensive trend-following engine designed for traders who require precision and flexibility. Unlike standard indicators that lock you into a single calculation method, this strategy serves as a "Universal Adapter," allowing you to **Mix & Match 13 different Moving Average types** for both the Fast and Slow trend lines independently.
Whether you need the smoothness of T3, the responsiveness of HMA, or the classic reliability of SMA, this script enables you to backtest thousands of combinations to find the perfect edge for your specific asset class.
---
🔬 Deep Dive: Calculation Logic of Included MAs
This strategy includes 13 distinct calculation methods. Understanding the math behind them will help you choose the right tool for your specific market conditions.
#### 1. Standard Averages
* **SMA (Simple Moving Average):** The unweighted mean of the previous $n$ data points.
* *Logic:* Treats every price point in the period with equal importance. Good for identifying long-term macro trends but reacts slowly to recent volatility.
* **WMA (Weighted Moving Average):** A linear weighted average.
* *Logic:* Assigns heavier weight to current data linearly (e.g., $1, 2, 3... n$). It reacts faster than SMA but is still relatively smooth.
* **SWMA (Symmetrically Weighted Moving Average):**
* *Logic:* Uses a fixed-length window (usually 4 bars) with symmetrical weights $ $. It prioritizes the center of the recent data window.
#### 2. Exponential & Lag-Reducing Averages
* **EMA (Exponential Moving Average):**
* *Logic:* Applies an exponential decay weighting factor. Recent prices have significantly more impact on the average than older prices, reducing lag compared to SMA.
* **RMA (Running Moving Average):** Also known as Wilder's Smoothing (used in RSI).
* *Logic:* It is essentially an EMA but with a slower alpha weight of $1/length$. It provides a very smooth, stable line that filters out noise effectively.
* **DEMA (Double Exponential Moving Average):**
* *Logic:* Calculated as $2 \times EMA - EMA(EMA)$. By subtracting the "lag" (the smoothed EMA) from the original EMA, DEMA provides a much faster reaction to price changes with less noise than a standard EMA.
* **TEMA (Triple Exponential Moving Average):**
* *Logic:* Calculated as $3 \times EMA - 3 \times EMA(EMA) + EMA(EMA(EMA))$. This effectively eliminates the lag inherent in single and double EMAs, making it an extremely fast-tracking indicator for scalping.
#### 3. Advanced & Adaptive Averages
* **HMA (Hull Moving Average):**
* *Logic:* A composite formula involving Weighted Moving Averages: ASX:WMA (2 \times Integer(n/2)) - WMA(n)$. The result is then smoothed by a $\sqrt{n}$ WMA.
* *Effect:* It eliminates lag almost entirely while managing to improve curve smoothness, solving the traditional trade-off between speed and noise.
* **ZLEMA (Zero Lag Exponential Moving Average):**
* *Logic:* This calculation attempts to remove lag by modifying the data source before smoothing. It calculates a "lag" value $(length-1)/2$ and applies an EMA to the data: $Source + (Source - Source )$. This creates a projection effect that tracks price tightly.
* **T3 (Tillson T3 Moving Average):**
* *Logic:* A complex smoothing technique that runs an EMA through a filter multiple times using a "Volume Factor" (set to 0.7 in this script).
* *Effect:* It produces a curve that is incredibly smooth and free of "overshoot," making it excellent for filtering out market chop.
* **ALMA (Arnaud Legoux Moving Average):**
* *Logic:* Uses a Gaussian distribution (bell curve) to assign weights. It allows the user to offset the moving average (moving the peak of the weight) to align it perfectly with the price, balancing smoothness and responsiveness.
* **LSMA (Least Squares Moving Average):**
* *Logic:* Calculates the endpoint of a Linear Regression line for the lookback period. It essentially guesses where the price "should" be based on the best-fit line of the recent trend.
* **VWMA (Volume Weighted Moving Average):**
* *Logic:* Weights the closing price by the volume of that bar.
* *Effect:* Prices on high volume days pull the MA harder than prices on low volume days. This is excellent for validating true trend strength (i.e., a breakout on high volume will move the VWMA significantly).
---
### 🛠 Features & Settings
* **Universal Switching:** Change the `Fast MA` and `Slow MA` types instantly via the settings menu.
* **Trend Cloud:** A dynamic background fill (Green/Red) highlights the crossover zone for immediate visual trend identification.
* **Strategy Mode:** Built-in Backtesting logic triggers `LONG` entries when Fast MA crosses over Slow MA, and `EXIT` when Fast MA crosses under.
### ⚠️ Disclaimer
This script is intended for educational and research purposes. The wide variety of MA combinations can produce vastly different results. Past performance is not indicative of future results. Please use proper risk management.


51 - By GoldmanMrBaNNathis script is a multi-timeframe alignment tool designed to help users visually compare the trend direction of a higher timeframe with the movement on a lower timeframe.
The indicator simply displays when both selected timeframes are moving in the same direction based on a customizable trend-detection method (such as moving average alignment).
Its purpose is to provide clarity, structure, and directional alignment for chart analysis.
Users can select:
A higher timeframe
A lower timeframe
Trend calculation method
Visual display options
The tool is made to support analysis only.
It does not execute trades, generate financial advice, or guarantee outcomes.
Always use additional independent research when making decisions.

Trend Signal MomentumOVERVIEW
Signal Trend Momentum is a hybrid strategy that combines multiple confirmations and filters to obtain better potential trading signals. Each confirmation and filter in Signal Trend Momentum aims to avoid possible false and trap signals.
HYBRID CONCEPTS
Smart Money Concept – This indicator forms market structure and Bullish & Bearish Order Block areas to make it easier to identify market trends and strong areas where price reversals often occur. Its purpose is to simplify recognizing market direction and serve as the first confirmation.
MSS + BOS (Market Structure Shift + Break of Structure) – This indicator serves as additional confirmation for the Smart Money Concept. With the presence of two types of market structure, the market trend direction becomes clearer and more convincing.
RSI Momentum Signal – This indicator becomes the third confirmation. When the Market Trend is clear and convincing, supported by the formation of Bearish and Bullish Order Blocks, the role of the Momentum Signal here becomes crucial as it provides trend momentum based on overbought and oversold areas.
Momentum Position – This indicator becomes the next confirmation based on buyer and seller VOLUME in the market. If buyer volume is higher, the momentum position will be depicted on the chart with an upward arrow, and conversely, if seller volume is higher, it will be depicted with a downward arrow.
SnR (Support and Resistance) – This final indicator is Support and Resistance, which will serve as the last and more convincing confirmation. Support and Resistance will strengthen the Order Block areas formed by the Smart Money Concept indicator. A Bullish Order Block + Support creates a higher possibility for an upward trend in the market, conversely, a Bearish Order Block + Resistance creates a higher possibility for a downward trend in the market.
The combination of these several indicators will provide a strong market direction + persistent buyer and seller areas, as well as depict momentum based on volume + RSI which serve as additional confirmations.
These additional confirmations will produce stronger signals and help avoid false and trap signals in the market.
HOW TO USE
A SHORT SIGNAL will be strong if there is a Downtrend Market Structure + Bearish Order Block + Resistance + Oversold RSI Momentum + Strong Seller Volume Momentum.
A LONG SIGNAL will be strong if there is an Uptrend Market Structure + Bullish Order Block + Support + Overbought RSI Momentum + Strong Buyer Volume Momentum.
CONCLUSION
Signal Trend Momentum is a combination of several powerful indicators designed to produce stronger, clearer, and easier-to-read signals.
This strategy is highly suitable for traders seeking more convincing trade signals based on multiple confirmations from the combined indicators, thereby creating a strong signal with a higher probability.

JYL Trend Pro V1.0 BETAJYL Trend Pro V1.0 is a rule‑based trend‑following strategy built on a proprietary smoothed price engine.
It focuses on clear trend states and position management rather than classic indicators, and can be used on both long and short side depending on the user’s settings.
Three Signal Modes
1. Stable Mode
Stable mode is the “classic” version of the system.
It reacts only when the trend state clearly flips, and then manages the position with simple rules:
First strong bullish state → open / add to long
First strong bearish state → open / add to short
When the trend weakens but does not fully reverse, the strategy can reduce position size (partial exit)
When the trend flips in the opposite direction, the strategy fully exits the existing position
This mode is designed for traders who prefer fewer signals and smoother equity curves.
2. Impulsive Mode
Impulsive mode keeps the same core logic, but allows the strategy to react earlier and manage exits more actively:
Opportunistic early entries around strong moves
Protective “early stop” logic for those aggressive entries
Segment‑based partial exits after extended bullish or bearish runs
Fast full exits when momentum fades quickly or the trend flips
This mode is aimed at users who accept more trade frequency in exchange for faster reactions.
3. IMP+ Mode (Impulsive Plus)
IMP+ is the advanced version of Impulsive mode. It keeps all core behavior and adds extra controls for power‑users:
Adjustable presets for how early the system can enter a move
Adjustable presets for how quickly early entries are cut if they fail
Smarter add‑ons after a bullish / bearish segment, so adds can occur either at the next strong signal or on a “pullback‑type” bar inside the ongoing trend
Flexible multi‑level partial‑exit packages after a strong run
Additional “emergency exit” logic that can flatten positions when price opens too close to the previous bar after a strong trend segment
All of these options are exposed as presets in the Inputs tab, so users can experiment without touching code.
Signals & Usage
The strategy prints clear labels on the chart:
LONG / SHORT – open or add to position
REDUCE SIZE – partial profit‑taking or risk reduction
SELL LONG / SHORT COVER – full exit of long / short positions
A trade‑direction filter lets you run the system as long‑only, short‑only, or long & short.
This script is provided for educational and research purposes only.
It is not financial advice and does not guarantee any future performance. Always test on a demo account, adjust risk to your own situation, and consult your broker or advisor before trading live.
Internally, this strategy is based on the private JYL Trend Pro rule set and risk‑management framework.
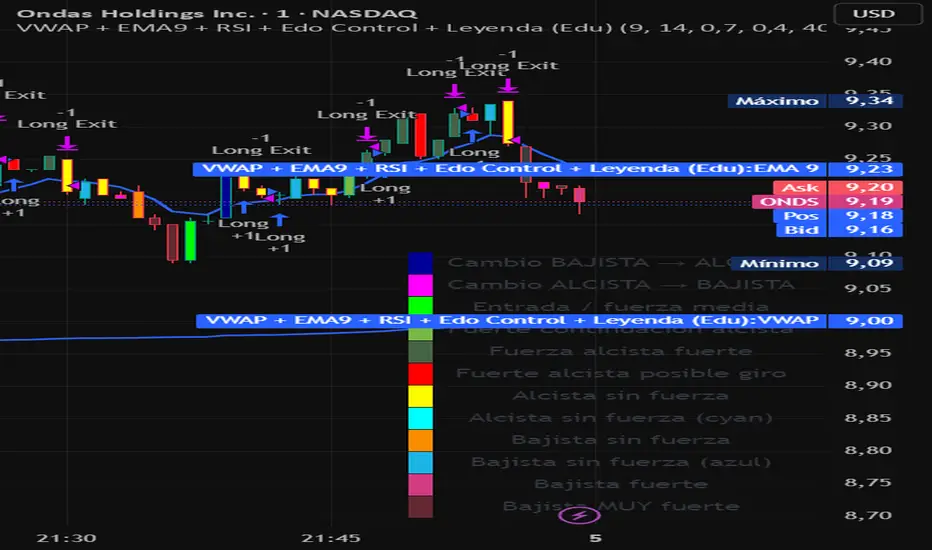
VWAP + EMA9 + RSI + Edo Control (Edu)VWAP + EMA9 + RSI + Edo Control (Edu)
A complete intraday scalping system that combines institutional levels, fast trend signaling and enhanced candle-color analysis for maximum clarity and confirmation.
This indicator includes:
1. VWAP (Volume Weighted Average Price)
The institutional reference line used to determine value zones, liquidity bias and directional pressure.
2. EMA9 (Fast Exponential Moving Average)
A micro-trend guide that reacts quickly to short-term movements and improves timing on pullback entries.
3. RSI (Relative Strength Index)
A clean momentum filter using the classic >50 (bullish) and <50 (bearish) bias.
Edo Control – Advanced Colored Candle System
This version integrates Edo Control, a custom candle-color engine that visualizes market strength shifts based on Williams %R, directional movement and ADX behavior.
Each candle color represents a different market condition, such as:
Trend acceleration
Trend weakening
Possible reversals
Momentum spikes
Bullish or bearish pressure
Transition zones
A built-in movable legend explains the meaning of each color directly on the chart, so traders can identify conditions instantly without guessing.
Why this indicator works
The combination of VWAP + EMA9 + RSI + colored candle strength creates a multi-layer confirmation system that cuts noise and highlights only meaningful setups.
Designed for 1m, 3m, 5m charts, but also effective on higher timeframes.
Suitable for: stocks, indices, futures, forex, crypto.
NYAM Trend PullbackThis is an trend-following strategy designed for trades taken during New York Morning. It aims to capture trend continuations by entering positions when price aligns with the dominant trend relative to a Exponential Moving Average (EMA).
If price is above the EMA then it is bullish and enters long, and if its below the EMA it is bearish and enters a short.

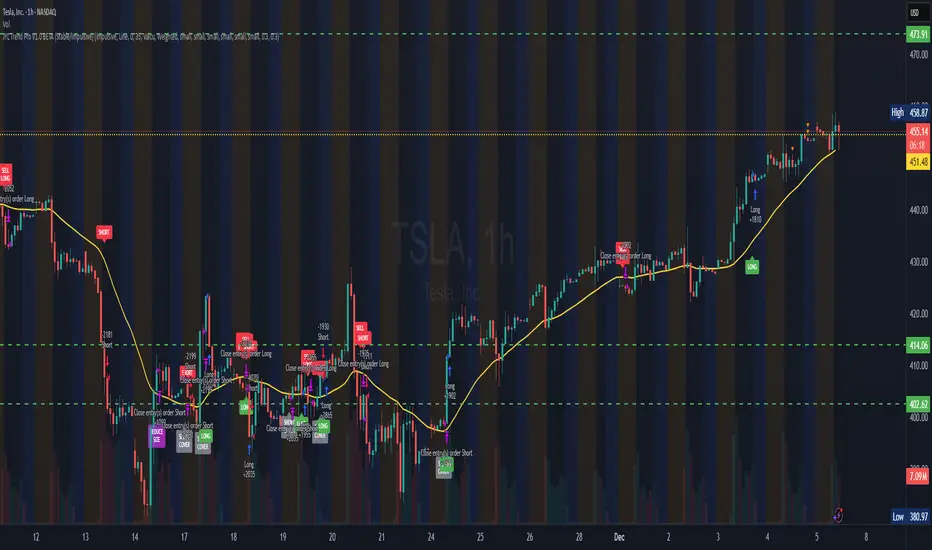
JYL Trend Pro V1.0 BETANASDAQ:TSLA
JYL Trend Pro V1.0 is a rule‑based trend‑following strategy built on a proprietary smoothed price engine.
It focuses on clear trend states and position management rather than classic indicators, and can be used on both long and short side depending on the user’s settings.
Three Signal Modes
1. Stable Mode
Stable mode is the “classic” version of the system.
It reacts only when the trend state clearly flips, and then manages the position with simple rules:
First strong bullish state → open / add to long
First strong bearish state → open / add to short
When the trend weakens but does not fully reverse, the strategy can reduce position size (partial exit)
When the trend flips in the opposite direction, the strategy fully exits the existing position
This mode is designed for traders who prefer fewer signals and smoother equity curves.
2. Impulsive Mode
Impulsive mode keeps the same core logic, but allows the strategy to react earlier and manage exits more actively:
Opportunistic early entries around strong moves
Protective “early stop” logic for those aggressive entries
Segment‑based partial exits after extended bullish or bearish runs
Fast full exits when momentum fades quickly or the trend flips
This mode is aimed at users who accept more trade frequency in exchange for faster reactions.
3. IMP+ Mode (Impulsive Plus)
IMP+ is the advanced version of Impulsive mode. It keeps all core behavior and adds extra controls for power‑users:
Adjustable presets for how early the system can enter a move
Adjustable presets for how quickly early entries are cut if they fail
Smarter add‑ons after a bullish / bearish segment, so adds can occur either at the next strong signal or on a “pullback‑type” bar inside the ongoing trend
Flexible multi‑level partial‑exit packages after a strong run
Additional “emergency exit” logic that can flatten positions when price opens too close to the previous bar after a strong trend segment
All of these options are exposed as presets in the Inputs tab, so users can experiment without touching code.
Signals & Usage
The strategy prints clear labels on the chart:
LONG / SHORT – open or add to position
REDUCE SIZE – partial profit‑taking or risk reduction
SELL LONG / SHORT COVER – full exit of long / short positions
A trade‑direction filter lets you run the system as long‑only, short‑only, or long & short.
This script is provided for educational and research purposes only.
It is not financial advice and does not guarantee any future performance. Always test on a demo account, adjust risk to your own situation, and consult your broker or advisor before trading live.
Internally, this strategy is based on the private JYL Trend Pro rule set and risk‑management framework.

PSAR with EMA FilterThis indicator combines the Parabolic SAR (PSAR) with an EMA trend filter to generate more accurate trend-following signals.
PSAR helps identify potential trend reversals and trailing stop levels, while the EMA ensures that trades are aligned with the overall market direction.

RSI with EMA FilterThis indicator combines the Relative Strength Index (RSI) with a trend-filtering Exponential Moving Average (EMA) to generate higher-quality momentum signals.
RSI identifies overbought and oversold market conditions, while the EMA confirms the overall trend direction, helping traders avoid false signals in choppy markets.

BTC Trend-Following Strategy (Limited Version)This is a trend-following strategy designed specifically for Bitcoin (BTC).
It has demonstrated consistent performance and profitable opportunities over multiple years of historical data.
The strategy aims to capture major trends while managing risk effectively, making it suitable for traders looking for a systematic BTC trading approach.

Pro Bollinger Bands Strategy [Breno]This strategy excels in highly volatile financial instruments, including cryptocurrencies, high-beta stocks, commodity futures, and certain exchange-traded funds (ETFs) that exhibit clear mean-reversion characteristics around their Bollinger Bands. The system's ability to utilize scaling (position averaging) and an ATR-based stop loss makes it particularly effective in markets with significant price swings, allowing the trader to capture profits from price extremes while managing increased volatility-related risk.
Core Strategy Logic
This Strategy implements a comprehensive trend-following and mean-reversion strategy primarily leveraging the Bollinger Bands (BB) indicator for entry and exit signals, complemented by an Average True Range (ATR)-based Stop Loss mechanism and an optional EMA filter. It is designed with robust features for capital management, including configurable leverage and a sophisticated position averaging (scaling) system.
Long Entry: A long position is initiated when the closing price crosses over the Lower Bollinger Band (ta.crossover(close,lowerBB)). This signals a potential mean-reversion opportunity following a price dip.
Short Entry: A short position is initiated when the closing price crosses under the Upper Bollinger Band (ta.crossunder(close,upperBB)). (Note: Short entries are disabled by default in the script inputs).
Exit Conditions (Profit Target): Long positions aim to exit upon interaction with the Upper Bollinger Band. Users can select from three exit methods:
"Close When Touch": Exits when close≥upperBB.
"Close Above then Below": Exits when the previous close was above the upper band, and the current close is below it (a reversal signal).
"High Above": Exits when high>upperBB. The strategy features an optional profitOnly setting, which restricts all exits to only occur if the trade is currently in profit (i.e., close is above the strategy.position_avg_price for longs).
Key Features and Customization
Bollinger Bands & Filters -
Customizable BB Parameters: The Length and Deviation of the Bollinger Bands are fully adjustable, allowing users to fine-tune the sensitivity of the entry and exit signals.
Optional EMA Filter: An optional EMA Filter can be enabled to align entries with the prevailing trend, where a Long entry is only permitted if close≥EMA(EmaFilterRange).
Risk and Capital Management -
Equity Allocation: Position size is dynamically calculated based on a Percentage of Equity (capitalPerc) combined with the set Leverage multiplier.
Dynamic Stop Loss (ATR-Based):
An optional Stop Loss (SL) is calculated using a multiple (slAtrInput) of the Average True Range (ATR).
The SL is set relative to the entry price upon trade activation, providing a volatility-adjusted risk management layer.
Position Averaging (Scaling): The script supports the addition of multiple units (pyramiding) to an existing position based on three user-selected criteria:
"No": No averaging.
"Percent": Adds to the position if the price has dropped by a set percentage (addPct) from the average price.
"ATR": Adds to the position if the current price is significantly below a calculated ATR-based support level from the average price.

XRP Non-Stop Strategy (TP 25% / SL 15%)XRP Non-Stop Strategy (TP 25% / SL 15%) is a continuous long-side trading system designed specifically for XRP. The strategy uses an EMA-based trend filter (EMA20/EMA50) to confirm bullish conditions before entering a long position. Each trade applies a fixed +25% Take Profit target and a −15% Stop Loss, calculated dynamically from the entry price.
When a trade closes—whether by TP or SL—the strategy automatically re-enters on the next qualifying signal, enabling uninterrupted position cycling.
Features include:
• EMA-based trend confirmation
• Dynamic TP/SL visualization on the chart
• Clear BUY and EXIT markers
• Dedicated alert conditions for automation

XRP Non-Stop Strategy (TP 25% / SL 15%)This strategy performs continuous automated trading exclusively on XRP. It opens long positions during favorable trend conditions, using a fixed Take Profit target of 25% above the entry price and a fixed Stop Loss of 15% below the entry. Once a trade is closed (either TP or SL), the strategy automatically re-enters on the next valid signal, enabling uninterrupted trading.
The script includes:
Dynamic Take Profit & Stop Loss lines
Optional EMA trend filter
Visual BUY and EXIT markers
TradingView alerts for automation or notifications
This strategy is built for traders who want a simple, price-action-driven system without fixed price levels, relying only on percentage-based movement from each entry.
