EMA Position AlertDescription
EMA Position Alert is a comprehensive trend analysis tool designed to help traders instantly identify the market's direction and strength relative to key Exponential Moving Averages (EMAs). By combining visual trend lines with a real-time data dashboard, this indicator provides a clear snapshot of the current price action across short, medium, and long-term horizons.
Whether you are a scalper looking for short-term momentum or a swing trader identifying major trend reversals, this tool simplifies the complex relationship between price and moving averages.
Key Features
1. Multi-EMA System The indicator plots four essential EMAs commonly used by institutional and retail traders:
EMA 21: Short-term trend/momentum.
EMA 55: Medium-term trend.
EMA 100: Major support/resistance level.
EMA 200: Long-term trend filter.
Visual Aid: The EMA lines change transparency automatically. They appear brighter/solid when the price is above them (bullish) and more transparent/faded when the price is below them (bearish).
2. Real-Time Information Dashboard A customizable table (displayed in the top-right corner) provides live data for the current bar:
Status: Clearly indicates if the price is "Above ▲" (Bullish) or "Below ▼" (Bearish) for each specific EMA.
Distance (%): Calculates the percentage distance between the current closing price and each EMA. This is crucial for identifying overextended moves (mean reversion opportunities) or tight consolidation.
Overall Trend Summary:
Strong ★★: Price is above all EMAs (21, 55, 100, 200).
Building ★: Price is above the long-term EMAs (55, 100, 200) but may be testing the short-term trend.
Weak ▼: Price is below all EMAs.
Ranging: Mixed signals (price is sandwiched between EMAs).
3. Custom Alerts Never miss a move. The script comes with built-in alert conditions compatible with TradingView's alert system:
Breakout Alerts: Trigger an alert when price crosses above specific EMAs (21, 55, 100, or 200).
Strong Trend Alert: Trigger an alert when the price successfully holds above all EMAs, signaling a strong bullish phase.
Settings
Show Status Table: Toggle the dashboard on or off.
Table Transparency: Adjust the background opacity of the dashboard to fit your chart theme.
Line Width: Adjust the thickness of the EMA lines for better visibility.
How to Use
Trend Following: Look for the "Strong ★★" status in the dashboard. When the price is above all EMAs and the EMAs are fanning out, it indicates a strong uptrend.
Pullbacks: If the trend is "Strong" but the price drops to test the EMA 21 or EMA 55, look for support bounces.
Mean Reversion: Watch the Distance %. If the distance becomes historically large, the price may be overextended and due for a correction back to the mean.
Consolidation: When the status shows "Ranging" and the Distance % is very low (near 0.00%), a breakout move is likely imminent.
Medie mobili

GRAM SCALP_PDH/PDL/P.POC/P.VAL/P.VAH_9/21EMA)This is a simple scalping strategy for futures markets (e.g., MNQ/ES), designed for prop firm challenges that require consistency and good R/R. It focuses on intraday trades during NY session (9:30 ET onward), using bias, EMAs, and key levels from prior Globex session (18:00–17:00 ET).
Goal: Set-and-forget limit orders in bias direction, aiming for small, consistent wins.
Daily Bias (Trend Detection):
Based on the first 15-min candle (9:30–9:45 ET).
If close > open (green): LONG ONLY bias – background shades green, label says "LONG ONLY".
If close < open (red): SHORT ONLY bias – background shades red, label says "SHORT ONLY".
Trade only in bias direction to avoid counter-trend risks. No bias? Sit out.
EMAs for Entries/Confirmation:
9 EMA (orange): Fast line for short-term trend/pullbacks.
21 EMA (purple): Slower line for overall direction.
Entry idea: Wait for price to pull back to 9/21 EMA in bias direction, then enter on bounce/break (e.g., long above EMA on green bias).
Use as dynamic support/resistance – don't trade if price is far from EMAs.
Key Levels from Prior Session (Globex 18:00–17:00 ET):
PDH (Previous Day High): Gray line – potential resistance/target for longs.
PDL (Previous Day Low): Gray line – potential support/target for shorts.
Volume Profile (VP):
POC (Point of Control, orange): Highest volume price – strong magnet; price often returns here.
VAH (Value Area High, fuchsia circles): Top of 70% volume range – resistance; break above = bullish.
VAL (Value Area Low, fuchsia circles): Bottom of 70% volume range – support; break below = bearish.
Use levels for entries (e.g., bounce off VAL for long), stops (behind level), or targets (e.g., aim for POC/VAH).
Trading Rules:
Session: NY open (9:30 ET) to close (16:00 ET). Avoid news/high volatility.
Bias Only: After 9:45 ET, check label/color – trade longs on green, shorts on red.
Entries: Set limit orders at key levels/EMAs in bias direction. E.g., long bias: Buy limit at VAL or EMA pullback.
Risk Management:
Stop Loss: Behind nearest level (e.g., below VAL for long) or fixed 10-20 ticks.
Take Profit: 1:2 risk-reward or at next level (e.g., PDH/POC).
Position Size: 1-2% risk per trade; max 5 trades/day for prop rules.
Exits: Trail with EMAs or exit at EOD. No overnight holds.
Avoid: Choppy markets, gaps through levels, or no clear bias.
Why It Works:
Bias filters bad trades; EMAs confirm momentum; VP/PDH/PDL provide high-probability zones based on where volume/price settled overnight.
Simple, mechanical – ideal for prop challenges (rules on drawdown, consistency).
Backtest on 2-min charts; aim for 60%+ win rate on small scalps (5-20 ticks).
Customize in indicator settings (e.g., VP bin size, line colors). Test on demo before live. Not financial advice – trade at own risk.10 web pages

Sal EMA Cloud Trend Labels + Buy/Sell Signals (Real-Time Only)Sal EMA Cloud Trend Labels + Buy/Sell Signals — Real-Time Trend Precision
Unlock cleaner trend detection and faster trade decision-making with the Sal EMA Cloud — a lightweight yet powerful EMA-based trending system designed for intraday and swing traders.
This indicator combines the reliability of the EMA trend model with an intuitive visual experience:
✅ Real-Time Buy/Sell Signals
Instant label-based alerts appear the moment the EMAs cross — giving you clear momentum-shift entries and exits.
✅ Dynamic EMA Cloud
A color-shifting cloud forms between the EMAs, turning green in bullish conditions and red during bearish phases, making trend direction obvious at a glance.
✅ Trend Status Table
A compact, auto-updating table displays the current trend ("Bullish," "Bearish," or "Neutral") in the corner of your chart for quick confirmation.
✅ Clean, Minimal Overlay
No clutter. Just EMAs, a cloud, and actionable signals that work seamlessly across any timeframe.
If you want a straightforward, real-time trend tool that helps you stay on the right side of momentum — this indicator delivers exactly that.

Triple 9 Bias filter Triple 9 Bias – Precision Multi-Timeframe Directional Filter
Technical Overview
The Triple 9 Bias is a precision multi-timeframe directional filter built exclusively for 5-minute (and lower) trading.
It stacks three EMA-9 trend directions (4H + 1H + 15m) as Primary confluence and uses only the 4H RSI-14 as Secondary confirmation.
Integrity Check: Zero repaint · Zero lookahead · Works identically on any chart timeframe.
The Trading Rule (Simple)
Long Trades: Only trade longs when all three EMA-9s are UP + 4H RSI > 50
Short Trades: Only trade shorts when all three EMA-9s are DOWN + 4H RSI < 50
Otherwise — stand aside.
Display Components
A. Plotted Higher-Timeframe EMAs (No Repainting)
All values are pulled from closed higher-timeframe bars.
4H EMA 9 (Red step-line)
1H EMA 9 (Purple step-line)
15m EMA 9 (Orange step-line)
B. Locked Dashboard (Bottom-Right)
Clean table split into Primary and Secondary sections for instant bias reading.
Colour Logic:
🟢 Lime = UP / BUY
🔴 Red = DOWN / SELL
Background Logic:
Full Green: Only when all three EMA-9s are UP
Full Red: Only when all three EMA-9s are DOWN
Gray: Otherwise = no trade
Indicator Breakdown
3.1. Primary Confluence – EMA 9 Slope
4H EMA 9 direction (compared 10 bars back)
1H EMA 9 direction (compared 6 bars back)
15m EMA 9 direction (compared 6 bars back)
3.2. Secondary Confluence
4H RSI-14 vs 50 level (BUY if >50, SELL if <50)
High-Probability Signal: When Primary = all three “UP” and Secondary = “BUY” → highest-probability bullish bias (and vice-versa for bearish).

MACD Divergence auto displayed on chart, with alertsMACD Pivot Divergence Detector
This tool identifies MACD histogram divergences based on confirmed pivot highs and lows.
Instead of comparing swing points on the MACD line, this script focuses specifically on the histogram, which measures momentum shifts between MACD and Signal.
How it works
The script detects confirmed pivots using a two-bar swing structure.
When price breaks above a previous pivot high, the script compares the MACD histogram value at that pivot to the current histogram value:
• If price makes a higher high while the histogram makes a lower high, a potential bearish divergence is marked.
The reverse logic is applied for bullish divergence when price breaks below a pivot low.
What makes this script unique
It uses pivot-confirmed histogram values, not lookback-based divergence.
It evaluates divergence only at actual highs/lows, reducing false positives.
It marks divergence directly on the candles for visual clarity.
Alert conditions are included for automated detection.
How to use
Bullish signals may highlight potential momentum loss in downtrends; bearish signals may highlight momentum loss near highs. Divergence does not guarantee reversal and should be combined with broader context, structure, or trend analysis.

Price Action - EMA ClusterAligned with Al Brooks' multi-timeframe analysis in his series, this plots three EMA20 lines on 5m charts: current (line), 15m (stepline), and 60m (stepline). Visible only on 5m timeframe for clarity. EMAs act as dynamic trend channels—price above signals bull bias, below bear. Test extremes: Pullbacks to EMA often offer second-leg entries in trends. Customize colors for better visualization of always-in direction.

EP CPR Future CPR + 4 MA
1. CPR Trend Direction(Bias):
Bullish: If the current day's price is trading above the TC, it suggests a strong bullish trend where the CPR acts as a support zone.
Bearish: If the current day's price is trading below the BC, it suggests a strong bearish trend where the CPR acts as a resistance zone.
Range-Bound/Consolidation: If the price is trading within the CPR lines, it indicates a lack of clear directional bias and suggests a likely sideways or accumulation phase.
2. Moving average Trend Identification
Uptrend: If the price is above a moving average (and the MA line is sloping up), it confirms a bullish trend.
Downtrend: If the price is below a moving average (and the MA line is sloping down), it confirms a bearish trend.
Crossovers (Trading Signals)
A popular strategy involves using two moving averages—a short-term MA (e.g., 50-period) and a long-term MA (e.g., 200-period).
Golden Cross (Bullish Signal): Occurs when the shorter-term MA crosses above the longer-term MA.
Death Cross (Bearish Signal): Occurs when the shorter-term MA crosses below the longer-term MA.

Strict Weekly 50/200 WMA Signals True Weekly Only-Strict Weekly 50/200 WMA Signals True Weekly Only => also on other time frames than weekly (like daily, etc.) always indicates the indicators based on the weekly chart
-especially useful for Crypto
-gives buy and sell signals when the 200 WMA or the 50 WMA are crossed
-typically above the 50 WMA indicates a bull market
-reaching below the 200 WMA indicates a bear market and typically for investors with a longer time frame (>2-4 years) a good entry point

Ata✨ScalpingТолько для часовика! Скальп на движении.
Ata✨Scalping is a multi-functional scalping indicator for TradingView.
It features customizable moving averages (SMA, EMA, WMA, HMA), a visual volume profile, and automatic support/resistance level detection with strength ratings.
The script is designed for active traders and scalpers, providing clear visual cues for trend, volume, and key price levels, as well as optional breakout alerts.

S1XP4C Bear Klr 2.1.1BTC|USD 8d
Double EMA and SMA lines with a subtle offset to show bearish and bullish changes on an 8 day chart and a WMA to show extreme lows.


smartAitrade Complete FocusTrendPajinko-SmartAiTrade Complete is an all-in-one price-action technical system designed for high-precision entries, intelligent trade management, and fully automated exit logic.
The system combines RSI swings, advanced divergence detection, ATR-based PJK Bands, smart retest logic, swing-break POI zones, trend filters (ADX), and automated breakeven/TP management into a single integrated indicator.
It is built to support traders who want structured, rule-based entries with minimal discretion, while still maintaining the flexibility of price-action behavior.
🔍 Core Components
1. RSI System
Standard RSI for overbought/oversold levels.
RSI Swing High/Low detection (using pivots).
Used for:
momentum confirmation
swing structure alignment
divergence detection filters
2. Advanced Divergence Engine
The indicator features a high-accuracy divergence module that detects:
• Bullish Divergence
Price makes a lower low
RSI makes a higher low
Pivot distances must fall within a valid bar-range
Optional filter: RSI must be in oversold zone
• Bearish Divergence
Price makes a higher high
RSI makes a lower high
Optional filter: RSI must be in overbought zone
You can choose to draw divergence lines on either:
RSI only
Price chart
Both
This system is optimized for low repaint and filters weak divergence signals.
3. ATR-Based PJK Bands System
A volatility-adaptive band system similar to Keltner/Bollinger hybrids:
Middle line uses SMA/EMA/VWMA
Upper/lower bands = middle ± ATR × multiplier
Bands detect:
momentum breakouts
band touch signals
high-probability reversal zones
Buy signal:
Price touches lower band and shifts upward
Sell signal:
Price touches upper band and shifts downward
4. Smart Retest System
After a momentum breakout or band touch signal:
A “smart retest zone” is created
The system waits for price to come back to the zone
If retest occurs within a user-defined timeout window, the signal is validated
Used to avoid chasing entries and reduce false breakouts
5. Swing Break & POI Zones
The indicator automatically detects price-swing structure:
Swing High Break → Sell POI box created
Swing Low Break → Buy POI box created
POI zones:
Represent potential liquidity pockets
Drawn with customizable height and width
Work as target areas or confirmation zones
6. ADX Trend Filter
ADX trend strength filter ensures signals are valid only when:
Trend strength > threshold (default 20)
Avoids signals in flat, low-volatility markets
7. Auto Trade Management (Breakeven System)
Fully automated exit logic:
TP1 distance set in pips
Once TP1 is reached → move Stop Loss to breakeven + offset
Additional option:
Close all open positions automatically when trend bias changes
Everything works even with multiple open trades.
8. Dashboard & Visual Interface
The indicator includes a clean dashboard showing:
Trend condition
RSI status
Advanced divergence status
Band and swing conditions
Active signals
Breakeven status
Total signals statistics
All visual components can be enabled/disabled individually.
🎯 Trading Philosophy
The system is built on three core principles:
1. Confirm Trend
ADX + ATR Bands define direction and strength.
2. Identify High-Probability Reversal or Continuation Zones
Smart Retest + Swing Structure + POI + Divergence.
3. Automate the Exit
Breakeven, TP1, and automatic closing keep emotions out of the decision.

BTC GOD — DEFINITIVE BTC MULTI INDICATORBTC GOD — The Ultimate Bitcoin Cycle Indicator (2025 Edition)
The one indicator every serious BTC holder and trader has been waiting for.
A single script that perfectly combines the 5 most powerful and accurate Bitcoin indicators ever created — all 100 % official versions:
- Official Pi Cycle Top (LookIntoBitcoin) → in 2013, 2017 & 2021 (3/3 hits)
- Official MVRV Z-Score (Glassnode / LookIntoBitcoin) → every major bottom (2015, 2018–19, 2022)
- Dynamic Bull/Bear background (red bear-market when price drops X % from cycle ATH + monthly RSI filter)
- Monthly Golden/Death Cross (50-month EMA vs 200-week EMA) → huge, unmistakable signals
- SuperTrend + 200-week EMA + 50-month EMA
- Cycle ATH/ATL tracking with flashing alert in the table when new highs/lows are made
- Exact days to/from the next halving + optimal accumulation zone (200–750 days post-halving)
- Fully customizable inputs for experienced traders
Zero repainting. Zero errors. Works on every timeframe.
This is the indicator used by people who truly understand Bitcoin’s 4-year cycles.
If you could only keep ONE Bitcoin indicator for the rest of your life… this would be it.
Save it, test it, and you’ll instantly see why it’s called BTC GOD.
Built with love and obsession for Bitcoin cycles.
Last update: November 2025

VIDYA + MA Cloud + Volume Chaser Co-Pilot + Duration+TRPThis indicator has been designed to automate entries and exits, combining a unique set of volume indicators for entry conditions, and another set of probability indicators for exit conditions.
Entry Conditions:
-VIDYA (Volumatic Variable Index Dynamic Average) Indicator for the over-arching trend
-EMA/RMA cloud is the dynamic trend confirmation. A crossover confirms entry conditions when in-line with the VIDYA trend.
-MTF VIDYA Dashboard is our visual confirmation of volume
-Co-pilot monitors LTF volume and exits or re-enters depending on the 3 LTF confluences
Exit Conditions:
-Trend Duration Forecast - Altered the Hull MA to calculate previous VIDYA trend lengths and averages it out to forecast current trend
-Trend Reversal Probability - Altered to work with the duration forecast. It's the primary source of information for exits which overrides the VIDYA trend (which can be lagging)
-Co-Pilot monitors delta volume changing on the LTF's for quick exits
The trend length probability bar is driven by trend length, not reversal probability. Coloured green for early trends, orange for mature trends, and red for expired trends. This gives a visual for when to look for other exit confluences, especially when a trend has exceeded its average duration and is aligned with the reversal probability %.
Candles are coloured dependent on the EMA/RMA cloud. Green above, White within, Red below.

13 / 26 / 52 SMA Overlay13 / 26 / 52 SMA Overlay showing how short term is performing relative to long term.

Sequential MACD 0.5+ & MA Cloud StrategyThis indicator provides sequential buy and sell signals based on a robust set of trend-following and momentum conditions:
Buy Signal Logic:
Momentum: Both the MACD line and the Signal line are above the 0.5 threshold, indicating strong bullish momentum.
Crossover: A bullish MACD crossover (MACD above Signal line) has occurred near the zero line, suggesting the start of a new, healthy momentum wave.
Trend Filter (4H TF): The current price must be above the 21 and 50 EMAs on the 4-hour timeframe.
Price Action: The current candle must be green (closing higher than open).
Sequential Logic: A buy signal is only generated if a position is not already active.
Sell Signal Logic:
Momentum Reversal: MACD line is below the Signal line (negative histogram).
Price Action: The current candle must be red.
MA Cloud: The price is below the 9 and 21 EMA Cloud.
Sequential Logic: A sell signal is only generated if a buy signal was previously active.
This comprehensive filter system aims to capture strong, confirmed moves while avoiding noisy signals against higher-timeframe trends.

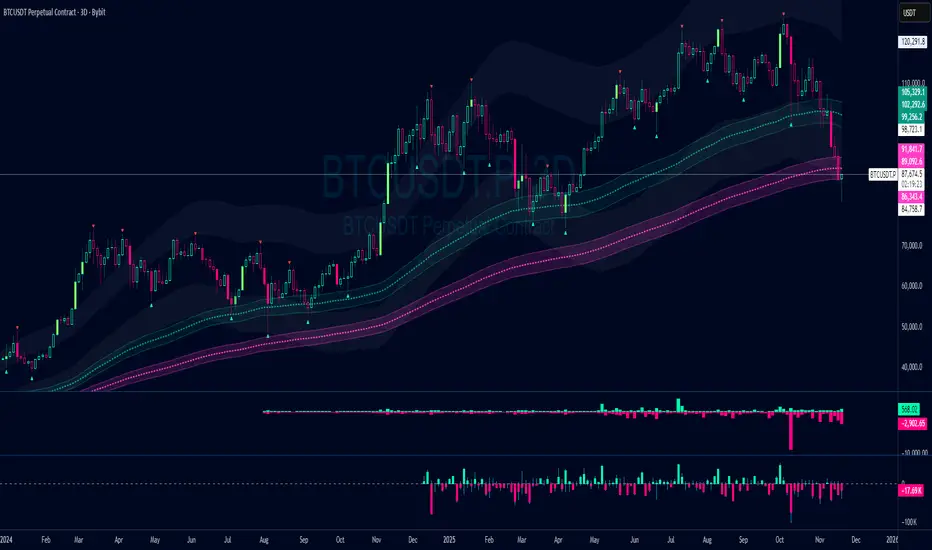
Damo's Custom EMA Bands 1.0I was making these manually for a long time. They just give me more peace of mind when I'm using EMAs. They feel more like a net catching price. These are easy to make. All they are is 3 EMAs with the Source at High, Low and (H+L)/2 for the midpoint.
I find on a 3-Day chart on BTC the 100 EMA is great for telling what trend we're are in.
i.postimg.cc
MarketSmith / MarketSurge Style VolumesPurpose
Emulates MarketSmith-style volume analysis in TradingView.
Focused on abnormal volume, institutional footprints, and volume vs. average.
Core Display
Plots a volume histogram with a volume moving average (daily or weekly length).
Optional truncation: caps bars at 2× average volume for cleaner scaling.
Bar colors:
Up/down based on current vs. previous close.
Optional special colour for low relative volume (10-bar lows).
Highest-Volume Logic (HVE / HV1)
Detects:
HVE – Highest Volume Ever.
HV1 – Highest Volume in Over a Year (252D / 52W / 12M).
Labels key peaks with:
“HVE” / “HV1” tags.
Optional shares traded (K/M/B) and % above volume MA.
Uses pivot logic over a configurable Peak Length to anchor volume peaks.
Current Bar Labels
On the latest bar, shows:
Formatted volume (K/M/B).
Volume buzz = % above/below average volume.
Buzz label colored green/red depending on positive or negative reading.
Volume Buzz & Trend Context
volBuzz = 100 * (vol / MA – 1) plotted as a separate series.
Highlights stretches of unusually high or low activity relative to the norm.
Up / Down Volume Ratio
Sums up-volume and down-volume over the last 50 bars.
Computes Up/Down Volume Ratio = sumUp / sumDn to gauge buying vs. selling pressure.
Info Table (Top-Right)
Optional small table showing:
Avg Volume (K/M/B).
Avg Dollar Volume (close × MA).
U/D Volume Ratio.
Optional current volume and current buzz with positive/negative colors.
Overall
Not a signal system—it's a volume-reading assistant.
Helps identify true standout volume, institutional spikes, and quiet vs. aggressive trading conditions at a glance.

MarketSmith IndicatorPurpose
Recreates key MarketSmith/IBD analysis tools directly in TradingView.
Combines technical, price-action, RS, and fundamental data into one system.
Price View (MarketSmith-Style Candles)
Full-body bars colored by close relative to prior close.
Clean, minimalist style for clearer price interpretation.
Moving Averages
Daily MAs: 10-day, 21-day, 50-day, 200-day.
Weekly MAs: 10-week, 20-week, 30-week, 40-week.
Auto-switches between daily/weekly versions.
Fully customizable SMA/EMA options.
Relative Strength (IBD-Style RS Rating)
RS line plotted against chosen benchmark (default SPX).
Optional MAs, RS new highs/lows markers.
Percentile-based IBD 1–99 RS Rating using seeded market data.
Shows real leadership strength at a glance.
Pattern Recognition
Detects cup-with-handle, double bottoms, flat bases, and broad consolidations.
Tracks pivots, base depth, length, symmetry, and breakout levels.
Draws dynamic base outlines, buy-point boxes, and stop zones.
Includes Weekly Tight Closes signals.
Fundamental Panel (EPS & Sales)
Displays quarterly EPS, sales, YoY/QoQ growth, surprises, ROE, margins.
Eight-quarter weekly table or four-quarter daily headband.
MarketSmith/MarketSurge visual themes.
Earnings arrows with EPS/sales % change.
Overall
A complete growth-trading analysis environment.
Not a signal generator—an integrated decision-support and chart-reading tool.

Mark Minervini SEPA Methodology Trading ToolCore Purpose
Visual toolkit reflecting Mark Minervini’s SEPA trading principles.
Helps identify trend strength, quality consolidations, and avoid overextended entries.
Moving Average Framework
Plots key EMAs/SMAs (5, 10, 20, 50, 150, 200).
Shows clean trend alignment and price respect of key levels.
Trend Template Highlight
Shades area between SMA 150 & SMA 200 when all Minervini Trend Template conditions are met:
Price above 150 & 200 SMA
SMA 150 > SMA 200
Rising 200 SMA
Price above SMA 50
Price 30% above 52-week low
Price within 25% of 52-week high
Daily Extended Detector
Uses ATR to warn when price is too far above the 10-day EMA.
Shaded zone indicates high-risk, overextended conditions.
Consolidation Tools
Weekly Tight Closes Detector: flags 3-week volatility contraction zones.
Inside Day Detector: marks inside bars and emphasizes back-to-back inside days.
Swing-Structure Markers
Automatically labels pivot highs and lows.
Optional %-change between pivot points for trend-rhythm analysis.
Overall Function
A focused, rules-based visual assistant designed to keep charts aligned with Minervini’s strict trend, risk, and consolidation standards.

EMA & MA Alert Strategies8 Trading Strategies for Alerts:
Strategy 1: EMA Golden Cross / Death Cross
EMA1 crosses above EMA2 → bullish momentum
EMA1 crosses below EMA2 → bearish momentum
Stronger: EMA1 crosses EMA3
Strategy 2: MA Golden Cross / Death Cross
MA1 crosses above MA2 → trend reversal up
MA1 crosses below MA2 → trend reversal down
Strategy 3: EMA Alignment (Trend Direction)
Bullish: EMA1 > EMA2 > EMA3 (uptrend)
Bearish: EMA1 < EMA2 < EMA3 (downtrend)
Alerts when alignment changes
Strategy 4: Price vs EMA (Support/Resistance)
Price breaks above EMA2/EMA3 → bullish breakout
Price breaks below EMA2/EMA3 → bearish breakdown
Strategy 5: EMA vs MA Crossover
EMA1 crosses above MA1 → momentum exceeds trend
EMA2 crosses above MA2 → stronger momentum signal
Strategy 6: Pullback to EMA (Buy the Dip)
Price pulls back to EMA2/EMA3 and bounces → buy signal
Useful for entry during uptrends
Strategy 7: EMA Squeeze/Expansion
EMAs converging → potential breakout
EMAs expanding → trend acceleration
Strategy 8: Multi-Timeframe Confirmation
Price above all EMAs and MAs → strong uptrend
Price below all EMAs and MAs → strong downtrend

Multi Emas x7 , time frasmes x7
Source Selector per Line: Now, in each configuration line, you will see a dropdown menu set to close (by default). You can change this to high, low, open, hl2, etc., individually for each of the 14 averages.
Quantity: You have the 7 for the current chart and the 7 for the MTF ready to use with the default values (8, 18, 20, 30, 50, 100, 200).
Visual Differentiation:
Current Chart: These appear as standard solid lines.
MTF (Second Timeframe): These appear as lines of small circles. This is very useful to avoid confusing the 1-Hour 200 EMA with the 4-Hour 200 EMA when you have both on the screen.

EMA 5-13-21-34-55-89-144-233Fibo sayıları olan 5-13-21-34-55-89 -144-233 dan oluşan EMA'ları göstermek için hazırlanmıştır.
