SterlCore FX Matrix [JOAT]
SterlCore FX Matrix is a multi-timeframe forex indicator that integrates market structure analysis, central bank policy proxies, currency strength correlation, session-based liquidity tracking, and volatility diagnostics into a single overlay system.
Note: This script is published as invite-only. Access requires authorization through the script's access control settings.
Why Invite-Only: The source code is protected to preserve proprietary calculation methods, composite scoring algorithms, and multi-module integration logic. The indicator combines several analytical approaches in a specific configuration that represents significant development effort. Invite-only access allows controlled distribution while maintaining the integrity of the implementation.
This Script has so much custom settings you can choose upon, to make it even more organized and tailored to your needs!
Custom settings with HeatMap and signals tailored to the daily timeframe and currency pair
## Core Functionality
This indicator addresses the challenge of synthesizing multiple analytical dimensions in forex trading. Currency markets operate across multiple timeframes simultaneously, with central bank policy shifts, cross-pair correlations, and session-specific liquidity patterns all influencing price action. Most indicators focus on a single dimension; this script attempts to integrate several.
What This Script Does:
Multi-timeframe structure analysis using synchronized EMAs across strategic (daily), tactical (4-hour), and execution (hourly) timeframes
Central bank policy pressure assessment through normalized currency index proxies
Real-time currency strength matrix tracking eight major currencies (USD, EUR, GBP, JPY, AUD, CAD, CHF, NZD)
Cross-pair correlation monitoring using configurable reference pairs
Session-based VWAP calculations with drift and range metrics for Asia, Europe, and US trading windows
Market structure detection including break-of-structure (BOS) confirmation, liquidity sweep identification, and RSI-based divergence alerts
Composite macro confluence score combining all modules with configurable weights
---
## Technical Architecture
### Multi-Timeframe Structure Lattice
The indicator calculates exponential moving averages (EMAs) across three timeframes:
Strategic EMA (default: Daily timeframe, 96-period EMA) — Anchors to longer-term monetary drift and macro flows
Tactical EMA (default: 4-hour timeframe, 55-period EMA) — Captures rotational pressure during positioning for economic data or policy events
Execution EMA (default: 1-hour timeframe, 21-period EMA) — Tracks microstructure in real time
An adaptive ATR-based channel surrounds the execution EMA to define a "value corridor" for entry consideration. Break-of-structure (BOS) logic requires price to close beyond prior swing highs/lows by a configurable ATR percentage threshold to reduce false breakouts.
### Policy Gradient & Carry Intelligence
The script uses currency index proxies (defaults: FX_IDC:EURUSD and FX_IDC:USDJPY ) to approximate central bank policy pressure. These proxies are smoothed via EMA and normalized over a lookback period.
The carryComposite calculation blends:
Normalized policy spread between base and quote currency proxies
Policy drift (difference between tactical and macro timeframe policy spreads)
Carry acceleration (rate of change in policy spread)
Carry opportunity signals appear when the composite exceeds a threshold and aligns with structure bias and currency strength dispersion.
### Currency Strength Matrix
Eight currency baskets are tracked using configurable symbol inputs (defaults use $FX_IDC pairs). Each currency's strength is normalized to a -1 to +1 scale relative to its lookback range. The heatmap table displays which currencies are dominating, allowing quick assessment of broad market moves before they appear in individual pair price action.
### Correlation Intelligence Grid
Three reference pairs (defaults: FX_IDC:EURUSD , FX_IDC:GBPUSD , FX_IDC:USDJPY ) are monitored on a higher timeframe. The script calculates correlation coefficients and assigns qualitative descriptors: "Lockstep +", "Aligned +", "Loose", "Aligned -", or "Lockstep -". A correlation consensus value feeds into the macro confluence calculation, dampening signals when reference pairs show conflicting behavior.
### Momentum, Volatility & Liquidity Stack
Dual ROC momentum — Fast and slow rate-of-change calculations prevent whipsaw from single-length oscillators
Volatility pulse — Compares current ATR to a slower baseline; signals require volatility above a floor threshold
Volatility forecast slope — Uses linear regression to project ATR 21 bars ahead, warning of imminent expansion or contraction
Liquidity pulse — Compares current volume to smoothed average; low participation is visually indicated via background tinting
### Session Awareness & Performance Console
Asia, Europe, and US trading sessions are tracked with configurable UTC windows. Each session maintains:
Live VWAP that resets at session open
Drift score quantifying price deviation from VWAP in ATR terms
Range percentage showing session expansion relative to VWAP
Session bias composite feeds into macro confluence to reduce signal aggression when all sessions are mean-reverting.
### Liquidity & Market Structure Suite
Liquidity sweeps — Detects stop hunts above prior highs or below prior lows within a configurable lookback
RSI divergence — Identifies momentum divergences using confirmed pivot points only
Supply/demand zones — Automatically generated from pivot highs/lows and projected forward for a set number of bars
### Macro Alignment Engine
The macroConfluence score combines:
Structure score (weighted average of strategic/tactical/execution EMAs)
Carry composite
Currency strength spread (base minus quote)
Momentum score
Liquidity modifier
Session bias composite
Correlation consensus
Long/short alignment signals require:
Macro confluence exceeding configurable threshold (default: 0.55)
Volatility pulse above floor threshold
Optional: Price above/below tactical EMA (execution filter toggle)
---
## Visual Elements
Candle Coloring: Candles are recolored based on macro confluence: teal for bullish alignment, magenta for bearish alignment, neutral gray for distribution phases.
Background Tint: Volatility intensity modulates chart background; bold colors indicate elevated ATR, washed-out tones suggest choppy conditions.
Labels:
Macro Align Long/Short — Primary entry signals when confluence exceeds threshold
BOS↑/↓ — Break-of-structure confirmation
Sweep↑/↓ — Liquidity sweep detection
RSI Bull/Bear Div — Momentum divergence alerts
Carry Bias± — Policy-strength alignment flags
Session Overlays: Transparent background shading indicates active trading sessions (Asia, Europe, US) with configurable opacity.
Session VWAPs: Each region's VWAP is plotted in a distinct color (teal for Asia, blue for Europe, purple for US).
## Dashboard Tables
The indicator includes several configurable information tables:
Intelligence Dashboard (top-right, default) — Displays strategic/tactical/execution bias, policy pressure, currency spread, volatility pulse, policy impulse, session drift, correlation, and macro state
Currency Heatmap (bottom-right, default) — Shows normalized strength values for all tracked currencies
Correlation Grid (bottom-left, default) — Lists reference pairs with correlation coefficients and qualitative states
Session Performance Panel (bottom-center, default) — Displays drift scores and range percentages for each session
Diagnostics Table (top-left, optional) — Additional session range metrics and liquidity pulse values
All table positions are configurable via input settings to avoid overlap with TradingView UI elements.
---
## Configuration Parameters
Multi-Timeframe Structure: All EMA timeframes and lengths are adjustable. Default strategic timeframe is Daily; tactical is 4-hour; execution is 1-hour.
Policy Proxies: Base and quote currency policy proxy symbols are user-configurable. Defaults use $FX_IDC pairs for broad compatibility.
Currency Strength: Each currency's tracking can be toggled on/off. Symbol inputs allow substitution of alternative data sources if default indices are unavailable.
Correlation References: Three reference pair symbols, timeframe, and lookback period are all configurable.
Signal Thresholds: Macro alignment trigger, volatility pulse floor, and carry opportunity threshold are adjustable to match different trading styles.
Visual Controls: Label visibility, zone display, session overlays, VWAP plotting, and all dashboard tables can be toggled independently.
---
## Technical Implementation Notes
Pine Script v6 compliant
All request.security calls use lookahead_off to prevent historical repainting
BOS, divergence, and sweep detection rely on confirmed pivot points only
Session VWAP calculations reset strictly on session boundaries
Zone objects are automatically capped and managed to respect TradingView resource limits
All calculations include division-by-zero guards and NA handling for real-time stability
---
## Usage Considerations
Timeframe Selection: The indicator is designed for forex pairs. Default timeframes (D/4H/1H) are optimized for swing and intraday trading. Scalpers may prefer shorter execution timeframes; position traders may extend strategic to weekly.
Pair Compatibility: Tested on major pairs ( FX:EURUSD , FX:GBPUSD , FX:USDJPY , OANDA:USDCHF , OANDA:AUDUSD , OANDA:USDCAD , OANDA:NZDUSD ), cross-pairs, and FX-derived CFDs. Policy proxy symbols should be adjusted to match your data feed availability.
Session Windows: Default UTC windows (Asia: 22:00-06:00, Europe: 06:00-13:00, US: 13:00-21:00) can be customized. Adjust for daylight saving time transitions as needed.
Signal Interpretation: Macro alignment signals indicate confluence across multiple dimensions but do not guarantee profitable outcomes. Use in conjunction with risk management and market context. The indicator is a tool for analysis, not a standalone trading system.
Resource Usage: With all features enabled, the script operates within TradingView's resource budgets. Disable unused modules (currency tracking, correlation grid, diagnostics) if running multiple instances on a single layout.
---
## Limitations & Compromises
Policy proxies are approximations using currency indices; actual central bank policy requires external economic analysis
Correlation calculations use price-based correlation, which may lag during regime shifts
Session VWAPs reset at session boundaries; overlapping sessions (e.g., London/NY) may show conflicting signals
Supply/demand zones are generated from pivots; false zones may appear during ranging markets
Macro confluence is a composite score; individual components may conflict, requiring discretionary interpretation
The indicator is optimized for trending and rotational markets. Performance may degrade during extended consolidation or during major economic event volatility when multiple central banks act simultaneously.
---
## Alert System
The script includes four alert conditions:
SterlCore FX Bullish Alignment — Fires when macro confluence exceeds threshold with volatility and EMA filters satisfied
SterlCore FX Bearish Alignment — Mirror of bullish logic
SterlCore FX Carry Long — Fires when carry composite, currency spread, and structure align for long bias
SterlCore FX Carry Short — Mirror of carry long logic
---
## Why This Approach
Forex markets require analysis across multiple dimensions simultaneously. A single timeframe or single indicator cannot capture the interplay between central bank policy expectations, cross-pair correlations, session-specific liquidity, and market structure. This script attempts to synthesize these elements into actionable signals while maintaining transparency about its limitations.
The composite scoring system allows traders to see when multiple factors align, reducing reliance on single-signal systems that may fail during regime changes. The modular design enables users to disable components that don't fit their trading style while retaining core functionality.
Medie mobili

Dynamic EMA Trend Table [Customizable]Overview
The Dynamic EMA Trend Table is a comprehensive dashboard designed to give traders an instant overview of the market trend across five distinct Exponential Moving Averages (EMAs). Instead of cluttering your chart with multiple lines, this script organizes the data into a clean, customizable table, allowing you to assess trend alignment at a glance.
How It Works
This indicator calculates five user-defined EMAs (defaulting to the popular 5, 20, 50, 100, and 200 periods). It then compares the Current Price against each EMA value to determine the immediate trend status:
Bullish State: When the current price is above the specific EMA, the table cell turns Green (customizable).
Bearish State: When the current price is below the specific EMA, the table cell turns Red (customizable).
This logic allows swing traders and scalpers to instantly see if the asset is in a strong uptrend (all cells Green), a strong downtrend (all cells Red), or a consolidation phase (mixed colors).
Key Features
Fully Customizable Periods: Change the length of all 5 EMAs to fit your specific strategy (e.g., Fibonacci numbers or standard Swing Trading settings).
Dynamic UI: Position the table anywhere on the screen (Top/Bottom/Left/Right) and adjust the size to fit your screen resolution.
Visual Cleanliness: You can choose to show the table only, or toggle the "Show EMAs on Chart" option to plot the actual lines on your chart.
Smart Coloring: The lines on the chart (if enabled) inherit the same color logic as the table—turning Green when price is above them and Red when price is below.
Settings & Configuration
Price Source: Select Close, High, Low, etc. (Default is Close).
Table Position & Size: Customize where the dashboard appears.
EMA Lengths: Set your 5 preferred lookback periods.
Color Theme: Fully adjustable colors for Bullish, Bearish, Neutral, and Background elements to match your chart theme (Dark/Light mode friendly).
Use Case Example
Trend Confirmation: A trader looking for a "Buy" entry might wait for the short-term EMAs (5 and 20) and the medium-term EMA (50) to all turn Green in the table before entering.
Support/Resistance Watch: By quickly glancing at the values in the table, you can see exactly where the 200 EMA sits without needing to scroll back on your chart to find the line.

Swing Master by Pooja📘 Swing Master by Pooja
Invite-Only | Rule-Based Swing & Trend Structure Indicator
🔍 What this indicator is
Swing Master by Pooja is a rule-based technical analysis indicator designed to help traders identify high-quality swing opportunities within an established trend structure.
This script is not a trading strategy.
It does not execute trades and does not provide fixed targets or stop-loss levels.
Instead, it functions as a decision-support tool.
Visual signals appear only on confirmed candles, and only when trend structure, momentum, and market participation align together.
The core objective of this indicator is filtering low-quality market conditions and avoiding random entries, not generating frequent signals.
🎯 Intended Trading Use
This indicator is intended for traders who:
Trade trend-based swings and pullbacks
Prefer structure-aligned entries instead of chasing price
Want multi-factor confirmation before acting
Apply their own execution and risk-management rules
Applicable on:
Indices
Stocks
Futures
Intraday & higher-timeframe swing charts
🧠 Why this is NOT a simple indicator mashup
Although Swing Master uses EMA, RSI, Volume, and multi-timeframe context, each component serves a distinct and non-overlapping role.
No indicator is used to confirm itself, and no single condition can trigger a signal independently.
Signals are generated only when all required structural and momentum conditions align together on a confirmed bar, reducing noise and hindsight bias.
🔹 EMA Structure (50 / 100 / 200)
Defines trend hierarchy and market structure
Strictly filters trades in the dominant trend direction
Identifies pullback zones, not breakout points
EMA stacking is used to determine structural bias, not direct entries.
🔹 Pullback-Tolerance Logic (Key Original Component)
Instead of requiring exact EMA touches, the script applies a tolerance-based pullback zone around EMAs.
This allows:
More realistic swing entries
Fewer missed opportunities
Reduced noise compared to rigid EMA rules
This pullback-zone evaluation is custom-designed and central to the indicator’s behavior.
🔹 RSI Momentum Filter
Ensures pullbacks occur with momentum acceptance
Filters entries during weak or exhausted moves
Helps avoid counter-trend traps
RSI is used strictly as a momentum-quality filter, not as a standalone signal.
🔹 Volume Participation Filter
Confirms that price movement has market participation
Filters signals during low-interest or weak-volume phases
Helps avoid false continuation attempts
🚦 Signal Types Explained (Rule-Specific & Non-Repeating)
Each visual signal represents a distinct market condition, not repeated logic.
▸ sb — Swing Buy
Trend-aligned pullback near EMA structure
RSI confirms momentum
Volume confirms participation
▸ FS — Future Sell
Mirror logic of Swing Buy
Appears only in established downtrends
▸ SB / SS — Strong Buy / Strong Sell Zones
Price acceptance above or below all EMAs
Indicates strong directional control
Plotted only on the first bar of zone entry (no repetition)
▸ GB / GS — Golden Buy / Golden Sell
EMA 100 / EMA 200 crossover
Represents a structural trend transition
Appears only on confirmed crossovers
Each signal type follows its own independent rule-set.
📊 Multi-Timeframe Dashboard (Context Only)
The optional dashboard provides:
Trend state across higher timeframes
Top-down market context for directional bias
The dashboard is informational only and does not generate signals.
🔔 Alerts
Alert conditions are available for all signal types.
Alerts trigger only on confirmed candles and are intended to support manual analysis, not automated trading.
🔐 Why Invite-Only & Closed-Source
Swing Master incorporates:
Stateful signal control
Multi-condition validation
Non-repeating signal logic
Custom pullback-zone evaluation
The source code is protected to preserve the internal interaction, sequencing, and state management logic, not to conceal commonly known indicators.
⚠ Disclaimer
This indicator is provided for educational and analytical purposes only.
It does not constitute financial advice and does not guarantee results.
All trading decisions, execution, and risk management remain entirely the user’s responsibility.

Universal Moving Average🙏🏻 UMA (Universal Moving Average) represents the most natural and prolly ‘the’ final general universal entity for calculating rolling typical value for any type of time-series. Simply via different weighting schemes applied together, it encodes:
Location of each datapoint in corresponding fields (price, time, volume)
Informational relevance of each datapoint via using windowing functions that are fundamental in nature and go beyond DSP inventions & approximations
Innovation in state space (in our case = volatility)
The real beauty of this development: being simply a weighting scheme that can be applied to anything: be it weighted median , weighted quantile regression, or weighted KDE , or a simple weighted mean (like in this script). As long as a method accepts weights, you can harness the power of this entity. It means that final algorithmic complexity will match your initial tool.
As a moving ‘average’ it beats ALMA, KAMA, MAMA, VIDYA and all others because it is a simple and general entity, and all it does is encoding ‘all’ available information. I think that post might anger a lot of people, because lotta things will be realized as legacy and many paywalls gonna be ignored, specially for the followers of DSP cult, the ones who yet don’t understand that aggregated tick data is not a signal omg, it’s a completely different type of time series where your methods simply don’t fit even closely. I am also sorry to inform y’all, that spectral analysis is much closer to state-space methods in spirit than to DSP. But in fact DSP is cool and I love it, well for actual signals xD
...
Weights explained & how to use them: as I already said, the whole thing is based on combining different set of weights, and you can turn them on/off in script settings. Btw I've set em up defaults so you can use the thing on price data out of the box right away.
Price, Time, Volume weights: encode location of every datapoint in Price & TIme & Volume field
Howtouse: u have to disable one weight that corresponds to the field you apply UMA to. E.g if you apply UMA to prices, you turn off price weighting And turn on time and volume weighting. Or if you apply UMA to volume delta, you turn off volume weighting And turn on price and time weighting.
Higher prices are more important, this asymmetry is confirmed and even proved by the fact that prices can’t be negative (don’t even mention that incorrect rollover on CL contract in 2k20...).
Signal weights: encode actuality/importance/relevance of datapoints.
Howtouse: in DSP terms, it provides smoothing, but also compensates for the lag it introduces. This smoothness is useful if you use slope reversals for signal generation aka watching peaks and valleys in a moving average shape. It's also better to perturb smoothed outputs with this , this way you inject high freq content back, But in controlled way!
Signal = information.
The fundamental universal entity behind so-called “smoothing” in DSP has nothing to do with signals and goes eons beyond DSP. This is simply about measuring the relevance of data in time.
First, new datapoints need some time to be “embedded” into the timeline, you can think of it as time proof, kinda stuff needs time to be proved, accepted; while earliest datapoints lose relevance in time.
Second, along with the first notion, at the same time there’s the counter notion that simply weights new data more, acting as a counterweight from the down-weighting of the latest datapoints introduced by the first notion.
The first part can be represented as PDF of beta(2, 2) window (a set of weights in our case). It’s actually well known as the Welch window, that lives in between so called statistical and DSP worlds, emerges in multiple contexts. Mainstream DSP users tho mostly don’t use this one, they use primitive legacy windowing function, you can find all kinds on this wiki page.
Now the second part, where DSP adepts usually stop, is to introduce the second compensating windowing function. Instead they try to reduce window size, or introduce other kinds of volatility weights, do some tricks, but it ain’t provides obviously. The natural step here is to simply use the integral of the initial window; if the initial window is beta(2, 2) then what we simply need is CDF of beta(2, 2), in fact the vertically inverted shape of it aka survival function . That’s it bros. Simply as that.
When both of these are applied you have smth magical, your output becomes smooth and yet not lagging. No arbitrary windowing functions, tricks with data modification etc
Why beta(2, 2)? It naturally arises in many contexts, it’s based on one of the most fundamental functions in the universe: x^2. It has finite support. I can talk more bout it on request, but I am absolutely sure this is it.
^^ impulse response of the resulting weighs together (green) compared with uniform weights aka boxcar (red). Made with this script .
Weighing by state: encodes state-space innovation of each datapoint, basically magnitude of changes, strength of these changes, aka volatility.
Howtouse: this makes your moving average volatility aware in proper math ways. The influence of datapoints will be stronger when changes are stronger. This is weighting by innovations, or weighting by volatility by using squared returns.
Why squared returns? They encode state‑space innovations properly because the innovation of any continuous‑time semimartingale is about its quadratic variation, and quadratic variation is built from squared increments, not absolute increments.
Adaptive length is not the right way to introduce adaptivity by volatility xD. When you weight datapoints by squared returns you’re already dynamically varying ‘effective’ data size, you don’t need anything else.
...
It’s all good, progress happens, that’s how the Universe works, that's how Universal Moving Average works. Time to evolve. I might update other scripts with this complete weighting scheme, either by my own desire or your request.
...
∞

cd_VW_Cx IMPROVED - Quant VWAP System: Regime, Magnets & Z-ScoQuant VWAP System: Regime, Magnets & Z-Score Matrix
This indicator is a comprehensive Quantitative Trading System designed to move beyond simple support and resistance. Instead of static lines, it uses Statistical Probability (Z-Score) and Standard Deviation to define the current market regime, identify institutional value zones, and project high-probability liquidity targets.
It is engineered for Day Traders and Scalpers (Crypto & Futures) who need to know if the market is Trending, Ranging, or preparing for a Breakout.
1. The "Regime" System (Standard Deviation Bands)
The core engine anchors a VWAP (Volume Weighted Average Price) to your chosen timeframe (Daily, Weekly, or Monthly) and projects volatility bands based on market variance.
The Trend Zone (Inner Band / 1.0 SD): This is the "Fair Value" zone. In a healthy trend, price will pull back into this zone and hold. A hold here signals a high-probability continuation (Trend Following).
The Reversion Zone (Outer Band / 2.0 SD): This represents a statistical extreme. Price rarely sustains movement beyond 2 Standard Deviations without a reversion. A touch of this band signals "Overbought" or "Oversold" conditions.
2. Liquidity Magnets (Virgin VWAPs)
The script automatically tracks "Unvisited VWAPs" from previous sessions. These are price levels where significant volume occurred but have not yet been re-tested.
The Logic: Algorithms often target these "open loops." The script visualizes them as Blue Dashed Lines with price tags.
Smart Scaling (Anti-Scrunch): Includes a custom "Ghost Engine" that automatically hides or "ghosts" magnets that are too far away. This prevents your chart from being squashed (scrunched) on lower timeframes, keeping your candles perfectly readable while still tracking targets in the background.
3. The Quant Matrix (Dashboard)
A real-time Heads-Up Display (HUD) that interprets the data for you:
Regime: Detects Volatility Squeezes. If the bands compress, it signals "⚠ SQUEEZE", warning you to stop mean-reversion trading and prepare for an explosive breakout.
Bias: Color-coded Trend Direction (Bullish/Bearish) based on VWAP slope.
Signal: actionable text prompts such as "BUY DIP" (Trend Following), "FADE EXT" (Mean Reversion), or "PREP BREAK" (Squeeze).
4. Visual Intelligence
Bold Day Separators: Clear, vertical dotted dividers with Date Stamps to instantly separate trading sessions.
Dynamic Labels: Floating labels on the right axis identify exactly which deviation level is which, preventing chart confusion.
How to Use
Strategy A: The Trend Pullback (continuation)
Check Matrix: Ensure Bias is BULLISH (Green).
Wait: Allow price to pull back into the Inner Band (Dark Green Zone).
Trigger: If price holds the Center VWAP or the -1.0 SD line, enter Long.
Target: The next Liquidity Magnet above or the +2.0 SD band.
Strategy B: The Reversion Fade (Counter-Trend)
Check Matrix: Ensure price is labeled "EXTREME" or Signal says "FADE EXT".
Trigger: Price touches or pierces the Outer Band (2.0 SD).
Action: Enter counter-trend (Short) with a target back to the Center VWAP (Mean Reversion).
Strategy C: The Magnet Target
Identify a "MAGNET" line (Blue Dashed) near current price.
These act as high-probability Take Profit levels. Price will often rush to these levels to "close the loop" before reversing.
Settings
Anchor: Daily (default), Weekly, or Monthly.
Magnet Focus Range: Adjusts how aggressively the script hides distant magnets to fix chart scaling (Default: 2%).
Visuals: Fully customizable colors, label sizes, and dashboard position.

Witch-Fire ALMA signals: Dynamic Liquidity & Trend GlowThe Witch-Fire ALMA is a high-precision trend bias and liquidity mapping tool designed for price action traders and Smart Money practitioners. Unlike traditional indicators that clutter your chart with lagging signals, this script provides a "clean-yet-powerful" visual anchor to help you stay on the right side of the market while identifying key Points of Interest (POIs).
At its core, the script utilizes an optimized Arnaud Legoux Moving Average (ALMA). Known for its superior ability to balance smoothness and responsiveness, the ALMA effectively filters out market noise and "whipsaws" that often plague standard EMAs.
Key Features:
The Witch-Fire Glow: A neon-styled ALMA line that shifts between Bullish Green and Bearish Red. The white core provides surgical precision for price intersection, while the outer glow visualizes the strength and dominance of the current trend.
Scaled Liquidity Levels: Automatically maps Buy Side Liquidity (BSL) and Sell Side Liquidity (SSL). These levels are dynamic—they scale proportionally with your ALMA settings. This ensures that the liquidity zones you see are always relevant to the trend cycle you are analyzing.
Strategic Bias Background: A subtle background tint provides an instant psychological filter. Only look for Longs in the green zone and Shorts in the red zone to maintain a high-probability strike rate.
How to Trade with Witch-Fire:
Identify the Bias: Look at the Fire ALMA. If the "fire" is red and the price is below the line, your bias is strictly bearish.
Watch the Sweeps: Wait for the price to "sweep" (pierce with a wick) the horizontal SSL (Green) or BSL (Red) lines.
Execution: Look for a strong rejection candle (long wick, small body) at these levels that closes back towards the ALMA line.
Best Used On: 15m, 1H, and 4H timeframes. Works exceptionally well for Crypto, Forex, and Indices.

Support Resistance + RSI + 4 EMA (Doge_SV)Overview
This comprehensive indicator is designed to provide traders with a "bird's-eye view" of the market by combining three essential technical analysis tools into a single, clean interface. It helps in identifying trend direction, key price levels, and momentum across multiple timeframes without cluttering your workspace.
Key Features
1. Dynamic Support & Resistance (S/R)
The script automatically identifies and plots significant Support and Resistance levels based on pivot points.
Dynamic Zones: It highlights areas where price has historically reacted, helping you find high-probability entry and exit points.
Strength Filtering: Includes a built-in algorithm to display only the most "significant" levels based on their historical strength.
Visual Alerts: Lines and labels change color (Lime for Support, Red for Resistance) based on the current price position.
2. Quad-EMA Trend Ribbon (The "Exponential Moving Averages")
The indicator features four of the most widely used EMAs in professional trading to identify trend hierarchy:
EMA 34 (Green): Short-term momentum and immediate support/resistance.
EMA 89 (Blue): Intermediate-term trend filter (The "Trend Core").
EMA 200 (Black): Long-term trend baseline (The "Institutional Level").
EMA 633 (Purple): Ultra-long-term trend, often used for major cycle analysis.
3. Multi-Timeframe (MTF) RSI Dashboard
Stay informed about overbought or oversold conditions across all timeframes simultaneously.
Real-time Table: A neat table in the corner of your chart displays RSI (14) values from 1 minute up to 1 day.
Heatmap Logic: The table cells automatically change color based on intensity:
Red/Orange: Overbought (RSI > 70/80)
Green/Dark Green: Oversold (RSI < 30/20)
White: Neutral zone.
How to Use
Trend Alignment: Look for the 4-EMAs to be stacked in order (34 > 89 > 200 > 633 for a Bullish trend).
S/R Confirmation: When price approaches a Red Resistance line, check the RSI Dashboard. If higher timeframes are also Overbought, it increases the probability of a reversal.
Breakout Detection: Use the Support/Resistance lines to identify potential breakouts or "Role Reversal" (where old resistance becomes new support).

Multi-TF ATR + ORB + EMA PRO ver. 3.0Multi-TF ATR + ORB + EMA PRO v3.0
Professional Trading Indicator Update - Complete Documentation
🎯 MAJOR ENHANCEMENTS OVERVIEW
1. ORB Logic Completely Redesigned
✅ Show Only Previous ORB - Extended line display of previous session's ORB
✅ Multi-Session Support - NY, EU, ASIA sessions with independent on/off toggles
✅ Dynamic Timeframe Selection - Switch between 4H, 1H, 30M, 15M, 5M in settings
✅ Previous Session Tracking - Separate variables for previous ORB highs/lows
2. Enhanced ATR Table with Color Signals
✅ Signal-Based Color Coding - Green (●) for active signals, Gray (○) for inactive
✅ Modern Design - Professional dark theme with gradient colors
✅ Quick Recognition - Color-coded cells for instant signal identification
✅ Fully Customizable - Position, size, and styling in settings
3. Full Syntax Validation & No Errors
✅ All Pine Script v6 syntax validated
✅ Proper type annotations on all variables
✅ Correct indentation (4 spaces throughout)
✅ Function declarations follow v6 standards
✅ Request.security() calls optimized

Cantillon Clean Moving Averages [Free]Overview Standard Moving Averages are static. The Cantillon Clean MA is dynamic. It automatically changes color based on price interaction, giving you an instant visual read on the trend health of the Short (20), Medium (50), and Long (200) term flows.
Features
Dynamic Coloring: Green when Bullish, Red when Bearish.
Smart Weighting: Uses Exponential Moving Averages (EMA) to react faster than standard SMAs.
Crossover Signals: Subtle "X" markers when the short-term trend flips.
Want the Real Institutional Trend? Moving averages lag. To track the True Institutional Cost Basis (Anchored VWAP) and statistical reversal points, you need the Cantillon Terminal .

MSP Multi-Timeframe Trend & Momentum DashboardMulti-Timeframe Trend, Momentum, and Bias Dashboard
This indicator provides a multi-timeframe overview by evaluating several technical conditions across multiple timeframes simultaneously.
Its purpose is to help traders assess alignment or divergence between higher and lower timeframes before making trading decisions.
Rather than generating standalone signals, the dashboard summarizes trend, momentum, participation, and trend-strength metrics into a compact visual table.
What the Indicator Evaluates (Per Timeframe)
Each selected timeframe is analyzed independently using:
Trend context
Price position relative to fast and slow moving averages
Momentum
RSI position relative to user-defined thresholds
Directional confirmation
MACD line relative to its signal line
Participation
Current volume compared to its recent average
Trend strength
ADX value to distinguish trending from non-trending conditions
These components are combined to form a directional bias assessment for each timeframe.
Dashboard Overview
The dashboard displays:
Directional bias per timeframe
Aggregate bias across all selected timeframes
Momentum and trend readings
Relative volume strength
Trend-strength values
Alignment status when multiple timeframes agree
This allows users to quickly identify whether market conditions are aligned, mixed, or conflicting across timeframes.
Visual Encoding
Cells within the table are color-coded to improve readability:
Bullish bias
Bearish bias
Neutral or mixed conditions
Color intensity reflects relative strength, helping distinguish weak alignment from stronger confluence.
Optional chart-level visuals can highlight periods of broad alignment or disagreement across timeframes.
Customization Options
Users may adjust:
Timeframes included in the dashboard
Thresholds for momentum, volume, and trend strength
Table size, position, and visual appearance
Alert conditions based on alignment criteria
These settings allow the indicator to be adapted to different instruments, timeframes, and trading styles.
Intended Use
Style: Multi-timeframe analysis and confirmation
Markets: Forex, crypto, equities, index futures
Purpose:
Assess higher-timeframe bias
Improve directional context before entries
Avoid trades against broader trend conditions
The indicator is most useful as a contextual filter, rather than a standalone decision tool.
Important Notes
This script is provided for educational and analytical purposes only.
It does not predict price movement and should be used alongside independent analysis and appropriate risk controls.

SMA MAD Trend [Alpha Extract]A sophisticated trend identification system that combines Simple Moving Average with Mean Absolute Deviation methodology to create adaptive Super Trend-style bands with advanced strength filtering and gradient visualization. Utilizing ADX-based trend strength validation and slope analysis for signal quality enhancement, this indicator delivers institutional-grade trend detection with dynamic ATR-based ribbon visualization and comprehensive strength measurement. The system's dual-filter architecture eliminates false signals during weak or choppy market conditions while maintaining sensitivity to genuine trend establishment and reversal events.
🔶 Advanced SMA-MAD Band Construction
Implements innovative Mean Absolute Deviation calculation around Simple Moving Average baseline to create volatility-adaptive bands with ratcheting logic for trend persistence. The system calculates MAD by measuring absolute price deviations from the mean, then applies configurable multipliers to generate upper and lower bands that adjust to changing market conditions while preventing premature band violations.
// Core SMA-MAD Framework
SMA_Value = ta.sma(close, SMA_Length)
Mean = ta.sma(close, MAD_Length)
Abs_Deviation = abs(close - Mean)
MAD_Value = ta.sma(Abs_Deviation, MAD_Length)
// Adaptive Bands
Upper_Band = SMA_Value + MAD_Factor * MAD_Value
Lower_Band = SMA_Value - MAD_Factor * MAD_Value
🔶 Intelligent Dual-Filter System
Features comprehensive trend validation using ADX strength measurement and slope analysis to eliminate low-conviction signals during ranging or consolidating markets. The system calculates normalized slope strength using ATR scaling and combines with ADX threshold analysis, generating filtered trend states that distinguish genuine trends from temporary price fluctuations.
🔶 Dynamic Trend Strength Engine
Implements sophisticated strength calculation combining slope intensity and ADX readings to produce normalized 0-100% strength scores with gradient colour intensity modulation. The system normalizes slope by minimum threshold and ADX by configurable level, multiplying factors to create composite strength measurement that drives visual feedback intensity across all indicator elements.
🔶 Super Trend-Style Direction Logic
Utilizes classic Super Trend methodology adapted for SMA-MAD bands, where trend direction flips occur on opposite band violations with persistent state maintenance. The system tracks previous band levels with ratcheting behaviour that adjusts bands only when price movement or new calculations warrant changes, preventing oscillation during normal volatility.
🔶 ATR-Based Ribbon Visualization
Provides dynamic ribbon overlay using ATR-scaled width around the trend line with opacity modulation based on trend strength for intuitive conviction assessment. The system creates upper and lower ribbon bounds at configurable ATR multiples, filling the channel with gradient-adjusted transparency that increases during strong trends and fades during weak conditions.
🔶 Multi-Dimensional Visual Architecture
Provides complete chart integration through trend line overlay, ATR ribbon fills, candle colouring, background glow, and transition signal labels with configurable visibility toggles. The system enables traders to customize display density from minimal (trend line only) to comprehensive (all visual elements) while maintaining consistent colour scheme and strength-based intensity across components.
🔶 Slope Strength Validation
Calculates ATR-normalized slope over configurable lookback periods to measure trend line momentum and filter sideways price action. The system compares absolute slope against minimum threshold requirements, preventing trend signals when price movement relative to the trend line lacks sufficient directional conviction regardless of band position.
🔶 Signal Generation Framework
Generates trend change signals when filtered direction state transitions from bearish to bullish or vice versa, with label placement and alert integration. The system implements state persistence that maintains previous trend until both ADX and slope filters confirm directional change, reducing whipsaw signals while capturing genuine reversals with minimal lag.
🔶 Performance Optimization Framework
Utilizes efficient calculation methods with optimized variable management and configurable parameters for balance between responsiveness and stability. The system includes intelligent state tracking with NA handling for initial bars and smooth gradient calculations that maintain performance across extended historical periods and real-time updates.
This indicator delivers sophisticated trend identification through Mean Absolute Deviation methodology combined with dual-strength filtering for superior signal quality. Unlike traditional Super Trend indicators that rely solely on ATR bands, the SMA-MAD approach uses statistical deviation measurement while incorporating ADX strength and slope validation to eliminate false signals during choppy conditions. The system's gradient-based visual feedback, ATR ribbon visualization, comprehensive dashboard, and multi-dimensional filtering make it essential for traders seeking reliable trend-following approaches with clear conviction measurement across cryptocurrency, forex, and equity markets. The combination of adaptive bands, strength-based transparency, and intelligent filtering creates an institutional-grade trend system suitable for systematic trading strategies.

Custom EMA/SMA Ribbon [TheScalpingAnt]Overview
Custom EMA/SMA Ribbon is a premium market trend framework designed to simplify trend recognition, improve timing, and provide clearer structure during both trending and corrective environments. Unlike traditional moving-average indicators, this ribbon focuses on visual clarity, hierarchy, and actionable interpretation — delivering institutional-style trend information directly on your chart.
It is engineered for traders who demand reliability, precision, disciplined decision support, and a clean visual experience without laggy oscillators or noisy signals.
Core Concepts
This indicator is built on three fundamental professional trading concepts:
Trend Structure
Multiple layered moving averages allow traders to instantly understand whether the market is aligned, compressing, transitioning, or breaking down.
Hierarchy & Visual Priority
Short-term MAs are always plotted in front of longer-term averages. This ensures decision-critical structures remain visible and readable, even during market volatility.
True Trend Validation (Not Slope Noise)
Color logic is based on structural dominance rather than temporary slope changes.
A line turns bullish only when it is above the next slower MA, and bearish when below it.
This prevents misleading color flips, maintains logical consistency, and improves confidence in interpretation.
Key Features
• Selectable EMA or SMA mode
• 6-layer ribbon trend architecture
• Correct priority stacking (MA1 always front → MA6 always back)
• Professional bullish / bearish dominance color logic
• Clean and readable premium visual design
• Works on crypto, forex, stocks, and indices, any market.
• Zero repainting
• Lightweight and highly efficient performance
This ensures instant clarity whether trading intraday or analyzing macro market structure.
Customization
Users retain full analytical power and flexibility without losing structure:
• Choose EMA or SMA
• Fully configurable MA lengths
• Individual line style (solid, dashed, dotted)
• Independent line thickness per MA
• Works seamlessly on any symbol and timeframe
This makes the ribbon suitable for swing traders, intraday traders, position traders, and strategy/system builders.
Usage Guidance
This ribbon functions as a market regime detector and structural trend guide, not a simple “buy/sell” tool.
Common professional use cases:
• Identify trend continuation vs structural breakdown
• Confirm market alignment before entering positions
• Validate pullbacks without losing macro perspective
• Avoid trading against dominant bias
• Detect accumulation, consolidation, and expansion phases
Interpretation logic
• Green alignment → structured bullish trend environment
• Red alignment → structural weakness / bearish regime
• Compression → potential volatility, transition, or trend shift area
Example Interpretation
Bearish → Bullish transition example:
• Shorter MAs recover first
• They cross back above slower averages
• Each line turns green only when structural control is truly regained
• A fully green staircase indicates confirmed bullish trend structure
During pullbacks:
Price may retrace, but if hierarchy remains intact, the ribbon stays green — preventing unnecessary panic exits.
Only when structural dominance truly breaks does the ribbon shift red, warning traders to reduce exposure, re-evaluate bias, or reposition.
Settings (Defaults & Logic)
Default optimized configuration:
• Lengths: 10 / 20 / 50 / 100 / 150 / 200
• Type: EMA
• Styles: Solid
• Thickness: 2
Users may customize thickness, style, and calculation type without losing conceptual integrity.
Conclusion
The Custom EMA/SMA Ribbon delivers:
• Higher clarity
• Reduced chart noise
• Stronger confidence in execution
• Superior trend comprehension
• A disciplined, structured trading perspective
Built for serious traders, this tool transforms raw market movement into clear structural intelligence.
Disclaimer
This indicator is a technical analysis tool for educational and analytical purposes only. It does not guarantee profits, does not constitute financial advice, and should not be used as the sole decision-making method. Trading involves risk; users remain responsible for their decisions.

CRR Micro Breakout Option 3 EMA CRR Micro Breakout Option 3 EMA
This indicator is a price action breakout system with EMA based directional filtering
It is designed for intraday trading with improved stability during trending market conditions
The logic uses micro range breakout combined with EMA direction
Buy signal occurs when price breaks above the recent range and stays above EMA
Sell signal occurs when price breaks below the recent range and stays below EMA
Cooldown logic is applied to reduce nearest signals
Time based exit is used to control drawdown during sideways conditions
Buy sell and exit alerts are included
Signals are generated on bar close and do not repaint
The logic is suitable for manual trading and algorithmic execution
This option is suitable for direct trading on option charts and performs best on 1 minute and 3 minute timeframe
This logic can also be used across all scripts and performs well on 5 minute and 15 minute timeframe
For best results use on bar execution and trade during high volatility sessions
Invite only proprietary private use only

Bli-Rik - IndicesIndices - uses : EMA Stack + RSI (Strong & Soft Signals) to predict buy and sell in Indian indices

MA-breakout signal (Skull).V1
MA-breakout signal (이평선 돌파 시그널) - V1
역배열에서 정배열 돌파시 -그린 스컬
정배열에서 역배열 돌파시 -레드 스컬
일목구름 완전 돌파시 - 배경 스컬
Moving average line breakout signal
/GREEN Skull /RED Skull
Ichimoku Cloud completely - Background Skull

EMA 21/50/200 Trend Support & EntryIndicator plots EMA 21, EMA 50, and EMA 200 to define trend structure and dynamic support/resistance.
EMA 200: overall trend bias
EMA 21 and EMA 50: pullback support for high probability trend entries.
EMA 21/50 crosses highlight momentum shifts but are not intended as standalone entry signals.

HaP MACDHaP MACD - Advanced DEMA Assisted Signal Indicator
Overview
The HaP MACD is an evolution of the classic MACD, designed for traders who demand faster response times and clearer trend visualisations. By integrating DEMA (Double Exponential Moving Average) logic into the standard MACD framework, this indicator filters out noise and highlights momentum shifts with a unique color-coded dot system.
How It Works
The indicator calculates two types of MACD: a standard one for the main lines and a DEMA-based one for signal generation. This dual approach ensures you stay in the trend while being alerted the moment the momentum starts to fade.
Visual Guide & Color Logic
The signal dots are placed directly on the MACD line to guide your decisions:
🔵 Blue Dot: The Entry Signal. Appears when DEMA conditions first align for a bullish move.
🟢 Green Dot: Strong Momentum. The trend is active and the MACD value is increasing.
🟠 Orange Dot: Warning Signal. The bullish trend is still active, but the momentum is slowing down (MACD is lower than the previous bar).
🔴 Red Dot: Exit Signal. The bullish condition has ended. It’s time to consider closing the position or tightening stops.
Key Features
Reduced Lag: DEMA integration provides earlier signals than standard EMA-based MACDs.
Trend Monitoring: Easily distinguish between a healthy trend (Green) and a tiring trend (Orange).
Customizable: Choose between EMA and SMA for both the oscillator and signal calculations.
Crossover Markers: Optional triangle markers for classic MACD crossovers (can be enabled in settings).

My multiple MAs📈 My Multiple MAs — Multi-Timeframe Adaptive Moving Average
MY-MA is a multi-timeframe moving average indicator designed to help traders clearly identify trend direction, market cycles, and dynamic support & resistance using advanced MA logic.
This indicator combines Higher Timeframe Moving Averages with adaptive curve visualization, making it especially useful for swing trading, trend following, and market structure analysis.
🔹 Key Features
✅ Multi-Timeframe Moving Averages
- Plot moving averages from higher timeframes (e.g. 4H, 1D) directly on your current chart
- See the real trend context without switching timeframes
✅ Advanced MA Types
- Supports LMA (Least Moving Average) for smoother trend tracking
- Optional HIG / custom MA logic for cycle detection and turning points
✅ Market Cycle Visualization
- Curved MA behavior helps highlight trend expansion, exhaustion, and reversals
- Color-coded curves make bullish vs bearish phases easy to read
✅ Dynamic Price Labels
- Automatically displays MA price levels on the chart
- Helps identify key reaction zones and confluence areas
✅ Highly Customizable
- Control timeframe, MA length, source price, and offsets
- Toggle labels and lines independently for a clean chart
🔹 How to Use
- Above MA & rising → Bullish trend bias
- Below MA & falling → Bearish trend bias
- Price reacting near higher-TF MA → Potential support/resistance
- Curve flattening or bending → Possible trend exhaustion or reversal
- Best used together with price action, volume, or structure confirmation.
⚠️ Disclaimer
This indicator is a technical analysis tool only and does not provide financial advice. Always use proper risk management and confirmation before entering trades.


cd_VW_CxOverview
The cd_VW_Cx is a sophisticated trend analysis tool designed to quantify market momentum using Multi-Period VWAP (Volume Weighted Average Price). Unlike standard indicators, this script evaluates the current price relationship across multiple historical VWAP anchors to generate a real-time "Confidence Score" ranging from -100 to +100.
💡 Key Features
• Dynamic Anchoring: Seamlessly switch between Daily, Weekly, or Monthly open anchors to align with your trading style (Scalping, Day Trading, or Swing).
• Algorithmic Scoring (The Score Box): The indicator compares the current VWAP against historical periods.
o Score > +70: Strong Bullish Momentum.
o Score < -70: Strong Bearish Momentum.
• Polyline Rendering: Utilizes Pine Script v6’s advanced polyline architecture for high-performance, sleek visual plotting that doesn't clutter your chart.
• Institutional Support/Resistance: Historical VWAP levels are color-coded, often acting as "invisible" magnetic zones where institutional orders are clustered.
🛠 How to Trade with cd_VW_Cx
1. Momentum Confirmation: Look for the Score Box to turn Teal (Bullish) or Red (Bearish). This indicates that the current trend has statistical backing from multiple previous sessions.
2. The Breakout Signal: The script tracks price crossovers of the current VWAP. A "Bullish Breakout" combined with a high score is a high-probability entry signal.
3. Visual Guidance: Use the custom labels to identify which specific day/week/month’s VWAP is currently being tested as support or resistance.
⚙️ Customizable Settings
• Anchor Selection: Choose the calculation basis (Daily, Weekly, Monthly).
• Thresholds: Adjust the sensitivity of the Bullish/Bearish alerts (Default is +/- 70).
• Visuals: Full control over table positioning, font sizes, and color palettes to match your chart theme.
📢 cd_VW_Cx: Multi-Period VWAP Scoring & Analysis Guide
🔍 Overview & Visual Logic
The labels next to the VWAP levels dynamically change based on your Anchor selection:
• Daily Open: Displays the Day Name (e.g., Monday, Tuesday).
• Weekly Open: Displays the Week Number (1 – 52).
• Monthly Open: Displays the Month Number (1 – 12).
•
General View:
________________________________________
🚦 How to Filter & Track Your Assets
You can monitor your favorite assets using two powerful methods:
1. Real-Time Alerts
Stay updated with TradingView notifications:
• Per Asset: Track a single pair.
• Watchlist Basis: Monitor your entire list at once. Alert Setup Guide:
2. Pine Screener Integration
Filter the market effortlessly using the Pine Screener. Pine Screener View:
________________________________________
⚙️ Settings & Configuration
• Timeframe Selection: Your chart timeframe must be lower than the selected Anchor timeframe. (e.g., If "Daily Open" is selected, the timeframe should be lower than 1D).
• Anchor Choice: Select Daily, Weekly, or Monthly opens.
• Source Selection: Default value is set to ohlc4. Source Settings:
Filtering Criteria Examples:
• Bullish Filtering: Find assets with high momentum scores.
• Bullish Breakout (Single Criteria): Filters assets that have closed above the current VWAP level.
• Combined Strength (Score + Breakout): Filters assets that have a Score > 70 AND a fresh VWAP Breakout simultaneously.
________________________________________
⚠️ Important Notes & Warnings
• Calculation Logic: The indicator calculates levels and scores on timeframes lower than the anchor. It is best used on timeframes that are close to but lower than the anchor.
• Avoid Extreme Gaps: Using a very low timeframe (e.g., 1m) with a very high anchor (e.g., Monthly) increases the risk of erroneous results.
• Optimization: The default score threshold of 70 is a starting point; I recommend adjusting it based on your own trading experience.
• The Power of Confluence: VWAP levels are naturally strong. Their significance increases when they coincide with institutional levels like PDH (Previous Day High), Session H/L, or HTF FVG.
• Experience Matters: A high score alone is not enough for an entry. Always combine this data with your personal strategy.
________________________________________
💬 Community & Feedback
I would love to hear your suggestions regarding the scoring logic or visual improvements! Feel free to share your thoughts in the comments.
Happy Trading! 🚀

ATR + Moving AverageThis indicator shows a manually calculated Average True Range (ATR) along with a moving average of the ATR.
The ATR measures current candle volatility.
The ATR Moving Average shows the average candle size over the selected period.
Both can use different smoothing types (RMA, SMA, EMA, WMA) for flexibility.
It’s useful for seeing when price is stretched, volatility is expanding or contracting, and for higher-timeframe mean-reversion analysis.

BBMA by RWBTradeLabBBMA by RWBTradeLab
A clean, non-repainting BBMA indicator built for traders who combine Bollinger Bands with Linear Weighted Moving Averages and EMA to track volatility expansion, price extremes, and confirmed breakout behavior using closed candles only.
What this indicator does
This script combines Bollinger Bands (20, 2) with Linear Weighted Moving Averages (LWMA) and a 50 EMA to help traders identify high-probability price extension zones and confirmed BBMA break conditions—without repainting.
All calculations and alerts are based strictly on closed candles (no running-bar signals).
Core components
Bollinger Bands
*Period: 20
*Deviations: 2
*Apply to: Close
*Visual shift supported (default 0)
*Clean white band structure for clarity
Linear Weighted Moving Averages (LWMA)
*LW MA 5 Low
*LW MA 10 Low
*LW MA 5 High
*LW MA 10 High
These weighted averages react faster to recent price action and help define dynamic BBMA zones.
Exponential Moving Average
*EMA 50
*Apply to: Close
*Method: Exponential
Used as a higher-timeframe trend and structure reference.
BBMA alert logic (closed candle only)
Lower BBMA Break
Triggered when:
*LW MA 5 Low crosses below the Lower Bollinger Band
*The candle closes below the Lower Bollinger Band
*LW MA 5 Low remains below the Lower Bollinger Band after close
Upper BBMA Break
Triggered when:
*LW MA 5 High crosses above the Upper Bollinger Band
*The candle closes above the Upper Bollinger Band
*LW MA 5 High remains above the Upper Bollinger Band after close
⚠️ No alerts are generated on running candles—only on confirmed bar close.
Visuals on chart
*Bollinger Bands plotted in clean white
*LW MAs color-coded for easy distinction
*EMA 50 plotted in green
*Optional show/hide toggles for BB, LW MAs, and EMA
Alerts
Built-in alerts trigger only on candle close:
*BBMA Lower Break (confirmed)
*BBMA Upper Break (confirmed)
Designed for reliable discretionary trading and automation without repainting issues.
Key settings
*BB Period & Deviations
*LW MA periods (5 & 10, High / Low)
*EMA period
*Visual shift for Bollinger Bands
*Individual visibility toggles
Non-repainting confirmation
All calculations, plots, and alerts are based on confirmed candles only.
No running-bar logic → no repainting.
Disclaimer
This indicator is a technical analysis tool, not financial advice.
Trading involves risk—always use proper risk management and confirm signals with your own analysis.
Creator: RWBTradeLab
If you find this indicator useful, please leave a like ⭐ and share your feedback.

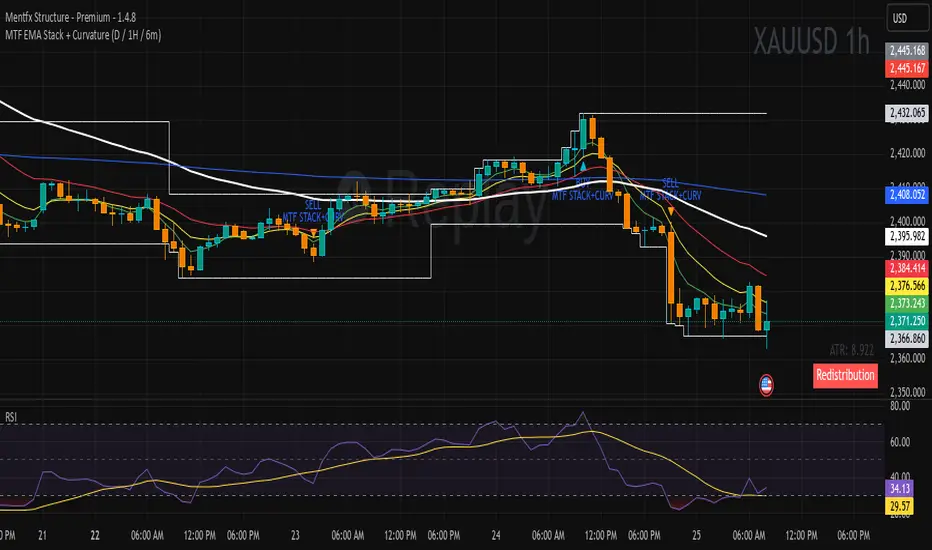
MTF EMA Stack + Curvature (D / 1H / 6m)Purpose of the Indicator
The MTF EMA Stack + Curvature Indicator is a trend-alignment confirmation tool.
Its goal is to identify high-probability trend continuation setups by requiring all of the following to agree:
Trend direction (EMA stacking)
Trend strength / acceleration (EMA curvature)
Multi-timeframe alignment (Daily, 1-Hour, and 6-Minute) with you can change to your preference
Instead of reacting to short-term noise, the indicator only signals when institutional-style trend structure is aligned across time frames.