Multi-Day SMAmade this script due to the frustration of not having the 5 day SMA added with the 10 20 and 50. I need the 5 SMA for my type of trading to determine when to sell with stocks showing exponential growth.
so heres this: Multi SMA
5 day SMA pink
10 day SMA white
20 day SMA blue
50 day SMA red
200 day SMA green
Medie mobili

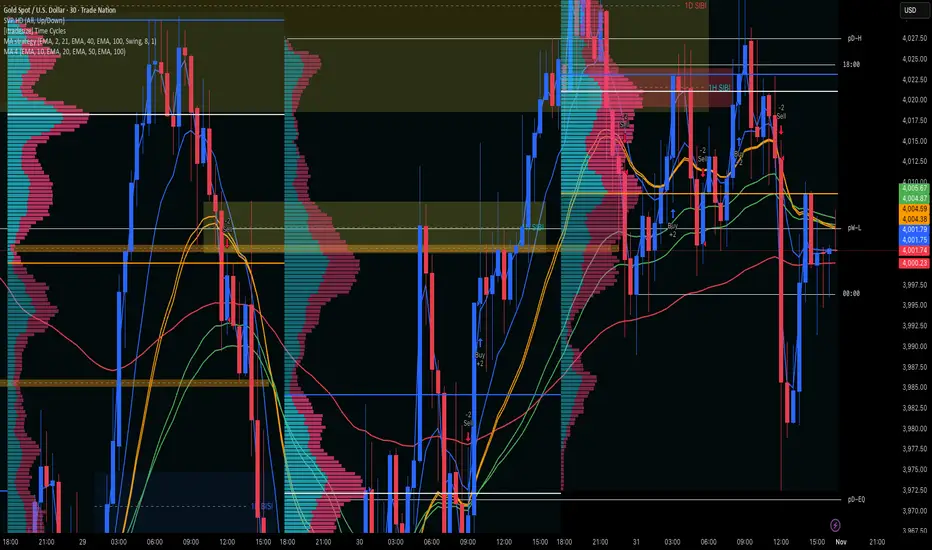
MA strategyBuy / sell on MA cross. Use ATR or Swing for stop
Option for moving stop after second SwL / SwH
Knock yourself out modifying.

MA 44 moving averages.
There is nothing more to it, but I have to write this otherwise TV wont let me publish.
7 MM colored 3 BB clouded + MACD + RSI Zones7 MM colored
3 BB clouded
MACD flèches rouges et vertes
RSI Zones sur vente étoile jaune

Gold $25 line + CDCGold Trading CDC + option line
trading with ema to see trendline + Option strike price


VWMA Series (Dynamic) mtf - Dual Gradient Colored"VWMA Series (Dynamic) mtf - Dual Gradient Colored" is a multi-timeframe (MTF) Volume-Weighted Moving Average (VWMA) ribbon indicator that plots up to 60 sequential VWMAs with arithmetic progression periods (e.g., 1, 4, 7, 10…). Each VWMA line is dual-gradient colored: Base hue = Greenish (#2dd204) if close > VWMA (bullish), Magenta (#ff00c8) if close < VWMA (bearish)
Brightness gradient = fades from base → white as period increases (short → long-term)
Uses daily resolution by default (timeframe="D"), making it ideal for higher-timeframe trend filtering on lower charts.Key FeaturesFeature
Description
Dynamic Periods
Start + i × Increment → e.g., 1, 4, 7, 10… up to 60 terms
Dual Coloring
Bull/Bear + Gradient (short = vivid, long = pale)
MTF Ready
Plots daily VWMAs on any lower timeframe (1H, 15M, etc.)
No Lag on Long Sets
Predefined "best setups" eliminate repainting/lag
Transparency Control
Adjustable line opacity for clean visuals
Scalable
Up to 60 VWMAs (max iterations)
Recommended Setups (No Lag)Type
Example Sequence (Start, Inc, Iter)
Long-Term Trend
1, 3, 30 → 1, 4, 7 … 88
93, 3, 30 → 93, 96 … 180
372, 6, 30 → 372, 378 … 546
Short-Term Momentum
1, 1, 30 → 1, 2, 3 … 30
94, 2, 30 → 94, 96 … 152
1272, 5, 30 → 1272, 1277 … 1417
Key Use CasesUse Case
How to Use
1. Multi-Timeframe Trend Alignment
On 1H chart, use 1, 3, 30 daily VWMAs → price above all green lines = strong uptrend
2. Dynamic Support/Resistance
Cluster of long-term pale VWMAs = major S/R zone
3. Early Trend Change Detection
Short-term vivid lines flip from red → green before longer ones = early bullish signal
4. Ribbon Compression/Expansion
Tight bundle → consolidation; fanning out → trend acceleration
5. Mean Reversion Entries
Price far from long-term VWMA cluster + short-term reversal = pullback trade
6. Volume-Weighted Fair Value
Long-period VWMAs reflect true average price paid over weeks/months
Visual Summary
Price ↑
████ ← Short VWMA (vivid green = close > VWMA)
███
██
█
. . . fading to white
█
██
███
████ ← Long VWMA (pale = institutional average)
Green lines = price above VWMA (bullish bias)
Magenta lines = price below VWMA (bearish bias)
Gradient = shorter (left) → brighter; longer (right) → whiter
Ribbon thickness = trend strength (wide = strong, narrow = weak)
Best For Swing traders using daily trend on intraday charts
Volume-based strategies (VWMA > SMA)
Clean, colorful trend visualization without clutter
Institutional fair value anchoring via long-period VWMAs
Pro Tip:
Use Start=1, Increment=3, Iterations=30 on a 4H chart with timeframe="D" → perfect daily trend filter with zero lag and beautiful gradient flow.

Murrey Math SMA up to 32s Murrey Math SMA up to 32s is a highly advanced Pine Script v5 indicator that combines Murrey Math Lines (MML) with a customizable moving average (MA) — including a non-repainting Rolling VWAP (RVWAP) — and dynamic color-coded support/resistance bands up to 1/32 subdivisions. It projects octave-based geometric price levels (like Gann) centered on your chosen MA, with adaptive scaling, angle-based trend coloring, and absolute/extended MML bands. Includes 1/8, 1/16, and 1/32 grid lines, shaded zones, labels, and a live increment display.Core FeaturesFeature
Description
MA Types
SMA, VWMA, VWAP, Period VWAP, RVWAP (rolling VWAP over fixed or adaptive time window)
Murrey Math Grid
Auto-scaled 0/8 to 8/8 + extensions (±3/8), with 1/16 & 1/32 subdivisions
Dynamic Coloring
Bands colored by MA slope angle (bullish/bearish) or absolute MML shift
RVWAP Engine
Non-repainting volume-weighted average over user-defined or adaptive time steps
Wick Filtering
Optional ignore wicks for cleaner MML framing
Resolution Support
Works with higher timeframe data via request.security()
Key Use Cases Use Case
How to Use
1. Precision Support & Resistance
Treat 4/8 (mid) as pivot, 0/8 & 8/8 as extremes. Price often reverses or accelerates at these levels.
2. Mean Reversion Trades
Buy near 0/8–1/8 (oversold), sell near 7/8–8/8 (overbought) when MA is flat or sloping mildly.
3. Trend Continuation
When MA angle > threshold and price breaks 5/8, expect move to 8/8. Confirm with volume.
4. Breakout Entries
Watch for close beyond 8/8 or 0/8 + MA angle steep → strong momentum breakout.
5. Scalping with 1/32 Grid
Use 1/32 lines as micro-targets in ranging markets or after news spikes.
6. Volume-Weighted Fair Value
RVWAP = true average price paid over time → anchor for institutional fair value.
Visual Layout (MA-Centered)
+3/8 ───┐
+2/8 ───┤ ← Strong resistance
+1/8 ───┤
8/8 ███┤ ← Overbought (red zone)
7/8 ───┤
6/8 ███┤
5/8 ───┤
4/8 ███┤ ← Midline (pivot)
3/8 ───┤
2/8 ███┤
1/8 ───┤
0/8 ███┤ ← Oversold (green zone)
-1/8 ───┤
-2/8 ───┤
-3/8 ───┘
Shaded: 0/8–1/8 (buy), 7/8–8/8 (sell), 3/8–5/8 (neutral/consolidation)
MA Line: Orange (RVWAP) or hidden
Labels: Bottom, 1/4, Mid, 3/4, Top (offset to the right)
Table: Shows current Increment size
Best For Swing & scalp traders on stocks, forex, crypto
Volume-based strategies (RVWAP shines in high-volume moves)
Gann/Murrey Math enthusiasts wanting automation + modern MA anchoring

VMMA Ribbon + Q1/Q3 Echo Rayssimulates a series of vwma lines in a wave. Basically puts them in an array and calculates highest lowest values among other things ... The VMMA Ribbon + Q1/Q3 Echo Rays is a Pine Script v5 indicator that combines a dynamic Volume-Weighted Moving Average (VWMA) ribbon with interactive support/resistance "echo rays" based on the ribbon’s inner quartiles (Q1 and Q3). The ribbon is built from multiple VWMAs of increasing lengths, forming a band with an upper edge, lower edge, midline, and Q1/Q3 lines (representing the 25th and 75th percentiles of the band).
Edges are colored by slope (bullish = green, bearish = red) or use a default color.
Echo rays extend horizontally from recent swing lows in Q1 and swing highs in Q3, acting as dynamic support/resistance levels that "echo" past extremes until broken or surpassed.
Key Use CasesUse Case
Description
1. Trend Strength & Direction
Ribbon expansion = volatility; compression = consolidation. Slope-colored edges show momentum shifts early.
2. Dynamic Support & Resistance
Q1/Q3 echo rays mark high-probability reversal zones. Price respecting rays = continuation; break = reversal.
3. Mean Reversion Entries
Buy near Q1 ray in uptrend (oversold within band); sell near Q3 ray in downtrend.
4. Breakout Confirmation
Price breaking upper/lower edge + Q3/Q1 ray termination confirms strong breakout.
5. Volume-Weighted Context
Uses VWMA → more reactive to volume spikes than SMA → better for stocks/crypto with sudden volume surges.

Uptrick: Volume Weighted BandsIntroduction
This indicator, Uptrick: Volume Weighted Bands, overlays dynamic, volume-informed trend channels directly on the chart. By fusing price and volume data through volume-weighted and exponential moving averages, the script forms a core trend line with adaptive bandwidth controlled by volatility. It is designed to help traders identify trend direction, breakout entries, and extended conditions that may warrant take-profits or pullback re-entries.
Overview
The Volume Weighted Bands system is built around a trend line calculated by averaging a Volume Weighted Moving Average (VWMA) and an Exponential Moving Average (EMA), both over a configurable lookback period. This hybrid trend baseline is then smoothed further and expanded into dynamic upper and lower bands using an Average True Range (ATR) multiplier. These bands adapt with market volatility and shift color based on prevailing price action, helping traders quickly identify bullish, bearish, or neutral conditions.
Originality and Unique Features
This script introduces originality by blending both price and volume in the core trend calculation, a technique that is more responsive than traditional moving average bands. Its multi-mode visualization (cloud, single-band, or line-only), combined with selective buy/sell signals, makes it flexible for discretionary and algorithmic strategies alike. Optional modules for take-profit signals based on z-score deviation and RSI slope, as well as buy-back detection logic with cooldown filters, offer practical tools for managing trades beyond simple entries.
Explanation of Inputs
Every user input in this script is included to give the trader control over behavior and visual presentation:
Trend Length (len): Defines the lookback window for both the VWMA and EMA, controlling the sensitivity of the core trend baseline. A lower value makes the bands more reactive, while a higher value smooths out short-term noise.
Extra Smoothing (smoothLen): Applies an additional EMA to the blended VWMA/EMA average. This second-level smoothing ensures the central trend line reacts gradually to shifts in price.
Band Width (ATR Multiplier) (bandMult): Multiplies the ATR to create the width of the upper and lower bands around the trend line. Larger values widen the bands, capturing more volatility, while smaller values narrow them.
ATR Length (atrLen): Sets the length of the ATR used in calculating band width and signal offsets. Longer values produce smoother band boundaries.
Show Buy/Sell Signals (showSignals): Toggles the primary crossover/crossunder entry signals, which are labeled when the close crosses the upper or lower band.
Visual Mode (visualMode): Allows selection between three display modes:
--> Cloud: Shows both bands and the central trend line with a shaded background.
--> Single Band: Displays only the active (upper or lower) band depending on trend state, with gradient fill to price.
--> Line Only: Shows only the trend line for a minimal visual profile.
Take Profit Signals (enableTP): Enables a z-score-based profit-taking signal system. Signals occur when price deviates significantly from the trend line and RSI confirms exhaustion.
TP Z-Score Threshold (tpThreshold): Sets the z-score deviation required to trigger a take-profit signal. Higher values reduce the frequency of signals, focusing on more extreme moves.
Re-Entries (enableBuyBack): Enables logic to signal when price reverts into the band after an initial breakout, suggesting a possible re-entry or pullback setup.
Buy Back Cooldown (bars) (buyBackCooldown): Defines a minimum bar count before a new buy-back signal is allowed, preventing rapid retriggering in choppy conditions.
Buy Offset and Sell Offset: Hidden inputs used to vertically adjust the placement of the Buy ("𝓤𝓹") and Sell ("𝓓𝓸𝔀𝓷") labels relative to the bands. These use ATR units to maintain proportionality across different instruments and timeframes.
Take-Profit Signal Module
The take-profit module uses a z-score of the distance between price and the trend line to detect extended conditions. In bullish trends, a signal appears when price is well above the band and RSI indicates exhaustion; the opposite applies for bearish conditions. A boolean flag is used to prevent retriggering until RSI resets. These signals are plotted with minimalist “X” markers near recent highs or lows, based on whether the market is extended upward or downward.
Re-Entry Logic
The re-entry system identifies instances where price momentarily dips or spikes into the opposite band but closes back inside, implying a continuation of the prevailing trend. This module can be particularly useful for traders managing entries after brief pullbacks. A built-in cooldown period helps filter out noise and prevents signal overloading during fast markets. Visual markers are shown as upward or downward arrows near the relevant candle wicks.
How to Use This Indicator
The basic usage of this indicator follows a directional, signal-driven approach. When a buy signal appears, it suggests entering a long position. The recommended stop loss placement is below the lower band, allowing for some breathing space to accommodate natural volatility. As the position progresses, take partial profits—typically 10% to 15% of the position—each time a take-profit signal (marked with an "X") is shown on the chart.
An optional feature is the buy-back signal, which can be used to re-enter after partial exits or missed entries. Utilizing this can help reduce losses during false breakouts or trend reversals by scaling in more gradually. However, it also means that in strong, clean trends, the full position may not be captured from the start, potentially reducing the total return. It is up to the trader to decide whether to enter fully on the initial signal or incrementally using buy-backs.
When a sell signal appears, the strategy advises fully exiting any long positions and immediately switching to a short position. The short trade follows the same logic: place your stop loss above the upper band with some margin, and again, take partial profits at each take-profit signal.
Visual Presentation and Signal Labels
All signals are plotted with clean, minimal labels that avoid clutter, and are color-coded using a custom palette designed to remain clear across light and dark chart themes. Bullish trends are marked in teal and bearish trends in magenta. Candles and wicks are also colored accordingly to align price action with the detected trend state. Buy and sell entries are marked with "𝓤𝓹" and "𝓓𝓸𝔀𝓷" labels.
Summary
In summary, the Uptrick: Volume Weighted Bands indicator provides a versatile, visually adaptive trend and volatility tool that can serve multiple styles of trading. Through its integration of price, volume, and volatility, along with modular take-profit and buy-back signaling, it aims to provide actionable structure across a range of market conditions.
Disclaimer
This indicator is for educational purposes only. Trading involves risk, and past performance does not guarantee future results. Always test strategies before applying them in live markets.

All-in-One: EMA, ORB, PM, and Anchored VWAPAll-in-One: EMA, ORB, PM, and Anchored VWAP... ema 9/20/50/100/20 + opening range break + premarket high and lows + vwap all in one indicator enjoy.. all these can be turned on and off if you only want vwap and ema or pm and orb etc..

EMA & ORB/PM LevelsScript that combines EMA and opening range and Premarket high and low levels all in one so you can save using three indicators and just use this one.

21 SMA over 200 SMA Bullish Cross Highlighter21 SMA Over 200 SMA — Momentum Cross for BTC Scalpers
A precise and lightweight indicator designed to highlight when short-term momentum aligns with the broader Bitcoin trend.
It visualizes when the 21-period Simple Moving Average (SMA) crosses above the 200-period SMA, often signaling the beginning of a sustained directional move — especially effective on the 1-minute BTC chart during trending market conditions.
Core Concept
When the 21 SMA crosses above the 200 SMA on Bitcoin during an active uptrend, the probability increases that price will continue rising as short-term traders and algorithms join the move.
This indicator helps you identify that momentum shift in real time and react before the breakout gains full traction.
Features
Clear visual label for every bullish cross (21↑200)
Optional bearish cross labels (21↓200)
Optimized for 1m, 5m, and 15m BTC charts
Lightweight and efficient — ideal for multi-chart scalping layouts
Built-in alert conditions for manual alert setup
Excellent synergy with VRVP (Visible Range Volume Profile) for confirming volume-based breakout zones
Suggested Use
Focus on the 1-minute Bitcoin chart for early signals.
When a bullish cross appears, use VRVP to locate high-volume nodes or breakout levels for precise entries.
Confirm alignment on 5m or 15m charts before executing.
Combine with RSI, Stoch RSI, or volume analysis to refine timing and manage risk.
Trading Insight
The 21/200 SMA relationship has long been a trusted tool for trend identification.
When both averages slope upward and the cross occurs above a strong VRVP volume zone, it often marks the start of a new impulsive leg in BTC ideal for short-term scalps or the first confirmation of a broader trend continuation.
Created for disciplined BTC scalpers who value structured setups, clarity, and confirmation through data rather than noise.

EMA21The indicator includes 5x the EMA, which can be freely selected. The default settings are 5 min, 10 min, 15 min, 1 h, and 4 h. If a candle crosses an EMA, the wick of the candle is longer than that of the EMA, and if the candle body is above the EMA, it indicates a buy or sell accordingly.


Goldencross & Deathcross Highlights (50/200 SMA) - Fixed dailyThis indicator visualizes major long-term trend shifts in the market
by tracking the daily 50-day and 200-day Simple Moving Averages (SMAs)
— regardless of your current chart timeframe.
🟩 A green flash (Golden Cross) appears when the 50-day SMA crosses
above the 200-day SMA — signaling potential long-term bullish momentum.
🟥 A red flash (Death Cross) appears when the 50-day SMA crosses
below the 200-day SMA — suggesting potential long-term bearish pressure.
Unlike typical SMA overlays, this script:
• Pulls daily data directly (fixed to daily timeframe)
• Works cleanly on any chart timeframe (5m, 1h, 4h, etc.)
• Avoids clutter by hiding moving average lines
• Shows only short, subtle flashes and one clean marker per event
