DP-OCR MTF & MA 2024This script developed is designed for multi-timeframe analysis of previous open, close, and range, with additional signal plots based on various percentage extension levels. It also incorporates EMA calculations for crossover strategies. Here's a quick breakdown of what the script does:
Key Features:
1. Timeframes:
o Two separate timeframes (TF1 and TF2), which can be set by the user (e.g., 15 mins, 30 mins, daily, etc.). The script computes price actions and extensions for both timeframes. For better analysis, use Daily in TF1 and Weekly in TF2
2. Extension Levels:
o Calculates and plots 10%, 21%, 31%, 51%, and 61% extensions (both positive and negative) for each timeframe.
o The most commonly used extension levels are 61%, 31%, -61%, and -21%.
o These extension levels can be turned on or off by the user.
3. Open/Close/Range:
o Tracks the high, low, open, and close for both timeframes.
o Highlights open/close gaps.
o Plots the previous high/low range for both timeframes with a fill and different colors based on price movement.
How to Use:
• You can toggle specific extension levels on or off in the script’s settings.
• For example, when price hits a +61% extension, it could signal a breakout, and when it hits a -61% extension, it may indicate a potential retracement.
• Use these levels in conjunction with your price action analysis to set entry/exit points or stop-loss levels.
4. Today’s Open:
o Plots today’s opening price for both timeframes.
How to Use:
• Use today’s open as a key reference point to determine the day’s price action.
• Compare today’s open with the previous high/low or extension levels to evaluate possible trends or reversals.
5. EMA Calculations:
o The script calculates 5, 15, and 20 period EMAs and plots them on the chart.
o Additional EMA crossover signals can be included for strategy optimization.
How to Use:
• Observe the EMAs for potential crossover signals. For example, a 5-period EMA crossing above a 15-period or 20-period EMA may signal a buy opportunity, while a crossover in the opposite direction may signal a sell.
• Combine the EMA crossovers with extension levels or previous price data to refine your entries and exits.
Customizations Available:
• Users can select whether to display extension levels for either timeframe.
• The script allows automatic adaptation to intraday, daily, weekly, or monthly timeframes based on the current chart settings.
Moreover, the extension levels are calculated based on the previous period’s range, with the most commonly usable extension levels being 61, 31, -61, and -21. These levels are often used for identifying potential price retracements, breakouts, or reversal points in technical analysis.
Mtfanalysis

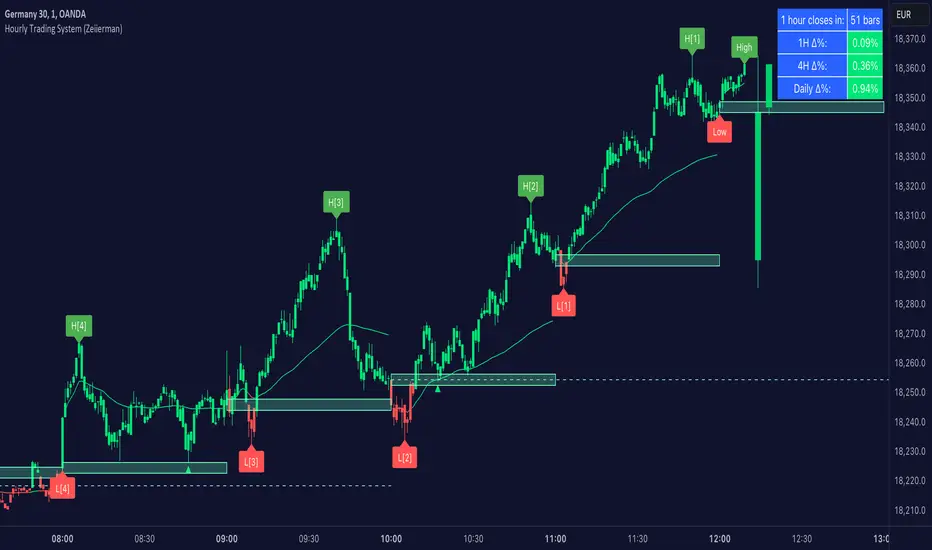
Hourly Trading System (Zeiierman)█ Overview
The Hourly Trading System (Zeiierman) is designed to enhance your trading by highlighting critical price levels and trends on an hourly basis. This indicator plots the open prices of hourly and 4-hour candles, visualizes retests, displays average price lines, and overlays higher timeframe candlesticks. It is particularly beneficial for intraday traders seeking to capitalize on short-term price movements and volume patterns.
█ How It Works
This indicator works by plotting significant price levels and zones based on hourly and 4-hour candle opens. It also includes functionalities for identifying retests of these levels, calculating and displaying average prices, and showing high and low labels for each hour.
█ Timeframe
The Hourly Trading System is designed to be used on the 1-minute or 5-minute timeframe. This system is tailored for intraday trading, allowing traders to find optimal entries around hourly opening levels and providing an easy method to identify the hourly trend. It works effectively on any market.
█ How to Use
Trend Analysis
Quickly gauge where the current price stands relative to key hourly and 4-hour levels. The plotted lines and zones serve as potential support and resistance areas, helping traders identify crucial points for entry or exit.
Utilize the 1-hour average and higher timeframe candles to understand the overall market trend. Aligning intraday strategies with larger trends can enhance trading decisions.
Use the bar coloring to quickly gauge the 1-hour trend on a lower timeframe. The bar colors indicate whether the hourly trend is bullish (green) or bearish (red), helping traders make quicker decisions in alignment with the overall trend.
Retest Identification
Enable retest signals to see where the price retested the hourly open levels. These retest points often signal strong price reactions, offering opportunities for trades based on support/resistance flips.
One effective strategy to incorporate is looking for price flips when a new hour starts. This approach involves monitoring price action at the beginning of each hour. If the price breaks and retests the hourly open level with strong momentum, it could indicate a potential trend reversal or continuation. This strategy is effective in volatile markets where price movements are significant at the start of each new hour.
Liquidity Sweep Strategy
Another common and effective strategy is the liquidity sweep. This involves identifying key levels where liquidity is likely to accumulate, such as previous hour highs and lows, and observing how the price interacts with these price levels. When the price sweeps through these levels, triggering stop-loss orders or pending orders, it often results in a sharp price movement followed by a reversal. Traders can capitalize on these movements by entering trades in the direction of the reversal once the liquidity sweep has occurred.
Equal Highs and Lows Strategy
The Equal Highs and Lows strategy leverages the concept of identifying levels where the price forms multiple highs or lows at the same level over different hourly periods. These equal highs and lows often indicate strong support or resistance levels where liquidity is accumulated. When the price approaches these levels, it is likely to trigger stop-loss orders and lead to significant price movements. Traders can look for breakouts or reversals around these levels to enter trades with higher probability setups.
█ Settings
Zone Width: Specifies the width of the zone around the 1-Hour Open as a percentage. Adjust this to widen or narrow the zone.
Show Retests: Enables or disables the display of retest markers. Retest markers show where the price has retested the 1-Hour Open line.
Number of Retests: Sets the number of retests to display. Adjust this to see more or fewer retest markers.
Volume Filter: Enables or disables the volume filter for retests. Use this to highlight retests with significant volume.
Volume Filter Length: Sets the length of the volume filter, smoothing the volume data to reduce noise.
1-Hour Average Line: Enables or disables the 1-hour average price line. This line shows the average price over the past hour.
Hourly High & Low Labels: Enables or disables the display of hourly high and low labels, marking the highest and lowest prices within each hour.
Candlesticks: Enables or disables the display of candlesticks on the chart, providing a detailed view of price action.
Bar Color: Enables or disables bar coloring based on price direction, with up bars in green and down bars in red.
Timeframe: Sets the timeframe for higher timeframe candles. Adjust this to match the period you want to analyze.
Number of Candles: Sets the number of higher timeframe candles to display. Increase this to see more candles on the chart.
Location: Sets the location for higher timeframe candles, allowing you to position them left or right on the chart.
-----------------
Disclaimer
The information contained in my Scripts/Indicators/Ideas/Algos/Systems does not constitute financial advice or a solicitation to buy or sell any securities of any type. I will not accept liability for any loss or damage, including without limitation any loss of profit, which may arise directly or indirectly from the use of or reliance on such information.
All investments involve risk, and the past performance of a security, industry, sector, market, financial product, trading strategy, backtest, or individual's trading does not guarantee future results or returns. Investors are fully responsible for any investment decisions they make. Such decisions should be based solely on an evaluation of their financial circumstances, investment objectives, risk tolerance, and liquidity needs.
My Scripts/Indicators/Ideas/Algos/Systems are only for educational purposes!
Supply & Demand (MTF) | Flux Charts💎 GENERAL OVERVIEW
Introducing our new Supply and Demand (MTF) Indicator! This new indicator renders Supply and Demand zones based on momentum candles. It can detect Supply and Demand zones across up to 3 diferent timeframes. It's capable of combining zones, retest & break labels and it's customizable with invalidation and style settings.
Features of the new Supply and Demand (MTF) Indicator:
Renders Supply and Demand Zones Across 3 Timeframes
Combination Of Overlapping Zones
Retest & Break Labels
Retest & Break Alerts
Enable / Disable Historic Zones
Visual Customizability
📌 HOW DOES IT WORK ?
Supply and Demand is a key concept in trading. It helps traders see the zones that market-makers buy & sell the asset in large amounts. It's detected by finding momentum candles (candles that have large bodies) in a row.
Momentum candles are defined to have a larger body than the average candle in the chart, and at least 4 of them in a row is required to draw a supply or demand zone. The zone is drawn from the high wick to low wick of two candles before the first momentum candle in the row.
Check this example :
These zones are usually where market makers trade the asset in larger amounts. Thus, they act as support & resistance zones by their nature. A retest of these zones can make the price bounce to the opposite direction, while a breakout usually means strong price action momentum is incoming in that direction. Supply zones indicate bearish momentum while demand zones indicate bullish momentum.
Check this example :
Here a Supply Zone (Bearish) forms. Then price comes back up to test the zone, and it fails to break. After the failed attemp, a stong bearish momentum takes the price back to a lower level. Then another test of the zone occurs and successfully breaks the zone this time. This breakout starts a bullish momentum that takes the price to a higher level.
🚩UNIQUENESS
This indicator provides Supply and Demand zones in your chart with pure simplicity. It supports up to 3 different timeframes as we believe supporting your trades with higher timeframes can improve your trading experience. It also gets rid of complexity by combining overlapping zones into a single zone, even if they are from different timeframes! You can also set-up alerts to get notified when a supply or demand zone is being retested, or is broken. Overall, this indicator is the ultimate kit for supply and demand zones.
⚙️SETTINGS
1. General Configuration
Max Distance To Last Bar -> The maximum distance that the indicator will render supply and demand zones from. Higher settings mean rendering older supply and demand zones.
Zone Invalidation -> Select between Wick & Close price for Supply and Demand Zone Invalidation.
Retests & Breaks -> Enable retest & break labels in your chart.
Show Historic Zones -> This will show historic supply & demand zones which are invalidated if enabled. You can disable this to only see active supply and demand zones for a simpler chart.
2. Timeframes
You can set up to 3 different timeframes and enable / disable them using the checkboxes in this section.

MTF OB Supply Demand ZonesHello everyone,
This exceptional indicator provides you with visual representations of bullish and bearish order blocks or supply and demand zones across multiple timeframes. In simple terms, bullish order blocks are represented by a small red candle followed by a large red candle, while bearish order blocks are depicted as a small green candle followed by a large red candle. Supply and demand zones are drawn by using order blocks.
Features:
Display order blocks from up to three different timeframes.
Customize the maximum number of boxes shown and the colors of the zones.
Choose from three different modes: OB (Order Block), Extended OB, and Supply/Demand.
Mode Descriptions:
OB: Includes the body of the candle.
Extended OB: Encompasses the body and wick of the candle.
Supply/Demand: Covers the body, wick, and half the body of the large candle.
Usage:
Ensure that charts 2 and 3 are set to a higher timeframe. For modes 2 and 3, it’s recommended to reduce the maximum number of boxes shown. The zones or boxes are transparent, allowing for overlap. This feature aids in identifying reversal zones or confirmed zones. The more intense the color, the stronger the confirmation. If a green zone overlaps a red zone (or vice versa), it signifies a reversal zone.
Thank you for checking out this indicator!
---
Additional Information:
Order blocks refer to specific price areas where large market participants, such as institutional traders, have previously placed significant buy or sell orders. These clusters of orders can impact price movement, liquidity, and market sentiment.
Order blocks are a strategic approach to identifying key levels of support and resistance based on the behavior of institutional traders. These key levels are then utilized as entry or exit points for trades.
An order block is an area where there has been a large concentration of limit orders awaiting execution. These blocks are identified on a chart by observing previous price action and pinpointing areas where the price experienced significant movement or abrupt changes in direction.
Order blocks are used in the following popular trading philosophies:
Smart Money Concepts (SMC)
Inner Circle Trading (ICT)
Price Action
---
Credits to: @AGFXTRADING

EMA Cross Dashboard | Flux Charts💎 GENERAL OVERVIEW
Introducing our new Exponential Moving Average (EMA) Cross Dashboard! This dashboard let's you select a source for the calculation of the EMA of it, then let's you enter 2 lengths for up to 5 timeframes, plotting their crosses in the chart.
Features of the new EMA Cross Dashboard :
Shows EMA Crosses Across Up To 5 Different Timeframes.
Select Any Source, Including Other Indicators.
Customizable Dashboard.
📌 HOW DOES IT WORK ?
EMA is a widely used indicator within trading community, it is similar to a Simple Moving Average (SMA) but places more weight on recent prices, making it more reactive to current trends. Crosses of EMA lines can be helpful to determine strong bullish & bearish movements of an asset. This indicator shows finds crosses across 5 different timeframes in a dashboard and plots them in your chart for ease of use.
🚩UNIQUENESS
This dashboard cuts through the hassle of manual EMA cross calculations and plotting. It offers flexibility by allowing various data sources (even custom indicators) and customization through enabling / disabling individual timeframes. The clear visualization lets you see EMA crosses efficiently.
⚙️SETTINGS
1. Timeframes
You can set up to 5 timeframes & 2 lenghts to detect crosses for each timeframe here. You can also enable / disable them.
2. General Configuration
EMA Source -> You can select the source for the calculation of the EMA here. You can select sources from other indicators as well as more general sources like close, high and low price.

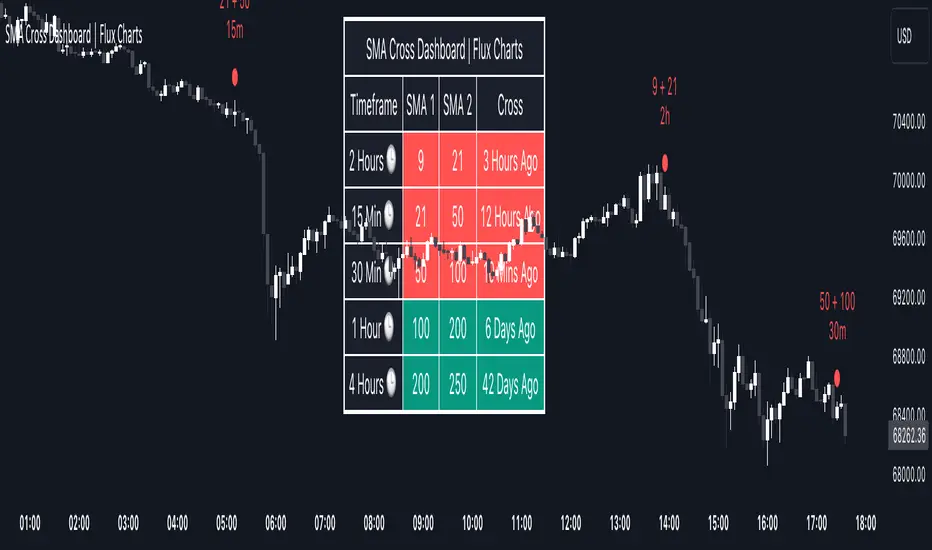
SMA Cross Dashboard | Flux Charts💎 GENERAL OVERVIEW
Introducing our new Simple Moving Average (SMA) Cross Dashboard! This dashboard let's you select a source for the calculation of the SMA of it, then let's you enter 2 lengths for up to 5 timeframes, plotting their crosses in the chart.
Features of the new SMA Cross Dashboard :
Shows SMA Crosses Across Up To 5 Different Timeframes.
Select Any Source, Including Other Indicators.
Customizable Dashboard.
📌 HOW DOES IT WORK ?
SMA is a widely used indicator within trading community, it simply works by taking the mathematical average of a source by desired length. Crosses of SMA lines can be helpful to determine strong bullish & bearish movements of an asset. This indicator shows finds crosses across 5 different timeframes in a dashboard and plots them in your chart for ease of use.
🚩UNIQUENESS
This dashboard cuts through the hassle of manual SMA cross calculations and plotting. It offers flexibility by allowing various data sources (even custom indicators) and customization through enabling / disabling individual timeframes. The clear visualization lets you see SMA crosses efficiently.
⚙️SETTINGS
1. Timeframes
You can set up to 5 timeframes & 2 lenghts to detect crosses for each timeframe here. You can also enable / disable them.
2. General Configuration
SMA Source -> You can select the source for the calculation of the SMA here. You can select sources from other indicators as well as more general sources like close, high and low price.
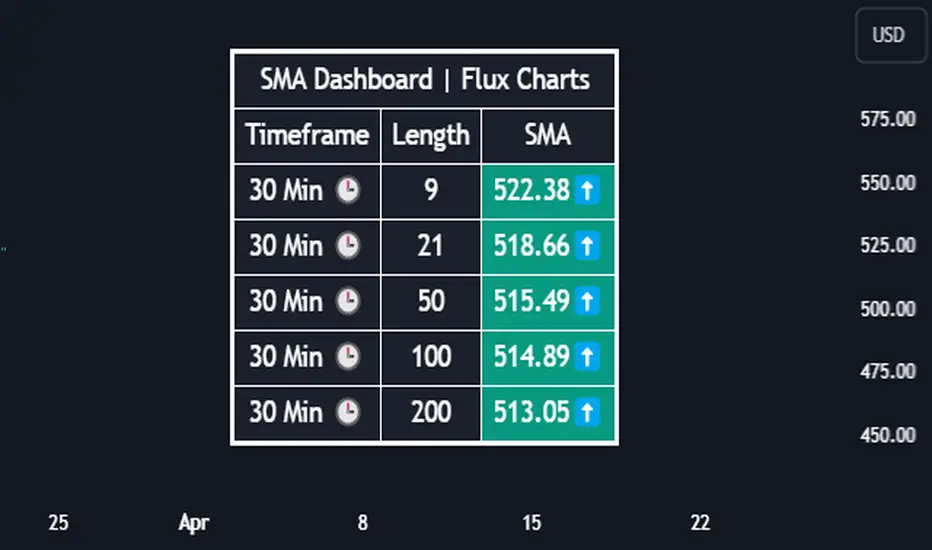
SMA Dashboard | Flux Charts💎 GENERAL OVERVIEW
Introducing our new Simple Moving Average (SMA) Dashboard! This dashboard let's you select a source for the calculation of the SMA of it, then shows it across 5 different lengths and timeframes.
Features of the new SMA Dashboard :
Shows SMA Across 5 Different Lengths & Timeframes.
Select Any Source, Including Other Indicators.
Enable / Disable Plotting Lines.
Customizable Dashboard.
📌 HOW DOES IT WORK ?
SMA is a widely used indicatior within trading community, it simply works by taking the mathematical average of a source by desired length. This indicator then shows it across 5 different timeframes in a dashboard and plots them in your chart for ease of use.
🚩UNIQUENESS
This dashboard cuts through the hassle of manual SMA calculations and plotting. It offers flexibility by allowing various data sources (even custom indicators) and customization through enabling / disabling SMA lines. The clear visualization lets you compare multiple SMAs efficiently.
⚙️SETTINGS
1. Timeframes
You can set up to 5 timeframes & lengths for the dashboard to show here. You can also turn on plotting and enable / disable them.
2. General Configuration
SMA Source -> You can select the source for the calculation of the SMA here. You can select sources from other indicators as well as more general sources like close, high and low price.
Trend Channels (MTF) | Flux Charts💎 GENERAL OVERVIEW
Introducing our new Trend Channels (MTF) indicator! Latest trends play an important role for traders and sometimes it can be hard to spot trends in other timeframes. This indicator can plot latest trend channels across different timeframes, so you can spot trends and their channels easier. More info about the process in the "How Does It Work" section.
Features of the new Trend Channels (MTF) indicator :
Plot Trend Channels Across Up To 3 Different Timeframes
Broad Customizability Of Trend Detection
Variety Of Trend Invalidation Options
High Visual Customizability
🚩UNIQUENESS
While the detection of trend channels is a common concept among traders, trend channels across different timeframes can be as crucial as the ones in the current timeframe. This indicator can find them from up to 3 different timeframes. While the general settings will perform well enough most of the time, the indicator also provides fine-tuning options for trend detection and trend invalidation for more experienced traders.
📌 HOW DOES IT WORK ?
Trend channels occur when the price of an asset starts making a strong movement in a bullish or a bearish direction. This indicator detects trend channels using the Simple Moving Average (SMA). When the slope of the SMA line exceeds the user-defined size, a trend channel will occur.
To understand how individual settings work, you can check the "⚙️SETTINGS" section.
⚙️SETTINGS
1. General Configuration
SMA Length -> Determines the length used in the SMA function. Higher values mean that an average of a longer timespan will be taken into account when spotting trends.
Slope Length -> Used while finding the slope of the trend channel. Check this example for slope length :
ATR Size -> This setting is taken into calculation while checking if a trend channel is worth plotting. The higher this setting is, the higher the slope of the trend channel must be to get rendered. You can take a look at the chart provided above for a visual explanation.
Channel Expander -> When a trend channel occurs, the top and the bottom of the channel are initally determined by the latest highest highs / lowest lows. This setting expands the channel vertically by X times Average True Range (ATR). Check this example :
Trend Invalidation -> The trend channel gets invalidated when the bar closes / wicks above the top of the channel, or below the bottom of the channel. With this setting, you can switch the behaviour between bar close / bar wick.
Avoid False Invalidation -> This setting makes it harder for trend channels to get invalidated to prevent false invalidations.
Retries : The trend channel will have 5 chances for invalidation. First 4 invalidations will not invalidate the channel. The trend channel will only invalidate once the 5th invalidation occur.
Volume : The bar that invalidates the trend channel must have a volume higher than 1.5x the average bar volume of the current chart. Otherwise the trend channel will not be invalidated.
None : The trend channel will invalidate at the first invalidation.

Time Based Comparison Tool [TFO]The goal of this indicator is to show how multiple assets are trading relative to their Previous Highs and Lows. Many traders have probably seen charts resembling this that may plot how asset prices are trading as a percent change over time, or something similar.
The key difference with this indicator is that all prices are normalized to reflect how they are trading with respect to the previous range of a user-defined timeframe. Without the normalization process, we would simply be observing some percent change from a given point in time; but this does not provide enough information to describe where price is trading relative to our desired frame of reference.
For example, if the timeframe setting was chosen to be 1 day, the indicator would plot the Previous High (PH) and Previous Low (PL) of the current symbol on the daily timeframe, denoted here by the black lines and labels. Then, the adjusted price of all selected symbols would be shown to visualize how each one is moving with respect its own PH and PL, using the current symbol's PH and PL as reference points.
In the above chart, we can see that CL was trading below its PDL from about 10:00-11:00 am EST, then broke above and retested it at around 11:20 am EST, before trading higher. To verify that this comparison works as intended, we can check to see that CL did in fact retest its PDL at this time before trading higher. Note that we are using the close price for this evaluation.
Since limiting the output to close prices can leave out some vital information, we can change the Plot Type setting from "Close" to "High to Low," which will instead show the range of prices from high to low instead of just the close.
We can expand on this by detecting when PH's and PL's have been raided (traded through), by displaying the text PHR (Previous High Raid) or PLR (Previous Low Raid) next to the symbol's label on the right. In this case below, where we're using the 1 week timeframe, we can observe that NQ1! (purple) traded through the PL level and thus its label (right) is updated to indicate a PLR.
Similarly, YM1! traded through its PH level and was updated to indicate a PHR; and ES1! raided both levels, with its label reflecting just that.
Due to the native limitation of output series in a single pine script, alerts have been consolidated to "Any PHR" or "Any PLR," meaning these alerts would fire if any of the selected symbols raided a PH or PL, respectively. If one wanted to be alerted for just a specific symbol, this could be achieved by deselecting all symbols except that which is desired, then setting an alert and adjusting its title for easier user recognition.

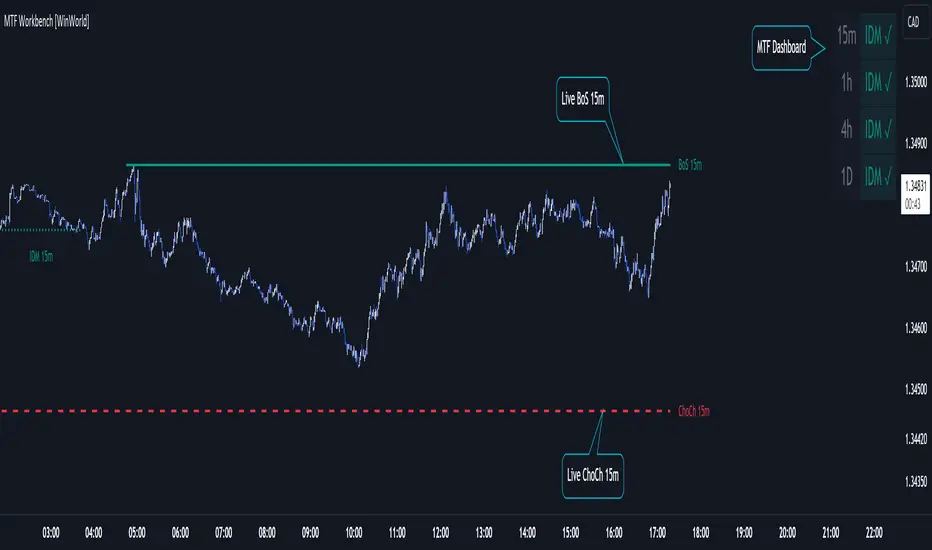
MTF Workbench [WinWorld]WHAT IS THIS?
This is MTF Workbench — an indicator, which is based on World Class SMC, but has one main feature — multi-timeframe analysis.
WHY MAKING MTF FEATURE AS A SEPARATE INDICATOR?
We weren't able to implement this feature in the World Class SMC itself due to huge size and complexity of the script, so we have re-written the entire script and optimized it to implement MTF and decided to make a separate script for MTF features in order to not make World Class SMC any heavier, because otherwise the script would probably not even load up on the chart.
WHAT ARE THE FEATURES?
MTF Workbench has two features for now: dashboard and structure mapping. But there will be more soon!
DASHBOARD
Dashboard gathers data from 4 different timeframes and visualize the results in the nice little table on the chart. It is useful to have a dashboard because it visualizes important data in a simple way.
The settings of the dashboard are:
- Position. this settings has 2 subsettings: vertical position (bottom, middle, top) and horizontal position (left, center, right). These subsettings allow you to place dashboard on any side of the chart;
- Text size. This settings defines size of the text in the dashboard, simple as that;
- Timeframe #1, #2, ..., #4. These four settings allow you to choose 4 different timeframes for the table to gather data from.
How to read the dashboard:
- The colour of the specific data cell is the current trend of selected timeframe;
- IDM ⧖ — price has not reached IDM yet;
- IDM ✓ — price grabbed IDM.
This is it for dashboard, now for structure mapping.
STRUCTURE MAPPING
By structure we mean IDM, BoS and ChoCh (if you don't what this means, refer to World Class SMC description to learn the terms, we won't explain it here). In our main indicator structure was only drawn for the timeframe you were currently using, but now you can choose whatever timeframe you want to get structure from!
Why do this matter? Well, this feature alone allows to perform so called intern-structure analysis, because now you will able to compare current timeframe's structure to a higher timeframe's structure and get an a sufficient amount of edge about what Smart Money are doing.
* And yes, this feature only works for analyzing higher timeframes!
The structure itself is plotted the same way as it is in our main indicator, but we also add timeframe to the specific structure event (event is when price reaches IDM, BoS or ChoCh lines) so you could differentiate internal-structure events from any other events.
Live structure is also available in this indicator.
WHY USE THIS INDICATOR?
Even though there a lot of structure mapping indicators with MTF features, they don't have what MTF Workbench has — the correct core structure-mapping algorithm. We took our core structure-mapping algorithm and put it into MTF Workbench to finally bring MTF analysis to life to work state-of-the-art structure-mapping algorithm, which gives any user a huge edge in the market by a very simple reason — this algorithm actually works. Our algorithm proved itself to be efficient and it helps map structure without human intervention, which is a huge leap in smart money trading. To this day we were not able to find an algorithm which would match the quality of our algo! Which why we think making an MTF version of our algorithm is a good thing to do, because now users can finally work with current timeframe and see information about structure from other timeframes using only ONE chart. If you are smart-money trader, you understand that this is a HUGE thing.
For PineScript moderators
We know the rule not publish slightly modifie version of some indicator as another indicator, but this is not a slightly different version. MTF Workbench was completely re-writtten from scratch and optimized so it could fint PineSript's code restrictions such as 500 max local scopes, which World Class SMC with MTF Workbench's features exceeded way too far.
Also, by referencing our World Class SMC indicator we don't promote it in any way. The reference is only made with purposes of
1) Informational reference to help users learn specific terms.
2) Informational reference to some of the World Class SMC features to give users a clue about what exactly MTF Workbench does.
We hope that you will find a great use from MTF Workbench as we did and it will help your level up your edge!
Sincerely, WinWorld Team.
Automating wealth creation since 2022.
MTF PIVOTSThis is a fairly basic (but hopefully useful) indicator that combines three time-frames of Camarilla pivots into one.
Default time-frames are:
Daily
Weekly
Monthly
Quarterly
Yearly
Time-frames can be modified as you wish, they are just set to these as I generally only trade higher intervals (just note that formatting labels will not change - but you can update these as needed).
The Camarilla pivots displayed are as follows:
- H3, L3, H4, L4
- CPR
- CPR Trails ( To find Virgin CPR)
- PREVIOUS HI,LOW , CLOSE
these are more useful for the majority of traders. The formula for levels.
By default all historical pivot levels are not displayed, as there can be some benefit to mapping these forward once the relevant period has ended. But these find too cluttered I'll look into having an option to display the Historical period as well.
What levels are included?
I have used traditional pivot calculation and included Daily, Weekly, Monthly, Quarterly, and Yearly pivots with high and low.

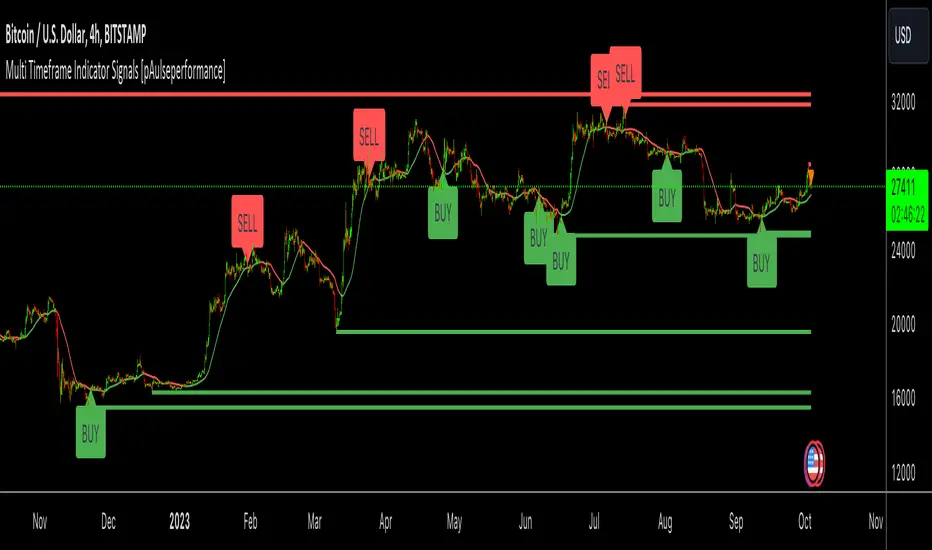
Multi Timeframe Indicator Signals [pAulseperformance]█ Concept:
In this TradingView Pine Script publication, we introduce a powerful tool that offers extensive capabilities for traders and analysts. With a focus on combining multiple indicators, analyzing various timeframes, and fine-tuning your trading strategies, this tool empowers you to make informed trading decisions.
█ Key Features:
1. Combining Multiple Rules with AND / OR Operations
• Example: You can combine the Relative Strength Index (RSI) with the Moving Average Convergence Divergence (MACD) by selecting the "AND" operation. This ensures that you only get a signal when both indicators generate signals. Alternatively, you can add custom indicators and select "OR" to create more complex strategies.
2. Selecting Multiple Indicators on Different Timeframes
• Analyze the same indicator on different timeframes to get a comprehensive view of market conditions.
3. Reversing Signals
• Reverse signals generated by indicators to adapt to various market conditions and strategies.
4. Extending Signals
• Extend signals by specifying conditions such as "RSI cross AND MA cross WITHIN 2 bars."
5. Feeding Results into Backtesting Engine
• Evaluate the performance of your strategies by feeding the results into a backtesting engine.
█ Available Indicators:
External Inputs
• Combine up to 4 custom indicators to assess their effectiveness individually and in combination with other indicators.
MACD (Moving Average Convergence Divergence)
• Analyze MACD signals across multiple timeframes and customize your strategies.
• Signal Generators:
• Signal 1: 🔼 (+1) MACD ⤯ MACD Signal Line 🔽 (-1) MACD ⤰ MACD Signal Line
• Signal 2: 🔼 (+1) MACD ⤯ 0 🔽 (-1) MACD ⤰ 0
• Filter 1: 🔼 (+1) MACD > 0 🔽 (-1) MACD < 0
RSI (Relative Strength Index)
• Utilize RSI signals with flexibility across different timeframes.
• Signal Generators:
• Signal 1: 🔼 (+1) RSI ⤯ Oversold 🔽 (-1) RSI ⤰ Overbought
• Signal 2: 🔼 (+1) RSI ⤰ Oversold 🔽 (-1) RSI ⤯ Overbought
• Filter 1: 🔼 (+1) RSI <= Oversold 🔽 (-1) RSI >= Overbought
MA1 and MA2 (Moving Averages)
• Choose from various types of moving averages and analyze them across multiple timeframes.
• Signal Generators:
• Filter 1: 🔼 (+1) Source Above MA 🔽 (-1) Source Below MA
• Filter 2: 🔼 (+1) MA Rising 🔽 (-1) MA Falling
• Signal 1: 🔼 (+1) Source ⤯ MA 🔽 (-1) Source ⤰ MA
Bollinger Bands
• Multi Time Frame
• Signal Generators:
• Signal 1: 🔼 (+1) Close ⤯ BBLower 🔽 (-1) Close ⤰ BBUpper
• Signal 2: 🔼 (+1) Close ⤰ BBLower 🔽 (-1) Close ⤯ BBUpper
Stochastics
• Customize your MTF Stochastics analysis between Normal Stochastic and Stochastic RSI.
• Signal Generators:
• Filter 1: 🔼 (+1) K < OS 🔽 (-1) K > OB
• Signal 1: 🔼 (+1) K ⤯ D 🔽 (-1) K ⤰ D
• Signal 2: 🔼 (+1) K ⤯ OS 🔽 (-1) K ⤰ OB
• Signal 3: 🔼🔽 Filter 1 And Signal 1
Ichimoku Cloud
• MTF
• Signal Generators:
• Signal 1: 🔼 (+1) Close ⤯ Komu Cloud 🔽 (-1) Close ⤰ Komu Cloud
• Signal 2: 🔼 (+1) Kumo Cloud Red -> Green 🔽 (-1) Kumo Cloud Green -> Red
• Signal 3: 🔼 (+1) Close ⤯ Kijun Sen 🔽 (-1) Close ⤰ Kijun Sen
• Signal 4: 🔼 (+1) Tenkan Sen ⤯ Kijun Sen 🔽 (-1) Tenkan Sen ⤰ Kijun Sen
SuperTrend
• MTF
• Signal Generators:
• Signal 1: 🔼 (+1) Close ⤯ Supertrend 🔽 (-1) Close ⤰ Supertrend
• Filter 1: 🔼 (+1) Close > Supertrend 🔽 (-1) Close < Supertrend
Support And Resistance
• Receive signals when support/resistance levels are breached.
Price Action
• Analyze price action across various timeframes.
• Signal Generators:
• Signal 1 (Bar Up/Dn): 🔼 (+1) Close > Open 🔽 (-1) Close < Open
• Signal 2 (Consecutive Up/Dn): 🔼 (+1) Close > Previous Close # 🔽 (-1) Close < Previous Close #
• Signal 3 (Gaps): 🔼 (+1) Open > Previous High 🔽 (-1) Open < Previous Low
═════════════════════════════════════════════════════════════════════════
Unlock the full potential of these indicators and tools to enhance your trading strategies and improve your decision-making process. With over 10 indicators and more than 30 different ways to generate signals you can rapidly test combinations of popular indicators and their strategies with ease. If your interested in more indicators or I missed a strategy, leave a comment and I can add it in the next update.
Happy trading!
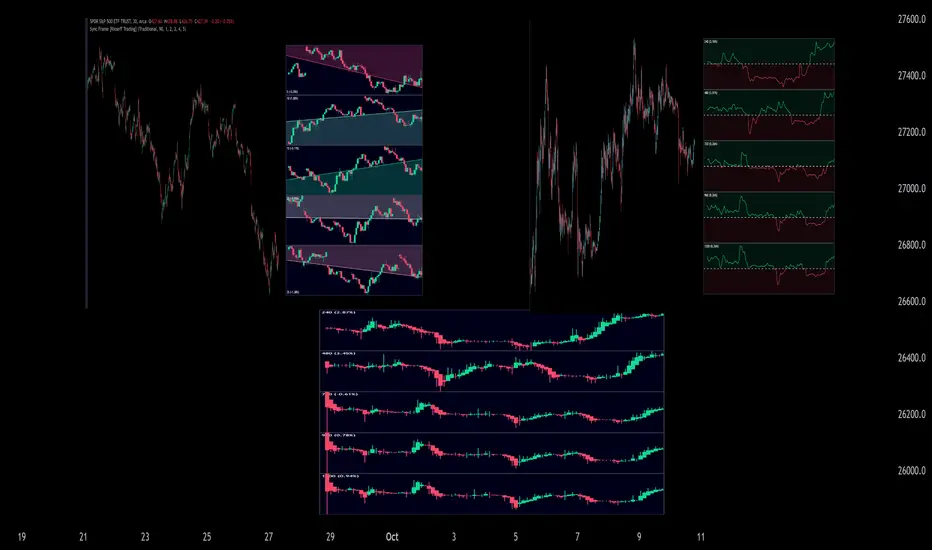
Sync Frame (MTF Charts) [Kioseff Trading]Hello!
This indicator "Sync Frame" displays various lower timeframe charts for the asset on your screen!
5 lower timeframe candle charts shown
Timeframes auto-calculated using the new timeframe.from_seconds() function
Heikin-Ashi candles available
Baseline chart type available
Dynamic Scaling for ease of use
User customizable timeframes
Simple script (:
The image above shows the baseline chart type.
Time image above shows a traditional candlestick chart.
The image above shows a hekin-ashi chart.
The image above shows the indicator when nearly zoomed in as much as possible. The lower timeframe charts adjust to my chart positioning.
The image above shows my screen fully zoomed out; the lower timeframe charts adjust in both height and width to accommodate my chart positioning!
Thank you for checking this out (:
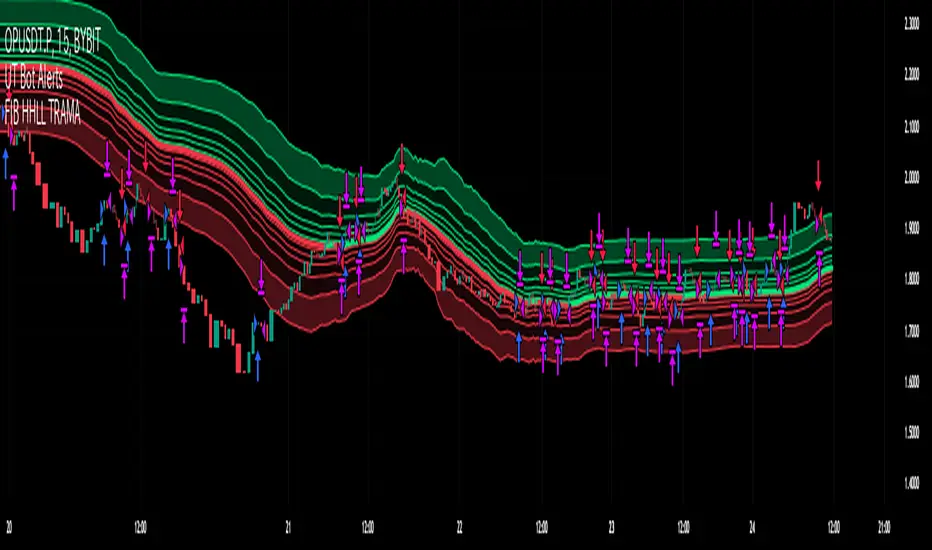
Fibonacci HH LL TRAMA BandLuxAlgo's Trend Moving Adaptive Moving Average was used as a reference to create bands by reading the highest and lowest prices of past bars based on Fibonacci numbers and then multiplying them by the Fibonacci ratio.
LuxAlgo/ LuxAlgo/
In particular, the so-called TRAMA is characterized by its adaptation to the average of the highest and lowest prices over a specific period of time and is used to identify support/resistance.
In order to apply this feature to the maximum extent possible, I used the high or low prices as the source of input, rather than the closing price.
For example,
src = high
not original like
src = close
In addition, I created 6 levels by multiplying the Fibonacci ratio
//Midline
mah = ama1
mal = ama2
m = (mah + mal)/2
//Half Mean Range
dist = (mah - mal)/2
//Levels
h6 = m + dist * 11.089
h5 = m + dist * 6.857
h4 = m + dist * 4.235
h3 = m + dist * 2.618
h2 = m + dist * 1.618
h1 = m + dist * 0.618
l1 = m - dist * 0.618
l2 = m - dist * 1.618
l3 = m - dist * 2.618
l4 = m - dist * 4.235
l5 = m - dist * 6.857
l6 = m - dist * 11.089
If you want to use it for scalping, such as 15 minutes, you can include Fibonacci numbers such as 21,34,55 for a quick reaction type to detect the trend. Also, by including Fibonacci numbers such as 89,144,233, you can see where you stand in the larger trend. Some examples are included below.
For Investors
BTCUSDT 1day Chart Fibonacci number "55"
For Daytraders
BTCUSDT 4hour Chart Fibonacci number "34"
For Scalpers
BTCUSDT 15min Chart Fibonacci number "55"
BTCUSDT 15min Chart Fibonacci number "89"
BTCUSDT 15min Chart Fibonacci number "233"
Fibonacci numbers are 1, 1, 2, 3, 5, 8, 13, 21, 34, 55, 89, 144, 233, 377, 610, etc.,
Fibonacci ratios are 0.618, 1.618, 2.618, 4.236, 6.854, 11.089, etc.,
The Opening Range / First Bar By Market Mindset - Zero To EndlesThe script shows the opening range of the instrument based on different resolutions and timeframes.
Inputs :
1. Resolution
It decides the calculation frequency of the script.
In Auto resolution, Standard values have been used.
2. Timeframe
It decides the timeframe for the OHLC values.
By default, it will use the chart timeframe and so chart OHLC values.
3. Lookback
It decides the no. of ranges shown on the chart.
Middle Line can be hidden from the settings.
The script can be used for any instrument and on any timeframe.
If price is above the opening range or the middle line, a trader should look for long opportunities.
If price is below the opening range or the middle line, a trader should look for short opportunities.
A sideways or choppy move is exoected if Middle line is crossed again and again.
For trading, wait for atleast 1st bar to close. and let the opening range build up first.
Happy Trading

MTF Fusion - SuperTrend [TradingIndicators]SuperTrend is undoubtedly one of the most popular and influential indicators ever developed, and by combining it with our MTF Fusion algorithm, we believe we have made it more useful and powerful than ever with MTF Fusion SuperTrend .
Let's start with a brief review of what the original SuperTrend indicator is and how it works.
What is SuperTrend?
The SuperTrend indicator is a popular technical analysis tool used in financial markets to identify the direction of a trend and potential entry and exit points for trading. It was developed by Olivier Seban, a French trader, and first introduced in his book "Tout le monde peut gagner en bourse" ("Everyone Can Win in the Stock Market") published in 2008.
SuperTrend is based on the concept of Average True Range (ATR) and uses two parameters: the multiplier and the period. The ATR measures the volatility of a financial instrument, and the SuperTrend indicator utilizes this information to plot a line above or below the price chart. It is an 'AITM' (Always In The Market) indicator, which, in its original form, is always 'long' or 'short' - and never 'flat'.
Here's a brief overview of how the SuperTrend indicator works:
Calculation of the ATR: The ATR is calculated using historical price data over a specified period. It measures the average range between high and low prices, reflecting the market's volatility.
Calculation of the upward (long/bullish) and downward (short/bearish) SuperTrend lines: The SuperTrend indicator multiplies the ATR by a specified multiplier (typically 2 or 3) and adds/subtracts the result from the current closing price. This calculation determines the upward and downward SuperTrend lines.
Plotting the Indicator: The SuperTrend indicator plots a line above the price chart when the price is trending upwards, and below the price chart when the price is trending downwards. The distance between the price and the indicator line provides insights into the strength of the trend.
Traders commonly use the SuperTrend indicator to identify potential buy or sell signals. For example, a buy signal may be generated when the price crosses above the indicator line, indicating an uptrend. Conversely, a sell signal may be triggered when the price crosses below the indicator line, signaling a downtrend.
What is MTF Fusion?
Multi-Timeframe (MTF) Fusion is the process of combining calculations from multiple timeframes higher than the chart's into one 'fused' value or indicator. It is based on the idea that integrating data from higher timeframes can help us to better identify short-term trading opportunities within the context of long-term market trends.
How does it work?
Let's use the context of this indicator, which calculates SuperTrend lines, as an example to explain how MTF Fusion works and how you can perform it yourself.
Step 1: Selecting Higher Timeframes
The first step is to determine the appropriate higher timeframes to use for the fusion calculation. These timeframes should typically be chosen based on their ability to provide meaningful price levels and action which actively affect the price action of the smaller timeframe you're focused on. For example, if you are trading the 5 minute chart, you might select the 15 minute, 30 minute, and hourly timeframe as the higher timeframes you want to fuse in order to give you a more holistic view of the trends and action affecting you on the 5 minute. In this indicator, four higher timeframes are automatically selected depending on the timeframe of the chart it is applied to.
Step 2: Gathering Data and Calculations
Once the higher timeframes are identified, the next step is to calculate the data from these higher timeframes that will be used to calculate your fused values. In this indicator, for example, the values of SuperTrend lines are calculated by determining the value of the SuperTrend indicator for all four higher timeframes.
Step 3: Fusing the Values From Higher Timeframes
The next step is to actually combine the values from these higher timeframes to obtain your 'fused' indicator values. The simplest approach to this is to simply average them. If you have calculated the value of a SuperTrend line from three higher timeframes, you can, for example, calculate your 'multi-timeframe fused level' as (HigherTF_SuperTrend_1 + HigherTF_SuperTrend_2 + HigherTF_SuperTrend_3) / 3.0.
Step 4: Visualization and Interpretation
Once the calculations are complete, the resulting fused indicator values are plotted on the chart. These values reflect the fusion of data from the multiple higher timeframes, giving a broader perspective on the market's behavior and potentially valuable insights without the need to manually consider values from each higher timeframe yourself.
What makes this script unique? Why is it closed source?
While the process described above is fairly unique and sounds simple, the truly important key lies in determining which higher timeframes to fuse together, and how to weight their values when calculating the fused end result in such a way that best leverages their relationship for useful TA.
This MTF Fusion indicator employs a smart, adaptive algorithm which automatically selects appropriate higher timeframes to use in fusion calculations depending on the timeframe of the chart it is applied to. It also uses a dynamic algorithm to adjust and weight the SuperTrend calculations depending on each higher timeframe's relationship to the chart timeframe. These algorithms are based on extensive testing and are the reason behind this script's closed source status.
Unlike in the original indicator, flat/'No Trend' areas exist in MTF Fusion SuperTrend!
MTF Fusion SuperTrend only shows a Fusion SuperTrend when the majority of SuperTrends from higher timeframes are in agreement and signaling the same trend direction . So, unlike the original SuperTrend indicator, MTF Fusion SuperTrend sometimes shows no SuperTrend line at all - typically in flat or indecisive areas, which we think is beneficial and helps to filter out noise on smaller timeframes.
Included Features
Fusion SuperTrend lines
Dynamic Multi-Timeframe SuperTrends
Filled zones to highlight trends
Full customization of SuperTrend parameters
Pre-built color stylings
Options
Fusion View: Show/hide the Fusion SuperTrends calculated from multiple higher timeframes
MTF View: Show/hide the SuperTrends from multiple higher timeframes used to calculate the Fusion SuperTrends
Fill Trending Zones: Show/hide the fill for 'trending zones' between price and the Fusion SuperTrends
Multiplier: Sets the multiplier for all SuperTrend calculations
ATR Period: Sets the ATR period for all SuperTrend calculations
Pre-Built Color Styles: Use a pre-built color styling (uncheck to use your own colors)
Manual Color Styles: When pre-built color styles are disabled, use these color inputs to define your own

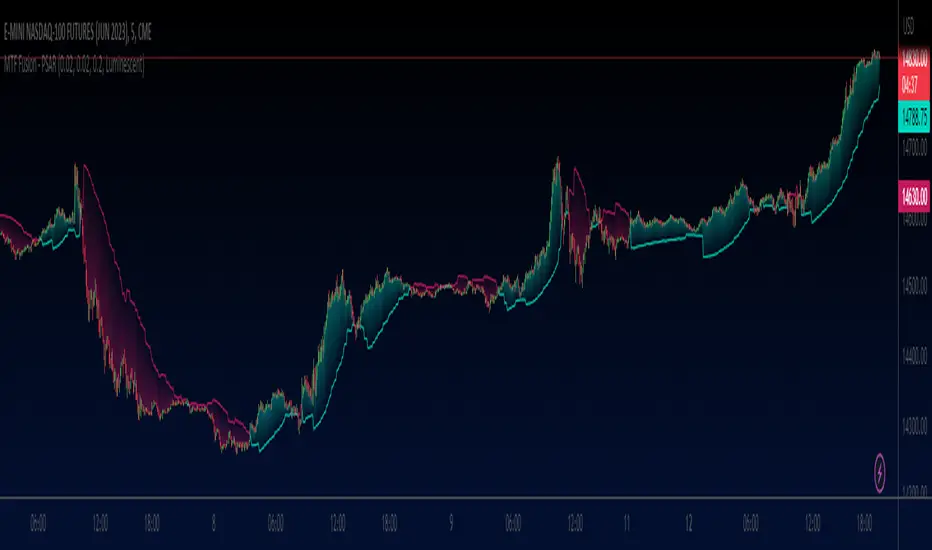
MTF Fusion - PSAR [TradingIndicators]MTF Fusion PSAR intelligently adapts to whatever timeframe you're trading - dynamically calculating Parabolic SAR (Stop and Reverse) levels combined from four appropriate higher timeframes to give you a much broader view of the market and an edge in your trading decisions. It is the third indicator in our MTF Fusion series, and leverages our MTF Fusion algorithm - only this time to visualize J. Welles Wilder Jr.'s famous Parabolic SAR indicator.
What is MTF Fusion?
Multi-Timeframe (MTF) Fusion is the process of combining calculations from multiple timeframes higher than the chart's into one 'fused' value or indicator. It is based on the idea that integrating data from higher timeframes can help us to better identify short-term trading opportunities within the context of long-term market trends.
How does it work?
Let's use the context of this indicator, which calculates PSAR levels, as an example to explain how MTF Fusion works and how you can perform it yourself.
Step 1: Selecting Higher Timeframes
The first step is to determine the appropriate higher timeframes to use for the fusion calculation. These timeframes should typically be chosen based on their ability to provide meaningful price levels and action which actively affect the price action of the smaller timeframe you're focused on. For example, if you are trading the 5 minute chart, you might select the 15 minute, 30 minute, and hourly timeframe as the higher timeframes you want to fuse in order to give you a more holistic view of the trends and action affecting you on the 5 minute. In this indicator, four higher timeframes are automatically selected depending on the timeframe of the chart it is applied to.
Step 2: Gathering Data and Calculations
Once the higher timeframes are identified, the next step is to calculate the data from these higher timeframes that will be used to calculate your fused values. In this indicator, for example, the values of PSAR levels are calculated by determining the value of the PSAR indicator for all four higher timeframes.
Step 3: Fusing the Values From Higher Timeframes
The next step is to actually combine the values from these higher timeframes to obtain your 'fused' indicator values. The simplest approach to this is to simply average them. If you have calculated the value of a PSAR level from three higher timeframes, you can, for example, calculate your 'multi-timeframe fused level' as (HigherTF_PSAR_Level_1 + HigherTF_PSAR_Level_2 + HigherTF_PSAR_Level_3) / 3.0.
Step 4: Visualization and Interpretation
Once the calculations are complete, the resulting fused indicator values are plotted on the chart. These values reflect the fusion of data from the multiple higher timeframes, giving a broader perspective on the market's behavior and potentially valuable insights without the need to manually consider values from each higher timeframe yourself.
What makes this script unique? Why is it closed source?
While the process described above is fairly unique and sounds simple, the truly important key lies in determining which higher timeframes to fuse together, and how to weight their values when calculating the fused end result in such a way that best leverages their relationship for useful TA.
This MTF Fusion indicator employs a smart, adaptive algorithm which automatically selects appropriate higher timeframes to use in fusion calculations depending on the timeframe of the chart it is applied to. It also uses a dynamic algorithm to adjust and weight the PSAR calculations depending on each higher timeframe's relationship to the chart timeframe. These algorithms are based on extensive testing and are the reason behind this script's closed source status.
What is the PSAR indicator?
The Parabolic SAR (Stop and Reverse) indicator is a technical analysis tool that helps identify potential trend reversals in price movements. It was developed by J. Welles Wilder Jr. and is widely used by traders to determine entry and exit points in the market. It consists of levels that are plotted above or below current price. The position of these plots relative to the price provides valuable information about the prevailing trend and potential reversal points.
Here's how the original PSAR indicator works:
Upward Trend: When the Parabolic SAR level is plotted below the price, it indicates an upward trend in the market. The level generally moves closer to the price as the trend progresses. This creates a parabolic curve that rises with time. Traders typically interpret this as a bullish signal, suggesting that it may be a good time to buy or hold positions.
Downward Trend: Conversely, when the Parabolic SAR level is plotted above the price, it indicates a downward trend in the market. The plot generally moves closer to the price as the trend continues, forming a parabolic curve that declines with time. This is considered a bearish signal, suggesting that it may be a suitable time to sell or avoid taking long positions.
Reversal Points: The primary purpose of the Parabolic SAR indicator is to identify potential trend reversals. When the price crosses above or below the Parabolic SAR level, it indicates a possible reversal in the trend.
The Parabolic SAR indicator is versatile and can be used in various market conditions and timeframes. It is particularly useful in trending markets, where it helps traders ride the trend and capture potential profits. However, it's important to note that the Parabolic SAR may generate false signals or provide delayed indications in sideways or choppy markets.
Included Features
Fusion PSAR levels
Filled zones to highlight trends
Full customization of PSAR parameters
Pre-built color stylings
Options
Fusion View: Show/hide the Fusion PSAR levels calculated from multiple higher timeframes
Fill Trending Zones: Show/hide the fill for 'trending zones' between price and the Fusion PSAR levels
Start: Defines the rate at which the PSAR levels move closer to the price during the initial stages of a trend (higher = faster convergence, lower = slower convergence)
Increment: Controls the rate at which the acceleration factor increases or decreases as the trend continues (higher = faster convergence, lower = slower convergence)
Max: Sets a limit on the maximum value that the acceleration factor can reach
Pre-Built Color Styles: Use a pre-built color styling (uncheck to use your own colors)
Manual Color Styles: When pre-built color styles are disabled, use these color inputs to define your own
MTF Smoothable RSI Nexus [DarkWaveAlgo]🧾 Description:
A nexus is a connection, link, or neuronal junction where signals and information are transmitted between different elements.
The MTF Smoothable RSI Nexus indicator serves as a nexus between smoothable, MTF RSIs by facilitating the visualization and interaction of up to six multi-timeframe RSIs, each with its own customizable timeframe, period, coloring customization, and price source. By combining these various RSIs, it helps you create a comprehensive view of MTF momentum trends and dynamics.
It acts as a control center that brings together multiple MTF RSIs and allows you to visualize the interactions between them with exceptional ease-of-use and customizability, helping to provide you with valuable insights into potential trend reversals, momentum shifts, and trading opportunities.
💡 Originality and Usefulness:
While there are other multi-timeframe RSI indicators available, MTF Smoothable RSI Nexus' global smoothing settings offer a flexible take on the development of price momentum across various timeframes. Its semi-transparent overbought and oversold fill zones create a compounding opaqueness when RSIs from multiple timeframes coalesce - making visual assessment of momentum extremes incredibly easy. We also believe it stands above the rest with its sheer quantity and quality of settings, features, and usability.
✔️ Re-Published to Avoid Misleading Values
This script has been re-published to ensure that it does not use `request.security()` calls using lookahead_on to access future data when referencing RSIs from other timeframes. This decreases the likelihood that the indicator will provide deceiving values. This change has been made in accordance with the PineScript documentation: "Using barmerge.lookahead_on at timeframes higher than the chart's without offsetting the `expression` argument like in `close [ ]` will introduce future leak in scripts, as the function will then return the `close` price before it is actually known in the current context" and the Publishing Rule: "Do not use `request.security()` calls using lookahead to access future data". Historical and real-time values may differ when referencing timeframes other than the chart's.
💠 Features:
6 toggleable MTF Smoothable RSIs with customizable timeframes, periods, and price sources
Compounding overbought/oversold filled areas for easy MTF momentum analysis
Aesthetic and flexible coloring and color theme styling options
End-of chart labels and options for ease-of-use and legibility
⚙️ Settings:
Use a Color Theme: When this setting is enabled, all manual 'Bullish and Bearish Colors' are overridden. All plots will use the colors from your selected Color Theme - excepting those plots set to use the 'Single Color' coloring method.
Color Theme: When 'Use a Color Theme' is enabled, this setting allows you to select the color theme you wish to use.
Hide RSIs on Timeframes Lower Than the Chart: When this setting is enabled, any MTF RSI with a timeframe smaller than that of the chart the indicator is applied to will be hidden from view.
Overbought Level: Set the level value for the overbought line.
Oversold Level: Set the level value for the oversold line.
Overbought Color: When 'Use a Color Theme' is disabled, this will set the color for the Overbought Level line.
Oversold Color: When 'Use a Color Theme' is disabled, this will set the color for the Oversold Level line.
Fill Overbought/Oversold Areas: When enabled, the area between any MTF RSI and the Overbought/Oversold level will be filled with semi-transparent coloring if that RSI is above/below the respective level.
Smooth RSIs: When enabled, all MTF RSIs will be processed through an additional smoothing average calculation.
Smoothing Type: Set the calculation type for the smoothing process. Options include: Exponential, Simple, Weighted, Volume-Weighted, and Hull.
Enable: Show/hide a specific MTF RSI.
Timeframe: Set the timeframe for a specific MTF RSI.
Period: Set the lookback period for a specific MTF RSI.
Source Price: Set the source value used for a specific MTF RSI's calculation.
Coloring Method: Set the coloring method for this specific RSI. The coloring method defines how the RSI should be dynamically colored. Options include: 'Single Color' and 'Increasing/Decreasing'.
Bullish Color: When 'Use a Color Theme' is disabled, this will set the 'bullish color' for this specific MTF RSI.
Bearish Color: When 'Use a Color Theme' is disabled, this will set the 'bearish color' for this specific MTF RSI.
Single Color: When the 'Coloring Method' is set to Single Color for this specific RSI, this color option will set the RSI's color.
Enable Label: When enabled, a label will show at the end of the chart displaying the timeframe, period, smoothing type (if any), and current price value of this specific MTF RSI.
Size: Sets the font size of this specific MTF RSI's label.
Label Offset (in Bars): Sets the distance from the latest bar, in bars, at which this specific MTF RSI's label is displayed.
Show Label Line: When enabled, this specific MTF RSI's label will be accommodated by a dashed line connecting it to its plot.
📈 Chart:
The chart shown in this original publication displays the 15 minute chart on ETHUSDT. Displayed on the chart are 4 MTF RSIs: the 15m 14 WMA-Smoothed RSI, 1h 14 WMA-Smoothed RSI, 4h 14 WMA-Smoothed RSI, and the 1D 14 WMA-Smoothed RSI - offering an exemplary view of how you can easily use these MTF RSIs to your advantage in analyzing momentum relationship across multiple timeframes.

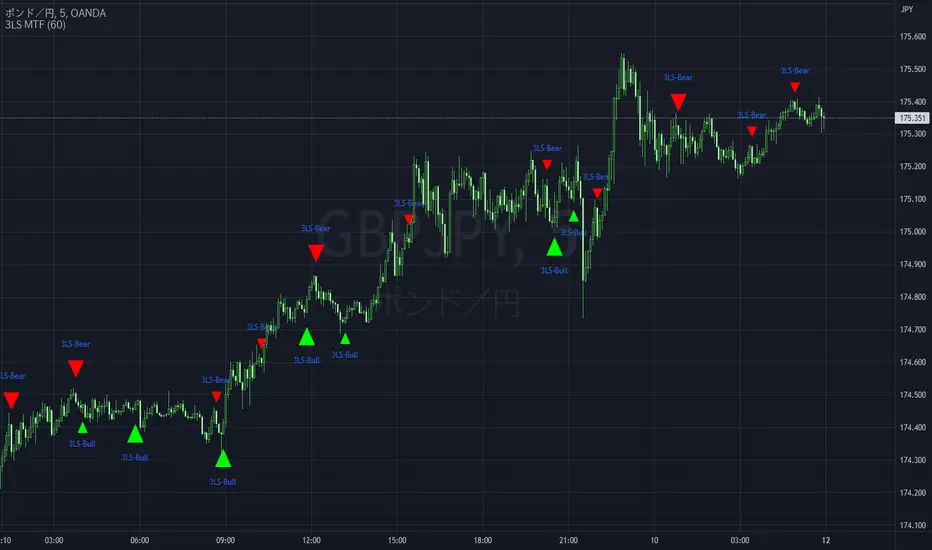
3 Line Strike MTF [MsF]Japanese below / 日本語説明は英文の後にあります。
-------------------------
*This indicator is based on TheTrdFloor's "3 Line Strike ". It's a very cool indicator. thank you.
In addition to the original indicator, it will be judged Engulfing only when the display of the MTF signal and the candle have a difference of 2 times or more.
=== Function description ===
1. Display of the MTF signal
Detects Engulfing of the specified Multi Time Frame. MTF Engulfing is displayed with 🍆 and 🍑.
2. Judged Engulfing on a difference of 2 times or more
Show a signal if the body of the current candle is more than twice as large as the body of the previous candle. This will make the signal mark appear larger than normal.
=== Parameter description ===
- COMMON SETTING
- Show Signal on MTF ? … If the check this, you can get MTF 3 Line Strike
- Judge Double Engulfing ? … If you check it, the signal will come up only when the Engulfing has doubled or more.
- 3 LINE STRIKE
- Show Bearish 3 Line Strike … The Bearish 3 Line Strike (3LS-Bear) is a candlestick pattern comprised of 3 bullish (green) candles, followed by a bearish engulfing candle (see 'Big A$$ Candles' below). This pattern tends to be best used as a signal of the end of a retracement period as part of a trend continuation strategy. Default: Checked
- Show Bullish 3 Line Strike … The Bullish 3 Line Strike (3LS-Bull) is a candlestick pattern comprised of 3 bearish (red) candles, followed by a bullish engulfing candle (see 'Big A$$ Candles' below). This pattern tends to be best used as a signal of the end of a retracement period as part of a trend continuation strategy. Default: Checked
- BIG A$$ CANDLES
- Show Bearish Big A$$ Candles … Bearish 'Big A$$ Candles' are the same as Bearish Engulfing candles.
- Show Bullish Big A$$ Candles … Bullish 'Big A$$ Candles' are the same as Bullish Engulfing candles.
-------------------------
本来のインジケーターに、①MTFシグナルの表示と②ローソク足の表示に2倍以上の差がある場合のみ包み足の判定を追加しました。
=== 機能説明 ===
1. MTFシグナルの表示
指定された時間足の包み足を検出します。 🍆 と 🍑 で表示されます。
2. 2倍以上の差で包み足判定
現在のローソクの実体が前のローソクの実体よりも 2 倍以上大きい場合にシグナルを表示します。マークは通常よりも大きく表示されます。
=== パラメータの説明 ===
- COMMON SETTING
- Show Signal on MTF ? … MTFシグナルを表示します
- Judge Double Engulfing ? … 包み足が前の足の2倍以上になった場合のみシグナルを発報します
- 3 LINE STRIKE
- Show Bearish 3 Line Strike … 陰線が3連続続いた後の包み足を検出します
- Show Bullish 3 Line Strike … 陽線が3連続続いた後の包み足を検出します
- BIG A$$ CANDLES
- Show Bearish Big A$$ Candles … 陽線の包み足を検出します
- Show Bullish Big A$$ Candles … 陰線の包み足を検出します
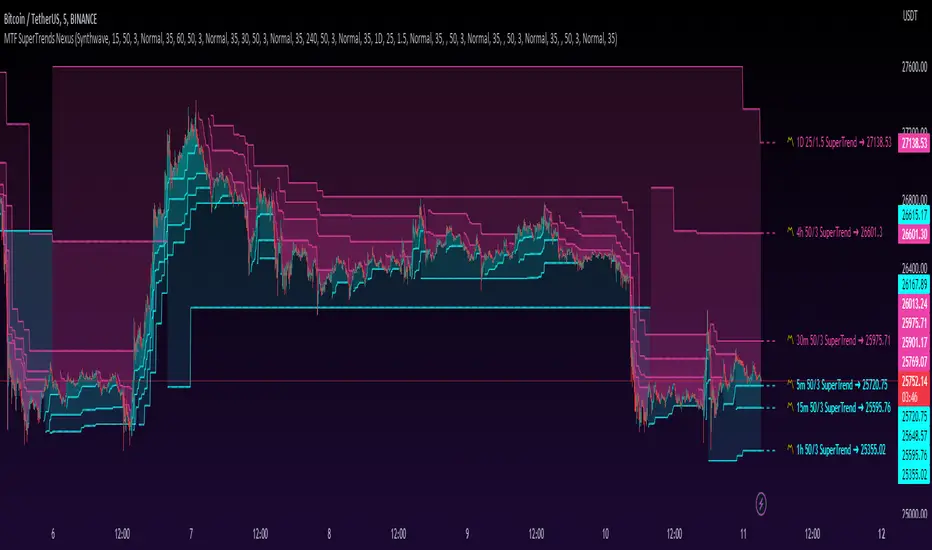
MTF SuperTrends Nexus [DarkWaveAlgo]🧾 Description:
A nexus is a connection, link, or neuronal junction where signals and information are transmitted between different elements.
The MTF SuperTrends Nexus indicator serves as a nexus between MTF SuperTrends by facilitating the visualization of up to eight multi-timeframe SuperTrends, each with its own customizable timeframe, period, factor, and coloring customization. By combining these various SuperTrends, it helps you create a comprehensive view of MTF trend dynamics and cross-timeframe confluence according to the SuperTrend indicator.
It acts as a utility/control center that brings together multiple MTF SuperTrends and allows you to visualize the interactions between them with exceptional ease-of-use and customizability, helping to provide you with valuable insights into potential trend reversals, momentum shifts, and trading opportunities.
💡 Originality and Usefulness:
While there are other multi-timeframe SuperTrend indicators available, MTF SuperTrends Nexus' semi-transparent fills create a compounding opaqueness when SuperTrends from multiple timeframes coalesce - making visual assessment of cross-timeframe confluence extremely easy. We also believe it stands above the rest with its sheer quantity and quality of settings, features, and usability.
✔️ Re-Published to Avoid Misleading Values
This script has been re-published to ensure that it does not use `request.security()` calls using lookahead_on to access future data when referencing SuperTrend calculations from other timeframes. This decreases the likelihood that the indicator will provide deceiving values. This change has been made in accordance with the PineScript documentation: "Using barmerge.lookahead_on at timeframes higher than the chart's without offsetting the `expression` argument like in `close [ ]` will introduce future leak in scripts, as the function will then return the `close` price before it is actually known in the current context" and the Publishing Rule: "Do not use `request.security()` calls using lookahead to access future data". Historical and real-time values may differ when referencing timeframes other than the chart's.
💠 Features:
8 toggleable MTF SuperTrends with customizable timeframes, periods, and factors
Compounding filled areas for easy MTF SuperTrend confluence analysis
Aesthetic and flexible coloring and color theme styling options
End-of chart labels and options for ease-of-use and legibility
⚙️ Settings:
Use a Color Theme: When this setting is enabled, all manual 'Bullish and Bearish Colors' are overridden. All plots will use the colors from your selected Color Theme - excepting those plots set to use the 'Single Color' coloring method.
Color Theme: When 'Use a Color Theme' is enabled, this setting allows you to select the color theme you wish to use.
Fill SuperTrend Areas: When enabled, the area between any MTF SuperTrend and the price bars will be filled with semi-transparent coloring.
Hide SuperTrends on Timeframes Lower Than the Chart: When this setting is enabled, any MTF SuperTrend with a timeframe smaller than that of the chart the indicator is applied to will be hidden from view.
Enable: Show/hide a specific MTF SuperTrend.
Timeframe: Set the timeframe for a specific MTF SuperTrend.
Period: Set the lookback period for a specific MTF SuperTrend.
Factor: Set the multiplier factor used for a specific MTF SuperTrend's calculation.
Bullish Color: When 'Use a Color Theme' is disabled, this will set the 'bullish color' for this specific MTF SuperTrend.
Bearish Color: When 'Use a Color Theme' is disabled, this will set the 'bearish color' for this specific MTF SuperTrend.
Enable Label: When enabled, a label will show at the end of the chart displaying the timeframe, period, factor, and current price value of this specific MTF SuperTrend.
Size: Sets the font size of this specific MTF SuperTrend's label.
Label Offset (in Bars): Sets the distance from the latest bar, in bars, at which this specific MTF SuperTrend's label is displayed.
Show Label Line: When enabled, this specific MTF SuperTrend's label will be accommodated by a dashed line connecting it to its plot.
📈 Chart:
The chart shown in this original publication displays the 5 minute chart on BTCUSDT. Displayed on the chart are 6 MTF SuperTrends: the 5m 50-period/3-factor SuperTrend, 15m 50-period/3-factor SuperTrend, 30m 50-period/3-factor SuperTrend, 1h 50-period/3-factor SuperTrend, 4h 50-period/3-factor SuperTrend, and the 1D 25-period/1.5-factor SuperTrend - offering an exemplary view of how you can easily use these MTF SuperTrends to your advantage in analyzing SuperTrend relationships across multiple timeframes.
MTF MAs and Crosses Nexus [DarkWaveAlgo]🧾 Description:
A nexus is a connection, link, or neuronal junction where signals and information are transmitted between different elements.
The MTF MAs and Crosses Nexus indicator serves as a nexus between MTF Moving Averages by facilitating the visualization and interaction of up to eight multi-timeframe moving averages, each with its own customizable timeframe, period, cross-over and cross-under alerts and plot markers, moving average calculation type, and price source.
It acts as a utility/control center that brings together multiple MTF moving averages (MTF MAs) and allows you to visualize the interactions between them with exceptional ease-of-use and customizability, helping to provide you with valuable insights into potential trend reversals, momentum shifts, and trading opportunities.
💡 Originality and Usefulness:
While there are other multi-timeframe moving average indicators available, MTF MAs and Crosses Nexus' customizable alert and signal settings offer intra-indicator MTF moving average cross markers and alerts not seen in other MTF MA indicators, allowing you to visualize the cross-over and cross-under relationships between the indicator's MAs with an 'all-in-one' experience. We also believe it stands above the rest with its sheer quantity and quality of settings, features, and usability.
✔️ Re-Published to Avoid Misleading Values
This script has been re-published to ensure that it does not use `request.security()` calls using lookahead_on to access future data when referencing moving averages from other timeframes. This decreases the likelihood that the indicator will provide deceiving values. This change has been made in accordance with the PineScript documentation: "Using barmerge.lookahead_on at timeframes higher than the chart's without offsetting the `expression` argument like in `close ` will introduce future leak in scripts, as the function will then return the `close` price before it is actually known in the current context" and the Publishing Rule: "Do not use `request.security()` calls using lookahead to access future data".
💠 Features:
8 toggleable MTF Moving Averages with customizable timeframes, periods, moving average calculation types, and price sources
Customizable cross-over and cross-under alert and chart signal options for each MTF MA (toggleable cross alerts and signals for crosses between intra-indicator MAs and bar price values)
Aesthetic and flexible coloring and color theme styling options
End-of chart labels and options for ease-of-use and legibility
⚙️ Settings:
Use a Color Theme: When this setting is enabled, all manual 'Bullish and Bearish Colors' are overridden. All plots will use the colors from your selected Color Theme - excepting those plots set to use the 'Single Color' coloring method.
Color Theme: When 'Use a Color Theme' is enabled, this setting allows you to select the color theme you wish to use.
Hide MAs on Timeframes Lower Than the Chart: When this setting is enabled, any MTF MA with a timeframe smaller than that of the chart the indicator is applied to will be hidden from view.
Enable: Show/hide a specific MTF MA.
Timeframe: Set the timeframe for a specific MTF MA.
Period: Set the lookback period for a specific MTF MA.
Type: Set the calculation type for a specific MTF MA. Options include: Exponential, Simple, Weighted, Volume-Weighted, and Hull.
Source Price: Set the source value used for a specific MTF MA's calculation.
Enable Cross Over Signals & Alerts: When enabled, cross-over chart signals (markers) and alerts are enabled for when this specific MTF MA crosses above its respective 'Cross Over Cross Source'.
Enable Cross Under Signals & Alerts: When enabled, cross-under chart signals (markers) and alerts are enabled for when this specific MTF MA crosses below its respective 'Cross Under Cross Source'.
Cross Source: Set the target plot which this specific MTF MA must cross (for either a cross-over or cross-under event) to trigger a chart signal and alert.
Marker Position: Set the position where this specific MTF MA's cross chart signal should appear. Options include: Above Bar, Below Bar, and On MA Line.
Coloring Method: Set the coloring method for this specific MA. The coloring method defines how the MA should be dynamically colored. Options include: Single Color, Increasing/Decreasing, and Over/Under Price.
Bullish Color: When 'Use a Color Theme' is disabled, this will set the 'bullish color' for this specific MTF MA.
Bearish Color: When 'Use a Color Theme' is disabled, this will set the 'bearish color' for this specific MTF MA.
Single Color: When the 'Coloring Method' is set to Single Color for this specific MA, this color option will set the MA's color.
Enable Label: When enabled, a label will show at the end of the chart displaying the timeframe, period, MA type, and current price value of this specific MTF MA.
Size: Sets the font size of this specific MTF MA's label.
Label Offset (in Bars): Sets the distance from the latest bar, in bars, at which this specific MTF MA's label is displayed.
Show Label Line: When enabled, this specific MTF MA's label will be accommodated by a dashed line connecting it to its plot.
📈 Chart:
The chart shown in this original publication displays the 15 minute chart on BTCUSDT. Displayed on the chart are 4 MTF MAs: the 15m 20 WMA, 30m 100 EMA, 1h 11 EMA, and 1D 7 VWMA - offering an exemplary view of how you can use these MTF MAs and crosses to your advantage in gauging trend relationships across multiple timeframes.

MTF Fusion - S/R Trendlines [TradingIndicators]MTF Fusion S/R Trendlines intelligently adapt to whatever timeframe you're trading - dynamically calculating support and resistance trendline levels combined from four appropriate higher timeframes to give you a much broader view of the market and an edge in your trading decisions.
These trendlines are not programmed to repaint - so you can use them in real-time just as they appeared historically.
What is MTF Fusion?
Multi-Timeframe (MTF) Fusion is the process of combining calculations from multiple timeframes higher than the chart's into one 'fused' value or indicator. It is based on the idea that integrating data from higher timeframes can help us to better identify short-term trading opportunities within the context of long-term market trends.
How does it work?
Let's use the context of this indicator, which calculates S/R Trendlines, as an example to explain how MTF Fusion works and how you can perform it yourself.
Step 1: Selecting Higher Timeframes
The first step is to determine the appropriate higher timeframes to use for the fusion calculation. These timeframes should typically be chosen based on their ability to provide meaningful price levels and action which actively affect the price action of the smaller timeframe you're focused on. For example, if you are trading the 5 minute chart, you might select the 15 minute, 30 minute, and hourly timeframe as the higher timeframes you want to fuse in order to give you a more holistic view of the trends and action affecting you on the 5 minute. In this indicator, four higher timeframes are automatically selected depending on the timeframe of the chart it is applied to.
Step 2: Gathering Data and Calculations
Once the higher timeframes are identified, the next step is to calculate the data from these higher timeframes that will be used to calculate your fused values. In this indicator, for example, the values of support and resistance trendlines are calculated for all four higher timeframes.
Step 3: Fusing the Values From Higher Timeframes
The next step is to actually combine the values from these higher timeframes to obtain your 'fused' indicator values. The simplest approach to this is to simply average them. If you have calculated the value of a support trendline from three higher timeframes, you can, for example, calculate your 'multi-timeframe fused trendline' as (HigherTF_Support_Trendline_1 + HigherTF_Support_Trendline_2 + HigherTF_Support_Trendline_3) / 3.0.
Step 4: Visualization and Interpretation
Once the calculations are complete, the resulting fused indicator values are plotted on the chart. These values reflect the fusion of data from the multiple higher timeframes, giving a broader perspective on the market's behavior and potentially valuable insights without the need to manually consider values from each higher timeframe yourself.
What makes this script unique? Why is it closed source?
While the process described above is fairly unique and sounds simple, the truly important key lies in determining which higher timeframes to fuse together, and how to weight their values when calculating the fused end result in such a way that best leverages their relationship for useful TA.
This MTF Fusion indicator employs a smart, adaptive algorithm which automatically selects appropriate higher timeframes to use in fusion calculations depending on the timeframe of the chart it is applied to. It also uses a dynamic algorithm to adjust and weight the lookbacks used for trendline calculations depending on each higher timeframe's relationship to the chart timeframe. These algorithms are based on extensive testing and are the reason behind this script's closed source status.
Included Features
Fusion Support and Resistance Trendlines
Dynamic Multi-Timeframe Trendlines
Breakaway Zone fills to highlight breakouts and breakdowns from the Fusion trendlines
Customizable lookback approach
Pre-built color stylings
Options
Fusion View: Show/hide the Fusion trendlines calculated from multiple higher timeframes
MTF View: Show/hide the trendlines from multiple higher timeframes used to calculate the Fusion trendlines
Breakaway Zones: Show/hide the fill for zones where price breaks away from the Fusion trendlines
Lookback: Select how you want your trendlines to be calculated (longer = long-term trendlines, shorter = short-term trendlines)
Pre-Built Color Styles: Use a pre-built color styling (uncheck to use your own colors)
Manual Color Styles: When pre-built color styles are disabled, use these color inputs to define your own

Ichimoku Z-Score Stochastic Oscillator with Kumo Depth Analysis---
Ichimoku Z-Score Stochastic Oscillator with Kumo Depth Analysis
---
Script Overview
Welcome to the Advanced Ichimoku Z-Score Stochastic Oscillator with Kumo Depth Analysis. This unique strategy is designed to provide a comprehensive, multi-timeframe trading view by leveraging the Ichimoku Cloud, Z-Score, Stochastic Oscillator, and an innovative implied volatility measure – the Kumo Depth. By integrating these powerful tools into one script, traders can make more informed decisions by considering trend strength, volatility, and volume in one holistic view.
Rationale & Strategy
The script was created with the rationale that trading decisions should not only be based on price action and volume, but also on market trend strength and implied volatility. The script integrates these various elements:
The Ichimoku Cloud, a versatile indicator that provides support and resistance levels, trend direction, and momentum all at once.
The Z-Score, a statistical measurement of a value's relationship to the mean (average) of a group of values.
The Stochastic Oscillator, a momentum indicator that uses support and resistance levels to determine probable trend reversals.
The Kumo Depth Analysis, an innovative measure of implied volatility and market trend strength derived from the thickness of the Ichimoku Cloud.
How It Works
This script works by providing visual buy and sell signals based on the confluence of the aforementioned tools.
Ichimoku Cloud and Z-Score: The script first calculates the Ichimoku Cloud lines for both a higher and lower timeframe and measures how much current prices deviate from the cloud using Z-Score.
Stochastic Oscillator: This Z-Score is then inputted into a Stochastic Oscillator, thus giving the oscillator a more normalized range.
Kumo Depth Analysis: Simultaneously, the thickness of the Ichimoku Cloud (Kumo) is calculated as an implied volatility indicator. This depth is normalized and used as a filter to ensure we are trading in a market with substantial trend strength.
Signals: Buy and sell signals are triggered based on the crossover and crossunder of the Stochastic Oscillator lines. Signals are then filtered based on their location relative to the Ichimoku Cloud (price should be above the cloud for buy signals and below for sell signals) and the normalized Kumo Depth.
How to Use
Signal Types: The script provides both strong and weak signals. Strong signals are accompanied by high volume, while weak signals are not. Strong buy signals are indicated with a green triangle at the top, strong sell signals with a red triangle at the bottom. Weak signals are shown as blue and yellow circles, respectively.
Trend Strength: The trend strength is shown by the normalized Kumo Depth. The greater the Kumo Depth, the stronger the trend.
Timeframes: You can customize the timeframes used for the calculations in the input settings.
Adjustments: Users can adjust parameters such as the Ichimoku settings, Stochastic Oscillator settings, timeframes, and Kumo Depth settings to suit their trading style and the characteristics of the asset they are trading.
This script is a complete trading strategy tool providing multi-timeframe, trend-following, and volume-based signals. It's best suited for traders who understand the concepts of trend trading, stochastic oscillators, and volatility measures and want to incorporate them all into one powerful, comprehensive trading strategy.
