3 Zigzag for MTF Fib Alert [MsF]Japanese below / 日本語説明は英文の後にあります。
-------------------------
This indicator that automatically displays Fibonacci from each High & Low based on 3 Zigzags. It's useful for multi-timeframe analysis.
For example, Fibonacci calculated from the high and low prices (Zigzag 3 Period=100) of the upper timeframe can be displayed on the lower timeframe.
Also, you can set alerts for each Fibonacci point. It is useful when you are waiting for the price to return to the discount (50% or less) or the premium (50% or more) of the upper timeframe.
"Fib 1 - Crossing 0.00" … Trigger an alert when crossing the 0% line in Fibonacci of Zigzag1
"Fib 1 - Crossing 100.0" … Trigger an alert when crossing the 100% line in Fibonacci of Zigzag1
"Fib 1 - Crossing 23.6" … Trigger an alert when crossing the 23.6% line in Fibonacci of Zigzag1
"Fib 1 - Crossing 38.2" … Trigger an alert when crossing the 38.2% line in Fibonacci of Zigzag1
"Fib 1 - Crossing 50.0" … Trigger an alert when crossing the 50.0% line in Fibonacci of Zigzag1
"Fib 1 - Crossing 61.8" … Trigger an alert when crossing the 61.8% line in Fibonacci of Zigzag1
"Fib 1 - Crossing 76.4" … Trigger an alert when crossing the 76.4% line in Fibonacci of Zigzag1
*Same as Zigzag 1 and Zigzag 2 too.
"Choose Zig Zag Leg for fib" parameter means...
Latest : Calculate Fibonacci based on "the most recent Zigzag line".
Previous : Calculate Fibonacci based on "the previous Zigzag line".
-------------------------
3つのZigzagを元に各High&Lowからフィボナッチを自動で表示するインジケーターです。
Zigzagの期間を工夫することで、マルチタイムフレーム分析に役立ちます。
例えば、以下の設定とした場合:
Zigzag 1 Period … 8
Zigzag 2 Period … 25
Zigzag 3 Period … 100
上位時間足Zigzag(Period=100)の高値安値から形成されるフィボナッチを下位時間足に表示することができるのです。
また、このインジケーターではフィボナッチのポイント毎にアラートの設定が可能です。
上位時間足の割安価格(50%以下)や割高価格(50%以上)に価格が戻ってくるのを待っている時などに力を発揮してくれます。
"Fib 1 - Crossing 0.00" … Zigzag1のフィボナッチにおいて、0%ラインとクロスした場合にアラートを発報します
"Fib 1 - Crossing 100.0" … Zigzag1のフィボナッチにおいて、100%ラインとクロスした場合にアラートを発報します
"Fib 1 - Crossing 23.6" … Zigzag1のフィボナッチにおいて、23.6%ラインとクロスした場合にアラートを発報します
"Fib 1 - Crossing 38.2" … Zigzag1のフィボナッチにおいて、38.2%ラインとクロスした場合にアラートを発報します
"Fib 1 - Crossing 50.0" … Zigzag1のフィボナッチにおいて、50.0%ラインとクロスした場合にアラートを発報します
"Fib 1 - Crossing 61.8" … Zigzag1のフィボナッチにおいて、61.8%ラインとクロスした場合にアラートを発報します
"Fib 1 - Crossing 76.4" … Zigzag1のフィボナッチにおいて、76.4%ラインとクロスした場合にアラートを発報します
※Zigzag1およびZigzag2のフィボナッチも同様
"Choose Zig Zag Leg for fib"パラメータについて:
Latest … 一番新しいZigzagのライン(UpまたはDown)を元にフィボナッチを計算します。
Previous … ひとつ前のZigzagのライン(UpまたはDown)を元にフィボナッチを計算します。
Multi-timeframe

Multi TF High/Low/Open/Close LineNOTE: I'm not sure why the screengrab isn't showing the lines. They are there, and when I share the chart from this link they are there.... idk
This is a requested spin-off version of my previous HLOC for the Daily/Weekly/Monthly that allows users to choose 3 different timeframe units (Mins, Hours, Days, etc...) from the dropdown menu and then select the lookback period in which to draw the HLOC.
I've had quite a few requests to allow users to see multiple lookbacks for the same timeframe unit, mostly weekly, and I did not wish to change that particular script for that purpose. However, I was able to take the existing script and alter it for user input.
This indicator draws a line on the TF 1, TF 2, and TF 3 bar at the High, Low, Open and Close of user input Timeframe unit and selected lookback period.
The lookback period will go back the number of candles entered. So for example if you choose a 5 Min chart with a lookback of 3, the lines will be drawn on the HLOC 3 closed 5 min candles back. Selecting 0 will show data on the current Real-Time candle.
An example of a request I have gotten was for last week, the previous week and the previous month. The settings for that would be: TF 1 - 1 week Lookback 1, TF 2 - 1 week Lookback 2, TF 3 - 1 month Lookback 1.
Each set of lines has an optional identifying label with its own color set that can be shown with or without price value, and has drop down menus for size and style of each set of labels. The TF unit value is displayed on the label, but not the lookback.
So if you are using the hourly on all 3 TF's with different lookback periods, they will all say "60" on the label.
I recommend using the line and label options to distinguish between the different lookback values.
Each set of lines has inputs for line/text color, line width and style and each line argument can be selected independently.
In the chart example I have displayed only the High and Low on three 1 hour TF's with the lookback of 4, 5 and 6 candles with the labels descending in size. With this data I can see that over the last 6 hours the price of ES is in an descending pattern and I should be on alert for a break.
Since I trade ES in RTH on a much lower timeframe, this data can alert me to a bigger picture potential trend change or continuation. I would personally use this with pivot data for timing and look for entries in areas of high volume that moved price to a new
high or low that have not been retested.
I will be looking to add a user input offset for labels in the future. I have had bad luck with it in the past working for a couple weeks and then throwing an error, but I will look into it again soon.
I also recommend going into Chart Settings/Status Line and turning off indicator arguments OR moving the script to the top of the indicator list to avoid obstructed chart view with this indicators arguments. When script allows, I will update it to hide them.

Black RSI (Pro Suite)Black RSI (Pro Suite) is combination of RSI (Relative Strength Index), Volume RSI, Heikin Ashi RSI & other multi Oscillators with multi features into one indicator, features like (Quad Divergences, Multi Time Frame RSI, MTF RSI Panel, Oscillator Support/Resistance/Wedges/Trendlines, Oscillator Moving Average/BBs, Smooth RSI, RSI Price Estimator, Oscillator Over bought/sold Bars, Osc OB/OS Zones, Osc OB/OS Highlights, additionally Black RSI indicator is flexible & completely customizable).
Indicator goal: I have tried my best to organized RSI & other suitable oscillators and oscillator useful tools into one simple and free indicator for Tradingview users (specifically for Tradingview 'basic' subscription users). suggestions are always welcome. please give feedback & appreciate if you like my work.
Black RSI Indicator Features Summary:
Black RSI indicator includes many features mainly relevant to RSI and other Oscillators, these are briefly highlighted below:
Black RSI Dashboard
Multi Oscillators: Choose between multiple oscillators. All oscillators settings are customizable.
Multi Symbol: Multi Symbol Support, applicable on all oscillators
RSI (Relative Strength Index)
VRSI (Volume Relative Strength Index)
HA RSI (Heikin Ashi Relative Strength Index)
OBV (On Balance Volume)
CVD (Comulative Volume Delta)
MFI (Money Flow Index)
UO (Ultimate Oscillator)
MOM (Momentum Oscillator)
ATR (Average True Range)
Stoch (Stochastic Oscillator)
Stoch RSI (Stochastic RSI)
Oscillator Primary Tools ◢
Oscillator Moving Average/Bollinger Bands
Smooth RSI
Multi Timeframe RSI
Multi Timeframe RSI Panel
RSI Price Estimator
Oscillator Support/Resistance/Wedges/Trendlines
Oscillator Moving Average/BBs: Shows Moving Average for selected oscillator.
Smooth Smooth: Smooths out RSI
Multi Timeframe RSI: Displays Multiple Time Frame/Multiple Symbol RSI and converts it and shows it as it is in current time frame without effecting Primary RSI
Multi Timeframe RSI Panel: Displays Multiple Time Frame/Multiple Symbol RSI values of user input specific timeframes in compact panel (max 8 Time frames)
RSI Price Estimator: Calculates RSI estimate price values of 3 different user specific RSI input levels, RSI x MA cross price and RSI future value of user specific price input level.
Oscillator Support/Resistance/Wedges/Trendlines: Draws Trendlines, Wedges and Support & Resistance lines on selected oscillator
Oscillator Quad Divergence ◢
1st Oscillator Divergence: Traditional divergence indicator with enhancements & customization
2nd Oscillator Divergence: Traditional divergence indicator with enhancements & customization
3rd Oscillator Divergence: Advanced Divergence indicator with source selection, RSI/Price threshold, potential divergences & customization
4th Oscillator Divergence: Pivots divergence indicator with flexible pivots selection & customization
Regular bullish divergences are indicated when price is forming lower lows while an oscillator shows higher lows.
Regular bearish divergences are indicated when price is forming higher highs while an oscillator shows lower highs.
While regular divergences indicate trend reversals, hidden divergences indicate a trend continuation.
When the price is making higher lows and the oscillator is showing lower lows, we speak of a bullish hidden divergence.
When the price is making lower highs and the oscillator shows higher highs, it's a bearish hidden divergence.
Oscillator Secondary Tools ◢
Oscillator HH/LL pivots
Osc OB/OS Color Bars
Osc OB/OS Zones
Osc OB/OS Highlights
Background
Oscillator HH/LL pivots: Shows HH/LL pivot points on selected oscillator
Osc OB/OS Color Bars: Plots color chart bars based on RSI, MFI, Stochastic, Stochastic RSI or combine overbought/oversold conditions
Osc OB/OS Zones: Plots Osc OB/OS Zones with user input levels
Osc OB/OS Highlights: Highlight oscillator OB/OS background area
Background: background color customization
+ Primary RSI Settings ▾
- Primary RSI Length: User input RSI Length value
- Primary RSI Source: User RSI Source selection
- RSI Overbought Threshold: Allows the user to set the RSI overbought threshold value. This Overbought Threshold value will also be applied on "RSI Divergence overbought condition", "RSI OB Color Bars" and "Primary RSI Color Schemes
- RSI Oversold Threshold: Allows the user to set the RSI oversold threshold value. The lower band (oversold line) of RSI. This Oversold Threshold value will also be applied on "RSI Divergence oversold condition", "RSI OS Color Bars" and "Primary RSI Color Schemes
- RSI Middle Band: Allows the user to set the RSI middle band value. This value will also applied to "Center Line" color scheme from "Primary RSI Color Schemes" drop menu
- Primary RSI Colors:
Range color specifies a gradient of colors from the overbought to the oversold threshold user inputs from "Primary RSI" section. Color interpolation also a gradient but smoother than Range color. Center Line is similar but is not a gradient, linked to Middle Band ("Primary RSI" section) and changes color with RSI Middle Band. Traditional is simple with Overbought and Oversold colors change.
- RSI Bullish Band: Allows the user to plot extra/optional RSI band on RSI Oscillator (Note: it will not be plotted if "OB/OS Zone only" enabled from "OB/OS Zone Settings" section)
- RSI Bearish Band: Allows the user to plot extra/optional RSI band on RSI Oscillator (Note: it will not be plotted if "OB/OS Zone only" enabled from "OB/OS Zone Settings" section)
+ Primary RSI Smooth Settings ▾
- Smooth Moving Average Type: User selected Smooth MA type. With RSI Smooth enabled, will also effect all RSI Divergences detection (all divergences will be plot according to "Smoothed RSI line")
- Smooth Moving Average Length: User input Smooth MA length value
+ Oscillator Moving Average Settings ▾
- Osc Moving Average Colors: Allows user to select Bullish/Bearish colors of Oscillator Moving Average
- Osc Moving Average Type: Allows user to select Oscillator MA Type
- Osc Moving Average Length: User input Oscillator MA length value
- Osc Moving Average Thickness: User input Oscillator MA thickness
- BB StdDev: user input Bollinger Bands standard deviation value
+ Stochastic Oscillator Settings ▾
- Same as Traditional/Default indicator
+ Stochastic RSI Oscillator Settings ▾
- Same as Traditional/Default indicator
+ Money Index Flow Settings ▾
- Same as Traditional/Default indicator
+ Ultimate Oscillator Settings ▾
- Same as Traditional/Default indicator
+ Momentum Oscillator Settings ▾
- Same as Traditional/Default indicator
+ Average True Range Settings ▾
- Same as Traditional/Default indicator
+ Multi Timeframe RSI Settings ▾
- MTF RSI Time Frame: Allows user to select MTF RSI Time Frame
- MTF RSI Symbol: Allows user to select MTF RSI Time Symbol
- MTF RSI Length: User input MTF RSI length value
- MTF RSI Source: User selected MTF RSI source
- MTF RSI Line Width: User input MTF RSI line thickness value
- Number of Bars for MTF RSI plot
- MTF RSI Color > OB color > OS color : Allows user to select MTF RSI color with additionally Overbought/Oversold colors
+ MTF RSI Panel Settings ▾
- Select MTF RSI Type: If "Primary RSI" or "Volume RSI" selected MTF RSI Panel will show output values based on "Primary RSI" or "Volume RSI" parameters e.g. source, length, but without smooth.
- MTF RSI Panel Symbol: Allows user to select MTF RSI Panel symbol, leave symbol blank or uncheck "checkbox" for current chart symbol
- Show Symbol in Panel: Shows symbol ticker(current or user selected) in MTF RSI Panel
- Panel Background: Allows user to select MTF RSI Panel Background (enable/disable) and Background color selection
- TF1: MTF RSI Timeframe 1 user selection
- TF2: MTF RSI Timeframe 2 user selection
- TF3: MTF RSI Timeframe 3 user selection
- TF4: MTF RSI Timeframe 4 user selection
- TF5: MTF RSI Timeframe 5 user selection
- TF6: MTF RSI Timeframe 6 user selection
- TF7: MTF RSI Timeframe 7 user selection
- TF8: MTF RSI Timeframe 8 user selection
- Panel Top Offset: MTF RSI Panel offset input value
- Position: MTF RSI Panel position selection
- Text Size: MTF RSI Panel text size selection
- Bullish Colors: MTF RSI Panel bullish color selection. (Bullish colors range RSI >75, <75 to >65, <65 to >55)
- Bearish Colors: MTF RSI Panel bearish color selection. (Bearish colors range RSI <45 to >35, <35 to >25, <25)
+ RSI Price Estimator Settings ▾
- Price 1: User input value for RSI future price
- Price 2: User input value for RSI future price
- Price 3: User input value for RSI future price
- Panel Position Offset: User input value for panel position offset
- Price Decimals: User input value for output price decimals in panel
- Show RSI/OscMA cross Price: Enable/Disable RSIxOscillator MA cross future price
- Show RSI Level for Input Price: User input price for future RSI level
- Invisible Background: Enable/Disable Background
Auto Text Color > Auto color change of Panel text according to Dark/Light chart theme
+ Oscillator Support/Resistance Settings ▾
- Show Support line: Allows user to Enable/Disable Oscillator support line
Color > Auto Color: Auto color change of support line according to Dark/Light chart theme
- Show Resistance line: Allows user to Enable/Disable Oscillator resistance line
Color > Auto Color: Auto color display of resistance line according to Dark/Light chart theme
- Lookback lows/highs: User input of Lookback lows/highs value
- Distance threshold: Distance from the line to the low
- Line touch points: Number of points that have to be around the line
- Low/High left bars: User input of Low/High left bars value
- Low/High right bars: User input of Low/High right bars value
- Line style: User selection of line style
- Line thickness: User input of line thickness value
+ Oscillator 1st Divergence Settings ▾
- Divergence Source: User selection of divergence source. "High/Low" (high/low of oscillator/price divergence detection), "Close" (close of oscillator/price divergence detection) and "Both" (Both Close + High/Low of oscillator/price divergence detection). (Note: Traditional Divergence indicator default source is "High/Low")
- Pivot Lookback Right: How many candle to compare on the right side of a candle when deciding whether it is a pivot. The lower the number is, the earlier pivots (and therefore divergences) will be signaled, but the quality of those detections could be lower.
- Pivot Lookback Left: How many candle to compare on the left side of a candle when deciding whether it is a pivot. The lower the number is, the earlier pivots (and therefore divergences) will be signaled, but the quality of those detections could be lower.
- Divergence Max Length (Bars): The maximum length of a divergence (number of bars). If a detected divergence is longer than this, it will be discarded
- Divergence Min Length (Bars): The minimum length of a divergence (number of bars). If a detected divergence is shorter than this, it will be discarded
- Show Divergence as:
- Line Thickness: User input divergence line thickness value
- Label Transparency: it could reduce labels mess on oscillator line, input "100" for label text only without label background
- Labels Text Color: User label text color selection
Auto Text Color > Auto color change of label text according to Dark/Light chart theme
- Bull Divergences: Enable/Disable of Bull divergences
> Color: User selection of Bull divergence color
> Oversold only: It will show Regular Bullish RSI divergences in oversold zone only, RSI oversold threshold can be configure in "Primary RSI Settings" section.
- Bear Divergences: Enable/Disable of Bear divergences
> Color: User selection of Bear divergence color
> Overbought only: It will show Regular Bearish RSI divergences in overbought zone only, RSI overbought threshold can be configure in "Primary RSI Settings" section.
- Hidden Bull Div: Enable/Disable of Hidden Bull divergences
> Color: User selection of Hidden Bull divergence color
- Hidden Bear Div: Enable/Disable of Hidden Bear divergences
> Color: User selection of Hidden Bear divergence color
+ Oscillator 2nd Divergence Settings ▾
- Same as Oscillator 1st Divergence Settings
+ Oscillator 3rd Divergence Settings ▾
- Divergence source: User selection of divergence source . "oscillator" (divergence detection with high/low or close of selected oscillator), "price" (divergence detection with high/low or close of price)
- Bull price source: User selection of Bull price source. Bull price source: "Low" (low of price divergence detection), "Close" (close of price divergence detection) (linked to "price" in "Divergence source")
- Bear price source: User selection of Bear price source. Bear price source: "High" (high of price divergence detection), "Close" (close of price divergence detection) (linked to "price" in "Divergence source")
- Low/High left bars: How many candle to compare on the left side of a candle when deciding whether it is a pivot. The lower the number is, the earlier pivots (and therefore divergences) will be signaled, but the quality of those detections could be lower.
- Low/High right bars: How many candle to compare on the right side of a candle when deciding whether it is a pivot. The lower the number is, the earlier pivots (and therefore divergences) will be signaled, but the quality of those detections could be lower.
- Maximum lookback bars: The maximum length of a divergence (number of bars). If a detected divergence is longer than this, it will be discarded.
- Price threshold: User selection of Price threshold, higher values more lines
- RSI threshold: User selection of RSI threshold, higher values more lines
- Show Lows: Displays lows of RSI
- Show Highs: Displays highs of RSI
- Show Divergence as:
- Line Style:
- Line thickness: User input divergence line thickness value
- Label Transparency: it could reduce labels mess on oscillator line, input "100" for label text only without label background
- Labels Text Color: User label text color selection
Auto Text Color > Auto color change of label text according to Dark/Light chart theme
- Bull Divergences: Enable/Disable of Bull divergences
> Color: User selection of Bull divergence color
> Potential Bull: It will plot potential regular bull divergence with dotted line.
- Bear Divergences: Enable/Disable of Bear divergences
> Color: User selection of Bear divergence color
> Potential Bear: It will plot potential regular bear divergence with dotted line.
- Hidden Bull Div: Enable/Disable of Hidden Bull divergences
> Color: User selection of Hidden Bull divergence color
> Potential H.Bull: It will plot potential hidden bull divergence with dotted line.
- Hidden Bear Div: Enable/Disable of Hidden Bear divergences
> Color: User selection of Hidden Bear divergence color
> Hidden Bear divergence: It will plot potential hidden bear divergence with dotted line.
> Regular Bull oversold only: It will show Regular Bullish RSI divergences in oversold zone only, RSI oversold threshold can be configure in "Primary RSI Settings" section.
> Regular Bear overbought only: It will show Regular Bearish RSI divergences in overbought zone only, RSI overbought threshold can be configure in "Primary RSI Settings" section.
+ Oscillator 4th Divergences Settings ▾
- Upper Length: User pivot input value of draw upper divergence line From
- To Pivot:
- Lower Length: User pivot input value of draw lower divergence line From
- To Pivot:
- Show Divergence as:
- Line Style:
- Line thickness: User input divergence line thickness value
- Label Transparency: it could reduce labels mess on oscillator line, input "100" for label text only without label background
- Labels Text Color: User label text color selection
Auto Text Color > Auto color change of label text according to Dark/Light chart theme
- Bull Divergences: Enable/Disable of Bull divergences
> Color: User selection of Bull divergence color
- Bear Divergences: Enable/Disable of Bear divergences
> Color: User selection of Bear divergence color
- Regular Bull oversold only: It will show Regular Bullish RSI divergences in oversold zone only, RSI oversold threshold can be configure in "Primary RSI Settings" section.
- Regular Bear overbought only: It will show Regular Bearish RSI divergences in overbought zone only, RSI overbought threshold can be configure in "Primary RSI Settings" section.
+ Oscillator HHLL Pivots Settings ▾
- Pivot Length: User input value of HH/LL pivot length
> L.Text Color: User label text color selection
- HH color: User HH Label color selection
- HL color: User HL Label color selection
- LH color: User LH Label color selection
- LL color: User LL Label color selection
+ Oscillator OB/OS Colored Bars Settings▾
- Overbought/Oversold Bars Oscillator: Plots Overbought/Oversold color bars based on RSI, MFI, Stoch, Stoch RSI overbought/oversold threshold conditions separately or combined(when every oscillator reach its OB or OS threshold condition at same time).
- Overbought Bar Color: User RSI OB Bars color selection
- Oversold Bar Color: User RSI OS Bars color selection
+ Primary RSI Range Color ▾
- OB: Overbought Color
- OS: Oversold Color
- Bullish: Bullish Color
- Bearish: Bearish Color
+ Primary RSI Color interpolation ▾
- RSI Color: RSI Color
- OB: Overbought Color
- OS: Oversold Color
+ Primary RSI Center Line Color ▾
- OB: Overbought Color
- Bullish: Bullish Color
- Bearish: Bearish Color
- OS: Oversold Color
+ Primary RSI Traditional Color ▾
- RSI Color: RSI Color
- OB: Overbought Color
- OS: Oversold Color
Osc Overbought/Oversold Zones Settings ▾
- OB/OS Zone Band Lines: Enable/Disable OB/OS Zone Band Lines
- OB/OS Zones only: Only shows OB/OS Zones and disable all RSI band lines except Middle Band. Background will not be effected by this setting.
- Overbought Zone: User input value of Overbought Zone from
> To:
- Oversold Zone: User input value of Oversold Zone from
> To:
Osc Overbought/Oversold Highlights ▾
- Overbought Highlights : Enable/Disable Overbought Highlights
- Oversold Highlights : Enable/Disable Oversold Highlights
- Transparency: Gradient transparency of highlighted area
+ 'Oscillators Color Settings ▾
- Show Osc Symbol label : Enable/Disable of oscillator symbol label. Displays current oscillator symbol, but with "Override Oscillator Symbol" enabled from "Black RSI Dashboard" it will Auto/forcefully displays Override Oscillator Symbol on Oscillator
- Fade out Oscillator line: Fade out the oscillator line color, focusing only the most recent periods prominent for a clearer chart
- Fill Stoch/StochRSI lines: Fills Stoch/Stoch RSI lines
- Oscillator line thickness: user input value of oscillator line thickness
- Oscillator line offset: Shifts the oscillator to the left or to the right on the given number of bars, Default is 0
- OBV Color
- MFI Color
- ATR Color
- UO Color
- MOM Color
- CVD Bullish Color
- CVD Bearish Color
+ Background Setting ▾
- Custom Background Color: User selection of Background color
Authors & Credits: I'd like to THANK to Nabeel Black(myself), LonesomeTheBlue, iFuSiiOnzZ, jmosullivan, zdmre, creengrack, and TradingView for the locally sourced ingredients.
Disclaimer: DYOR. Not financial advice. Not a trading system. I am not affiliated with TradingView or any authors mentioned here; You alone have the sole responsibility of evaluating the script output and risks associated with the use of the script. Trading success is all about following your trading strategy and the indicators should fit within your trading strategy, and not to be traded upon solely. Always trade with confluence and Risk Management.
Feedback & Bug report
if you found any bug in this indicator or any suggestion, please let me know. Please give feedback & appreciate if you like to see more future updates and indicators. Thank you

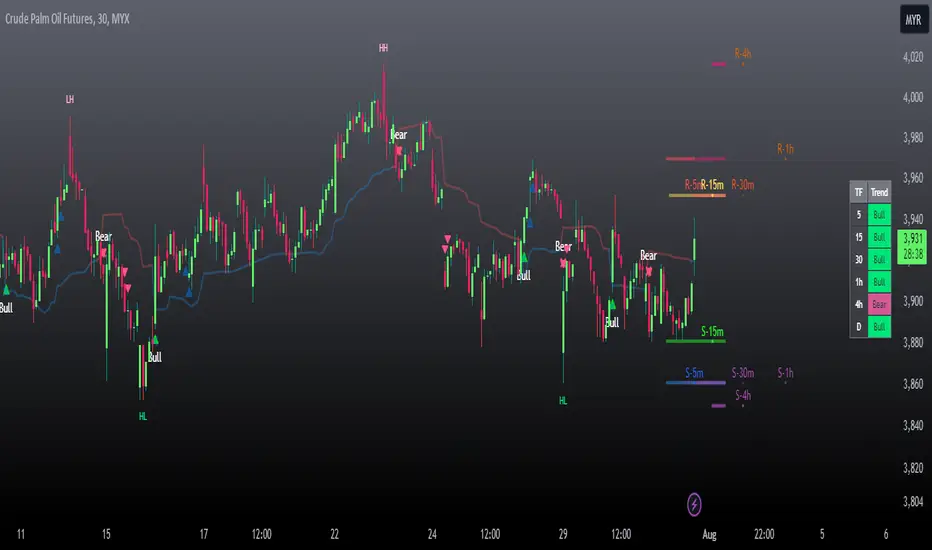
Flying Dragon Trend IndicatorFlying Dragon Trend Indicator can be used to indicate the trend on all timeframes by finetuning the input settings.
The Flying Dragon Trend family includes both the strategy and the indicator, where the strategy supports of selecting the optimal set of inputs for the indicator in each scenario. Highly recommended to get familiar with the strategy first to get the best out of the indicator.
Flying Dragon Trend plots the trend bands into the ribbon, where the colours indicate the trend of each band. The plotting of the bands can be turned off in the input settings. Based on the user selectable Risk Level the trend pivot indicator is shown for the possible trend pivot when the price crosses the certain moving average line, or at the Lowest risk level all the bands have the same colour. The trend pivot indicator is not shown on the Lowest risk level, but the colour of the trend bands is the indicator instead .
The main idea is to combine two different moving averages to cross each other at the possible trend pivot point, but trying to avoid any short term bounces to affect the trend indication. The ingenuity resides in the combination of selected moving average types, lengths and especially the offsets. The trend bands give visual hint for the user while observing the price interaction with the bands, one could say that when "the Dragon swallows the candles the jaws wide open", then there is high possibility for the pivot. The leading moving average should be fast while the lagging moving average should be, well, lagging behind the leading one. There is Offset selections for each moving average, three for leading one and one for the lagging one, those are where the magic happens. After user has selected preferred moving average types and lengths, by tuning each offset the optimal sweet spot for each timeframe and equity will be found. The default values are good enough starting points for longer (4h and up) timeframes, but shorter timeframes (minutes to hours) require different combination of settings, some hints are provided in tooltips. Basically the slower the "leading" moving average (like HMA75 or HMA115) and quicker the "lagging" moving average (like SMA12 or SMA5) become, the better performance at the Lowest risk level on minute scales. This "reversed" approach at the minute scales is shown also as reversed colour for the "lagging" moving average trend band, which seems to make it work surprisingly well.
The Flying Dragon Trend does not necessarily work well on zig zag and range bounce scenarios without additional finetuning of the input settings to fit the current condition.

Flying Dragon Trend StrategyFlying Dragon Trend Strategy can be used to indicate the trend on all timeframes by finetuning the input settings.
The Flying Dragon Trend family includes both the strategy and the indicator, where the strategy supports of selecting the optimal set of inputs for the indicator in each scenario. Highly recommended to get familiar with the strategy first to get the best out of the indicator.
Flying Dragon Trend plots the trend bands into the ribbon, where the colours indicate the trend of each band. The plotting of the bands can be turned off in the input settings. Based on the user selectable Risk Level the strategy is executed when the price crosses the certain moving average line, or at the Lowest risk level all the bands have the same colour.
The main idea is to combine two different moving averages to cross each other at the possible trend pivot point, but trying to avoid any short term bounces to affect the trend indication. The ingenuity resides in the combination of selected moving average types, lengths and especially the offsets. The trend bands give visual hint for the user while observing the price interaction with the bands, one could say that when "the Dragon swallows the candles the jaws wide open", then there is high possibility for the pivot. The leading moving average should be fast while the lagging moving average should be, well, lagging behind the leading one. There is Offset selections for each moving average, three for leading one and one for the lagging one, those are where the magic happens. After user has selected preferred moving average types and lengths, by tuning each offset the optimal sweet spot for each timeframe and equity will be found. The default values are good enough starting points for longer (4h and up) timeframes, but shorter timeframes (minutes to hours) require different combination of settings, some hints are provided in tooltips. Basically the slower the "leading" moving average (like HMA75 or HMA115) and quicker the "lagging" moving average (like SMA12 or SMA5) become, the better performance at the Lowest risk level on minute scales. This "reversed" approach at the minute scales is shown also as reversed colour for the "lagging" moving average trend band, which seems to make it work surprisingly well.
The Flying Dragon Trend does not necessarily work well on zig zag and range bounce scenarios without additional finetuning of the input settings to fit the current condition.
Strategy direction selector by DashTrader.

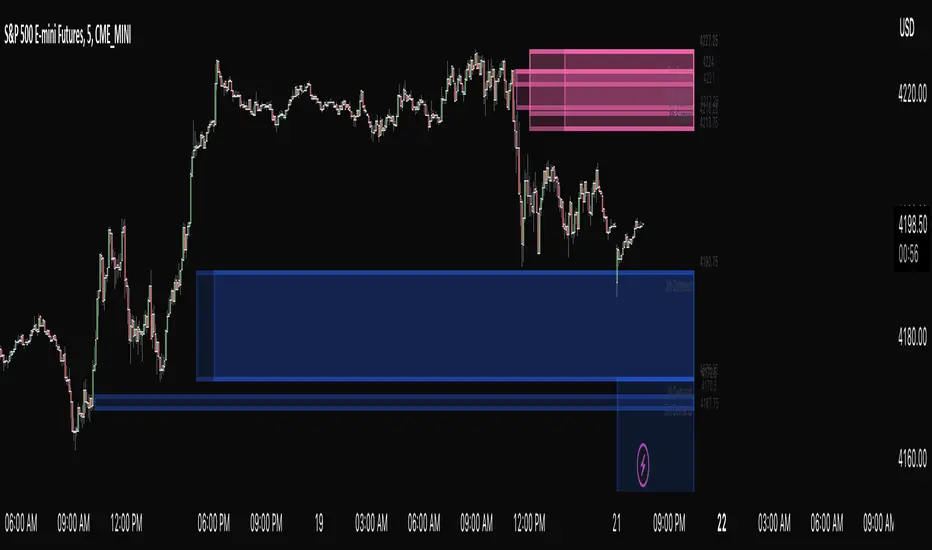
ASE Supply & Demand█ Introduction
ASE Supply & Demand is a multi-timeframe Supply and Demand zone indicator based on the Order Block concept. Order Blocks are a price action concept defined as a basing candle followed by a breakout candle (as seen in the chart below). A basing candle typically shows a slowing down in price action, foreshadowing a reversal and initial institutional activity. The breakout candle then confirms institutional activity with a displacement candle in the opposite direction of the basing candle. Additionally, there is an advanced feature called “Potentials,” which allows us to see price action forming S&D zones beforehand & trapped positions live through the same Order Block concept.
█ Supply and Demand Zones
The Supply & Demand zones are plotted on 8 timeframes (5m, 15m, 30m, 1hr, 2hr, 3hr, 4hr, D). In addition, there are custom settings that allow the trader to filter for the most significant zones and to cohere to their trading style:
Range Multiplier
Filters the creation of a zone based on the basing candle of Supply/Demand(0-5)
The size of the basing candle must be smaller than 0-5 times the True Range Index to create Supply/Demand.
If the basing candle range is smaller than the True Range Index, this can foreshadow the potential of institutional activity as price slows down, and a potential reversal might occur.
True Range Index
The number of bars to calculate the True Range in Range S+D mode.
Displacement Sensitivity
Filters the creation of a zone based on the displacement from the base (0-20)
Calculated by taking the breakout range (as seen in the chart below) divided by the range of the basing candle
0 = less significant, more zones
20 = more significant, fewer zones
Zone Strength Filter %
Filter out current zones based on how strong they are (0-100)
Calculated by the amount of fill within a zone. By changing the Zone Strength Filter, you can display zones that have not breached the filter % you select. For example, if you choose 80% Zone Strength, that means it will only show zones that are 20% filled or less; in other words, zones that have 80% or more yet to be filled.
0 = All Zones
100 = Completely unused zones
With these advanced filters and plotting on multiple timeframes, we have created the best Supply and Demand Indicator . In addition, these filters help to eliminate insignificant zones and noise in the market, leaving us a clean chart.
█ Potentials
Potentials foreshadow the possibility of a Supply or Demand Zone forming, the possibility of a Trapped concept, and it works great as targets or influence in our trades.
Potentials are calculated by the same Order Block concept, which allows us to see Supply & Demand/Order Blocks forming in real-time.
When a potential is triggered and holds, the line turns solid. If it continues to hold, it has the potential of forming a Supply/Demand zone based on the trader's Zone Filters. If the price pulls back and fails to hold, it will go back to dotted. Inferring it used the potential as liquidity and is potentially trapping market participants at that potential.
█ How To Use:
Supply and Demand Zones are the ‘Where’ to our trade but not the ‘Why.’ This means that the zones are our POI (Point of Interest) and ‘Where’ we want to be looking for a trade. It is not our ‘Why’ because we do not enter just because we are in a zone. This is because we expect pivots or reversals inside our Supply & Demand zones, and this rarely happens quickly.
What we want to look for in our zones is a solid base for our reversals. Simply put, we want to see new demand forming at our Demand Zones and new supply forming at our Supply Zones. This can be achieved by observing the ‘Potentials’ feature which allows us to see new Order Blocks or ‘Base Candles’ forming. With a trained eye, the ‘Potentials’ feature is highly effective in addition to its ‘Trapped’ logic which can offer entries on their own. The "Trapped" label on potentials shows potential trapped buyers or sellers after we reach that level. Observing and understanding how price action facilitates, especially around the zones, is crucial to its usability. In addition, other strategies or indicators can be used in confluence to support bounces out of demand and rejections out of supply.
Ultimately once we find a viable entry, we want to see a complete cycle. For example, if we caught a bounce out of demand with new demand forming, we would want to see the cycle complete and us reach the next supply or manufacture new supply. The ‘Potentials’ feature is the easiest way to gather multiple targets and at the same time offers stop loss management.
█ Settings:
Enable Supply/Demand/ Zones and Potential Liquidity
STF S&D Zones - Enables 5 minute and 15 minute timeframe for zones
LTF S&D Zones - Enables 30 minute and 1 hour timeframe for zones
HTF S&D Zones - Enables 2 hour, 3 hour, and 4 hour timeframe for zones
Daily S&D Zones - Enables Daily timeframe for zones
Enable Potentials
Supply Demand Zone Models
Range - Filters zones based on the range of candles before supply/demand
Displacement - Filters zones based on the displacement of the breakout candle
Range + Displacement - Filters zones based on the displacement of breakout candle and range of the candles before supply/demand
Supply Demand Zone Filters (see “Supply and Demand Zones” section for usage)
Range Multiplier
True Range Index
Displacement Sensitivity
Zone Strength Filter %
Deletion Conditions
Confirmed - Deletes zone upon time-frame close above supply or below demand
On Break - Deletes zone upon break above the top of supply or break below bottom of demand
On Tap - Deletes zone upon the touch of supply or demand
Other Settings
Price Labels - Turns on Zone Price Levels
Supply/Demand Color Input - Customize color of zones to your liking
Supply Demand Border Width - Change the border width of zones (0 would be completely borderless zones)
Supply Demand Transparency - Change transparency of zones (0 is completely solid zones, 100 is completely transparent)
Transparency Input - "Normal" Transparency stays at the level that's set; "Decrease with price" as price moves through, the zones become more transparent
Default Color - Changes color of any text/labels (default is gray)
Text size - Change size of text on labels
Channels Strategy [Dimkud]Channels trading Strategy. Based on "Channels Strategy" by JoseMetal.
To the original strategy added additional options and filters : Static SL/TP in percents (%), time delay between orders, ATR Filter, second Keltner Channel (Multi TimeFrame).
Interface translated to English.
Were good backtest results on many crypto tokens on 15m - 45m - 1h periods.
Mostly with configuration: Keltner Channel (optimise parameters for every token) + Static SL/TP (optimise values for every token) + "Enter Condition" = "Wick out of band".
The better is to optimise paramaters separately for Short and Long trading. And run two separate bots (in settings enable only Long or only Short.)
Tested on real automated trading on few online bot platforms. (3comm, revenuebot, veles).
Later I will make tutorial how to connect strategy to these platforms or contact me if you need help.

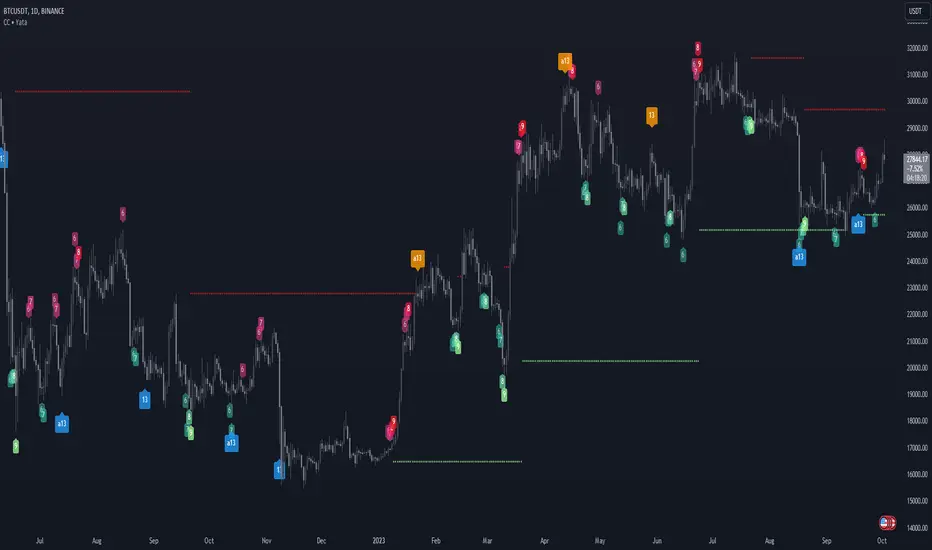
Swing Rapat Jik ( LOW-HIGH ) Smart Money TrendBandSWING RAPAT JIK ( LOW-HIGH ) Smart Money TrendBand
( 2023 updated edition )
The Swing Rapat Jik indicator is a method of knowing whether the current market is either at the highest or the lowest price.
It is also a relatively less risky strategy and suitable for long-term traders such as swing traders.
The analysis tool used is based on the Relative Strength Index ( RSI ) indicator as a parameter to measure the lowest price and the highest price in each cycle. If the price is at the extremely oversold level, then it shows the lowest price signal (LL/HL). Vice versa, if the price is at the extreme overbought level, then the signal will show the highest price signal (HH/LH).
It should be noted that this indicator is a repaint where it will make a re-mark if the price is at the lowest level of the previous signal. So, the solution is that I’ve added the Moving Average parameter as confirmation of the reversal of the LL price to the uptrend. That means the signal to enter the market only occurs when there is an Entry Price (EP) signal after LL/HL signal appears.
Please, do not enter the market when the EP signal is released if the LL/HL signal is not yet released. Make sure these two signals come out consecutively, starting with HL/LL and then the EP signal.
Key Signal;
LL = LOWER LOW
HL = HIGHER LOW
HH = HIGHER HIGH/TAKE PROFIT
LH = LOWER HIGH/TAKE PROFIT
EP = ENTRY PRICE
Hopefully, it can help traders to track the price at the lowest level before making a reversal and the highest price during the market supply situation.
*So far, the invention of the entry market is for the stock market only, which is to use buy signals only. Any updates for other markets will be notified from time to time.
Major updates;
1. Update version to Version 5 pine script
2. variable value used for the EP signal, to obtain a more significant weighted value.
3. Change of label color
4. Colored bars- bullish and bearish trends detected
SOPs and strategies
colored bars are pointers of the current trend and the period in which it occurred.
Use this combination as a strong confirmation
Consecutive Candles lite | Multi Timeframe
Choose to display numbers from 6, 7, 8 or only 9, showing a colored dot until the last number is reached to reduce the clutter
Support and resistance
Customizable labels, several styles are available
Identifies turning point in the trending price of an asset or an index.

Consecutive Candles | Multi Timeframe
Display all numbers or choose from 6, 7, 8 and 9 to reduce the clutter
Support and resistance
Customizable labels, several styles are available
Identifies turning point in the trending price of an asset or an index.
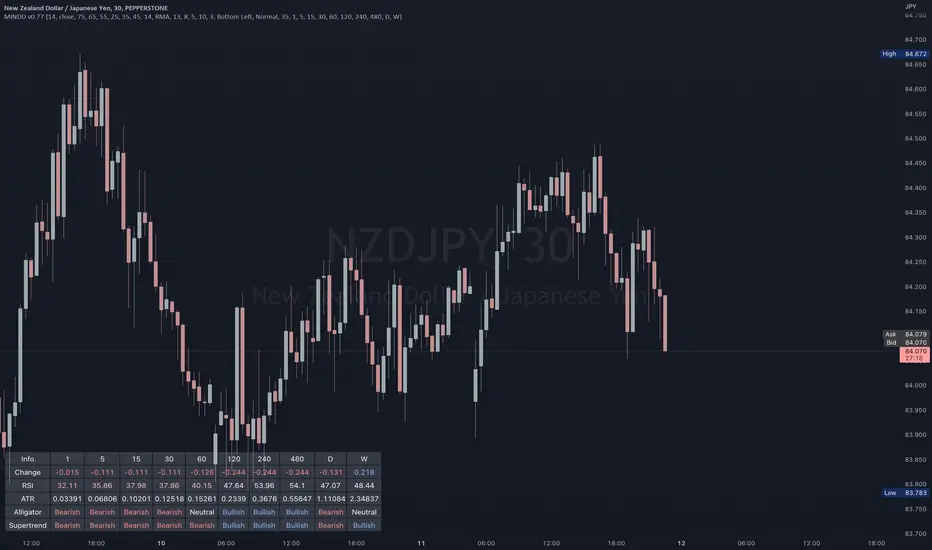
Multi IND Dashboard [Skiploss]Multi IND Dashboard is dashboard combine with price change, RSI, ATR, Alligator and Supertrend. With a maximum of 10 timeframes, I think it's going to make your life easier. In looking at the momentum of each chart.
How it work??
Change :
It is the distance from the close price of previous candlestick and shows the movement value of the candlestick in that timeframe.
RSI :
Default setting are 14 and source close
Value >= 75 : Fill text color maximum overbought
Value >= 65 : Fill text color medium overbought
Value >= 55 : Fill text color minimum overbought
Value >= 45 : Fill text color minimum overbought
Value >= 35 : Fill text color medium overbought
Value >= 25 : Fill text color maximum overbought
ATR :
Default setting are 14 length and RMA smoothing, It like the average swing of the candlesticks.
Alligator :
Default setting are 13, 8 and 5
Bullish status is value lips > teeth and teeth > jaw
Bearish status is value lips < teeth and teeth < jaw
Neutral status status is value lips > teeth and teeth < jaw or lips < teeth and teeth > jaw
Supertrend :
Default setting are 8 and 3.0
Bullish status is uptrend
Bearish status is downtrend
Multi-Timeframe MA Based Zigzag[liwei666]🎲 Overview
🎯 This Zigzag indicator build based on different MA such as EMA/HMA/RMA/SMA, support multi-timeframe setting .
you can get customer zigzag indicator by change short/long ma length and high-timeframe config(5m/15m/30m/1h/2h) in any symbol.
🎲 Indicator design logic
🎯 entired logic is simple and code looks complex, I‘ll explain core logic here, code already equipped with detailed comments.
1. use close-in EMA's highest/lowest value mark as SWING High/Low when EMA crossover/under, not use func ta.pivothigh()/ta.pivotlow()
2. when EMA crossover/under plot a char as signal like ●/❄/▲, crossover get blue char crossunder get red char
3. latest zigzag line is not drawn until EMA is turned (crossover/under), but signal is realtime
4. you can see diff zigzag structure when you open high-timeframe config, then find regular pattern benefit your trading.
🎲 Settings
🎯 there are 3 group properties in script, just focus on 5 properties in 'GRP1' ,
'GRP2' and 'GRP3' are display config.
'GRP1':
MA_Type: MA type you can choose(EMA/RMA/SMA/HMA/WMA), default is EMA
short_ma_len: short MA length of your current timeframe on chart
long_ma_len: long MA length of your current timeframe on chart
htf_ma_len: MA length of high timeframe, MA type same as 'MA_Type' config
htf_ma_tf: high timeframe ma length, 15/30/60/120 minute
'GRP2':
• show_short_zz • show_long_zz • show_htf_zz:
'GRP3':
• show_short_ma_line • show_short_ma_signal
• show_long_ma_line • show_long_ma_signal
• show_htf_ma_line • show_htf_ma_signal
🎲 Usage
🎯 As we know, MA based signal usually worked fine in trend market , low volatility is unprofitable.
🎯 One of pattern as the chart show below.
1. success example : after a blue ▲ signal, entry long when blue ● signal appear, marked with green box.
2. failed example: after a blue ▲ signal, a red ▼ signal appear, marked with white box.
🎯 BoS(Break of Structure) based on ma zigzag is a good idea I'm implementing, it will be published in next script.
Additionally, I plan to publish 20 profitable strategies in 2023; this indicatior not one of them,
let‘s witness it together!
Hope this indicator will be useful for you :)
enjoy! 🚀🚀🚀

Stoch RSI 15 min - multi time frame tableABOUT THIS INDICATOR
This indicator calculates the Stochastic RSI for the time frames 15 min, 30 min, 1h, 4h, and 12h. However, the 15 min time frame should always be the default time frame for your chart.
IMPORTANT
* NOTE! It's extremely important that the chosen time frame for your chart is 15 min. Otherwise the Stochastic RSI for the longer time frames won’t be correctly calculated.
* Stochastic RSI will be calculated and displayed in a table for the time frames: 15 min, 30 min, 1h, 4h, 12h.
* All time frames are based on closed bars except the "15minR" that are realtime updated values calculated on a 15 min time frame.
ABOUT STOCHASTIC RSI
The Stochastic RSI (StochRSI) is a momentum indicator that ranges between 0 and 100. A Stochastic RSI value above 80 is considered overbought and below 20 is considered oversold.
By using different time frames you can get a better idea of what direction the trade could take in a "longer" perspective.
SETTINGS
1.) Length RSI = 14 (default period)
2.) Smoothing parameter of Stochastic RSI (Length Moving Average = 3) . Moving average of stochastic RSI
* By default the displayed Stochastic RSI values are smoothed values of the actual Stochastic RSI. The smoothnes is formed by a calculated moving average of with the length of 3 by default.
If you want Stochastic RSI with a sharper signal (higher risk for "false alarms" being more sensitive) change the Length Moving Average to = 1 (no smoothness at all)
You can see the selected "Length RSI" and "Length Moving Average" on top of the Stochastic RSI table.
Next version of this script will be updated with more a more flexible solution for different time frames.
* NOTE, Tradingview comes with a inbuilt Stochastic RSI. See the the chart below. The blue line in the Stochastic-RSI chart represents (K value = 3) the same value as the script calculate/display in the table.

Odd_Moving AveragesMulti Moving Average Analysis
A highly customizable indicator to help discover moving averages being used in the market.
📈 Chart up to 15 Moving Averages in the same indicator
⏳ Changeable time frame resolution
Ⅲ Available types - Simple, Weighted, Volume-weighted
≡ Custom and pre configured length sets
🪄 Automatic hiding of moving averages a set % away from last price
🌈 14 selectable color sets for plot lines
🗻 Selectable themed legend of values
-Removes hidden values
-Selectable density of data
⇄ Selectable chart data locations

TwV Multi-timeframe Dynamic VRVPMulti-timeframe Dynamic Visible Range Volume Profile
The volume profile is an indicator that displays trading activity over a specified period and plots a histogram on the chart which reveals dominant and significant price levels based on volume and in essence gives a clear indication of Supply or demand at a certain price rather than volume in a certain period.
What makes this VRVP indicator different from other is that it is multi-timeframe and dynamic, meaning that it has the ability to show the POC for a higher timeframe and that it also recalculates the main POC every single time traders adjust the chart.
Most VRVP need to be adjusted to a fixed position for the Main POC, I made an improvement by giving the indicator the ability to identify the bars that are being look at in the screen, this really gives traders the possibility and agility to identify potential support and resistance areas without the need to be changing any settings on the indicator.
Furthermore, giving the ability to the indicator to be multi-timeframe allows traders not only to work with a point of control in one timeframe, but also have a dashed line plotting the Point of Control of a HIGHER timeframe, which could potentially be a strongest support or resistance. The multi-timeframe point of control is fixed only.
This VRVP is completely similar to the official Trading View paid subscription one.
Fundamentals
Point of Control (POC): The price level for the time period with the highest traded volume. The POC is represented by an amber line within the indicator.
Profile High: The highest reached price level during the specified time period
Profile Low: The lowest reached price level during the specified time period.
Value Area (VA): The range of price levels in which a specified percentage of all volume was traded during the time period. Typically, this percentage is set to 70% however it is up to the trader’s discretion.
Value Area High (VAH): The highest price level within the value area.
Value Area Low (VAL): The lowest price level within the value area.
Usage
The Resistance and Support levels can be provided by the Volume profile using a reactive method so they constantly change with price action and give a clearer picture to predict future price movements. The Reactive method relies on past price movements at certain price levels and applies a more significant understanding of price reaction at certain meaningful levels
Support levels will be areas where price will be supported on the way down.
Resistance levels will be areas that resist price on the way up.
A basic understanding of this is that Buyers will enter the market at the bottom of a profile and sellers will enter the market at the top of the profile.
Configuration
By the default the indicator has enabled plotting the charts timeframe Volume Profile.
Multi-timeframe option needs to be enabled and desired timeframe chosen from selector menu.
Bars back value for fixed calculation of the multi-timeframe point of control.
Traders can adjust default settings as follows:
Charts timeframe VRVP
Main POC color – Yellow
Positive Volume – Green
Negative Volume – Red
VRVP Width – 100 (Refers to the plotting width for better suiting on small screens)
Multi timeframe VRVP
Enable or disable calculations
Bars back - Fixed numbers of bars for calculation (Consider that max bars back limit is 5000, but it considers 5000 bars on the current charts timeframe, therefore traders need to take into consideration converting number of bars in higher timeframe to charts timeframe)
e.g.
Charts timeframe 15m – MTF desired 1H
1H = 60 min 15m = 15 min – 100 bars back equivalent to (60 min * 100) / 15 = 400
Lower than 5000 then calculations takes place, otherwise calculations will be disabled.
Multi-timeframe POC color = Light blue DASHED
Timeframe desired – 1H by default
Summary box
Enable or disable box
Box shows information regarding the exact price where Main POC and MTF POC reside
Table Size for better fitting on mobile devices
able Position for adjusting to each trader’s preference or use in combination with other indicators

Super Synchronicity x Musa MoneyThe goal of this indicator is to display a simple and easy method that gives traders a logical strategy that can be applied in many different ways.
This indicator uses fractal support and resistance created by close above or close below candle structures. This indicator displays sell/buy boxes that represents entries and take profit levels. It also shows multi-timeframe breakouts and structure points. In an buy box (green) the bottom of the box symbolizes the stop loss and the top of the box symbolizes the buy entry. In a sell box (red) the bottom of the box symbolizes the entry and the top of the box symbolizes the stop loss. The lines drawn are support and resistance areas on current and higher timeframe showing market structure and trend.
How to use it:
You must choose a higher timeframe and a lower timeframe. The lower timeframe will be in synchronicity with the higher timeframes trend. The boxes that appear will either be green or red depending on the higher timeframes trend. These boxes will represent your entries. The lavender boxes represents your exit. The dark colored boxes represents a higher probability trade than the light colored boxes bases on market structure (higher highs and higher lows or lower higher and lower lows).

Relative Strength Index (RSI) + Realtime DivergencesRelative Strength Index (RSI) + Realtime Divergences
This version of the RSI indicator includes the following features:
- Optional divergence lines drawn directly onto the oscillator in realtime.
- Configurable alerts to notify you when divergences occur.
- Configurable lookback periods to fine tune the divergences drawn in order to suit different trading styles and timeframes.
- Background colouring option to indicate when the RSI oscillator has crossed above or below its centerline.
- Alternate timeframe feature allows you to configure the oscillator to use data from a different timeframe than the chart it is loaded on.
- Fadeout oscillator feature will fade out all but the most recent history, leaving your chart free of visual noise.
- Flip oscillator feature can be used with the Tradingview 'Flip chart' feature (Alt+i) in order to flip both the chart and the oscillator, too. This feature is to help traders manually spot divergences that may have a strong natural bias in one direction.
- Optional centerline and range bands.
- Various optional moving average types, bollinger bands etc.
This indicator adds additional features onto the standard RSI whose core calculations remain unchanged. Namely, the configurable option to automatically, quickly and clearly draw divergence lines onto the oscillator for you as they occur in realtime. It also has the addition of unique alerts, so you can be notified when divergences occur without spending all day watching the charts. Furthermore, this version of the RSI comes with configurable lookback periods, which can be configured in order to adjust the sensitivity of the divergences, in order to suit shorter or higher timeframe trading approaches.
What is the Relative Strength Index ( RSI )?
Investopedia describes the Relative Strength Index as follows:
“The relative strength index (RSI) is a momentum indicator used in technical analysis. RSI measures the speed and magnitude of a security's recent price changes to evaluate overvalued or undervalued conditions in the price of that security. The RSI is displayed as an oscillator (a line graph) on a scale of zero to 100. The indicator was developed by J. Welles Wilder Jr. and introduced in his seminal 1978 book, New Concepts in Technical Trading Systems.
The RSI can do more than point to overbought and oversold securities. It can also indicate securities that may be primed for a trend reversal or corrective pullback in price. It can signal when to buy and sell. Traditionally, an RSI reading of 70 or above indicates an overbought situation. A reading of 30 or below indicates an oversold condition.”
The RSI is also commonly used to spot divergences.
You can read more about the RSI and its calculations here
What are divergences?
Divergence is when the price of an asset is moving in the opposite direction of a technical indicator, such as an oscillator, or is moving contrary to other data. Divergence warns that the current price trend may be weakening, and in some cases may lead to the price changing direction.
There are 4 main types of divergence, which are split into 2 categories;
regular divergences and hidden divergences. Regular divergences indicate possible trend reversals, and hidden divergences indicate possible trend continuation.
Regular bullish divergence: An indication of a potential trend reversal, from the current downtrend, to an uptrend.
Regular bearish divergence: An indication of a potential trend reversal, from the current uptrend, to a downtrend.
Hidden bullish divergence: An indication of a potential uptrend continuation.
Hidden bearish divergence: An indication of a potential downtrend continuation.
How do traders use divergences in their trading?
A divergence is considered a leading indicator in technical analysis , meaning it has the ability to indicate a potential price move in the short term future.
Hidden bullish and hidden bearish divergences, which indicate a potential continuation of the current trend are sometimes considered a good place for traders to begin, since trend continuation occurs more frequently than reversals, or trend changes.
When trading regular bullish divergences and regular bearish divergences, which are indications of a trend reversal, the probability of it doing so may increase when these occur at a strong support or resistance level . A common mistake new traders make is to get into a regular divergence trade too early, assuming it will immediately reverse, but these can continue to form for some time before the trend eventually changes, by using forms of support or resistance as an added confluence, such as when price reaches a moving average, the success rate when trading these patterns may increase.
Typically, traders will manually draw lines across the swing highs and swing lows of both the price chart and the oscillator to see whether they appear to present a divergence, this indicator will draw them for you, quickly and clearly, and can notify you when they occur.
Setting alerts.
With this indicator you can set alerts to notify you when any/all of the above types of divergences occur, on any chart timeframe you choose.
Configurable pivot periods.
You can adjust the default pivot periods to suit your prefered trading style and timeframe. If you like to trade a shorter time frame, lowering the default lookback values will make the divergences drawn more sensitive to short term price action.
Disclaimer: This script includes code from the stock RSI by Tradingview as well as the Divergence for Many Indicators v4 by LonesomeTheBlue.

MACD MTF Strategy [JoseMetal]============
ENGLISH
============
- Description:
This strategy uses my indicator MACD MTF (check my profile) to generate entries, it also has ATR to define Stop Loss and Take Profit if needed.
The strategy has several customizable options, which allows you to refine the strategy for your asset and timeframe.
You can customize settings for ALL indicator settings (MACD MTF and ATR).
- CUSTOM CONDITIONS TO ENTER A POSITION:
1. Both MACDs agree (current timeframe and higher timeframe).
2. Current timeframe MACD crossover.
3. Higher timeframe MACD crossover.
4. MACDs no longer agree with each other.
- EXIT CONDITION:
1. Predefined Stop Loss and Take Profit based on ATR (stop can be previous wick).
2. MACDs no longer agree with each other.
3. Opposite position entry.
- STOP LOSS TYPE:
1. ATR.
2. Previous wick.
- OTHER OPTIONS:
You can customize any setting for my MACD MTF and ATR.
- Visual:
ATR is shown for the Stop Loss / Take Profit.
The script prints the Take Profit as a green line, Stop Loss as a red line and entry price with a white line.
- Recommendations:
Recommended on 8H or 12H timeframe for the CURRENT timeframe, while using DAILY for the higher timeframe on the MACD MFT (by default).
Entry when BOTH MACDs agree and exit on opposite entry, this has NO TAKE PROFIT or STOP LOSS, so be careful, but gives the BEST profit overall, and being on 8H/12H + Daily lets you relax.
- Customization:
As you can see, almost everything is customizable, for colors and plotting styles check the "Style" tab.
Enjoy!
============
ESPAÑOL
============
- Descripción:
Esta estrategia utiliza mi indicador MACD MTF (revisa mi perfil) para generar entradas, también cuenta con ATR para definir Stop Loss y Take Profit si es necesario.
La estrategia tiene varias opciones personalizables, lo te le permiten refinar la estrategia para te activo y temporalidad.
Puedes personalizar la configuración de TODOS los indicadores (MACD MTF y ATR).
- CONDICIONES PERSONALIZADAS PARA ENTRAR EN UNA POSICIÓN:
1. Ambos MACDs coinciden (temporalidad actual y temporalidad superior).
2. Cruce del MACD en el marco de tiempo actual.
3. Cruce del MACD en el marco temporal superior.
4. Los MACD ya no coinciden entre sí (están en desacuerdo).
- CONDICIÓN DE SALIDA:
1. Stop Loss y Take Profit predefinidos basados en el ATR (el stop puede ser la mecha anterior).
2. Los MACDs ya no coinciden entre sí (están en desacuerdo).
3. Entrada en posición contraria.
- TIPO DE STOP LOSS:
1. ATR.
2. Mecha anterior.
- OTRAS OPCIONES:
Puede personalizar cualquier ajuste para mi MACD MTF y ATR.
- Visual:
El ATR se muestra para el Stop Loss / Take Profit.
El script imprime el Take Profit como una línea verde, el Stop Loss como una línea roja y el precio de entrada con una línea blanca.
- Recomendaciones:
Se recomienda en el marco de tiempo 8H o 12H para el marco de tiempo ACTUAL, mientras que se utiliza DIARIO para el marco de tiempo superior en el MACD MFT (por defecto).
Entrar cuando AMBOS MACDs están de acuerdo y salir en la entrada opuesta, esto no tiene TAKE PROFIT o STOP LOSS, así que tenga cuidado, pero da el MEJOR beneficio en general, y estar en 8H/12H + Diario le permite relajarse.
- Personalización:
Como puedes ver, casi todo es personalizable, para colores y estilos de trazado revisa la pestaña "Estilo".
¡Que lo disfrutes!

MTF Fantastic Stochastic (FS+)MTF Fantastic Stochastic (FS+) + Alerts
This chart overlay indicator can signal multiple triple-timeframe Stochastic RSI overbought and oversold confluences directly onto your chart, intended for use as a confluence either for reversal trade entries, or potential trade exits, indicating where price may be probable to reverse.
Features include:
- Primary set of fully configurable triple-timeframe overbought and oversold signals, indicating where 3 selected timeframes are all overbought or all oversold at the same time. Enabled by default.
- Secondary set of fully configurable triple-timeframe overbought and oversold signals, indicating where 3 selected timeframes are all overbought or all oversold at the same time, with alert option. Enabled by default.
- Also includes standard configurable Stoch RSI options, including k length, d length, RSI length, Stochastic length, etc.
- The default primary MTF #1 timeframes are set to 1minute, 5minute and 15minute. These are highly suitable for low timeframe scalpers trading on charts less than 5 minutes, and can often pin point price reversals.
- The default Secondary MTF #2 timeframes are set to 15minute, 30minute and 60minute. These are suitable for both low timeframe scalpers and considerably higher timeframe traders.
- Optional drawing of background colours and/or ribbon seen at bottom of the chart.
- Fully configurable timeframes, as well as overbought and oversold threshold levels for each individual timeframe. Overbought and oversold thresholds are set to the factory 80 and 20 levels respectively for all timeframes by default.
- Alert features for both MTF #1 and MTF #2 triple-timeframe confluences, including options for alerting overbought and oversold individually, as well as an option for alerting either overbought or oversold in a single alert.
Note: THe features listed above are accurate at the time of publishing but maybe updated or added to in future.
The Stochastic RSI
The popular oscillator has been described as follows:
“The Stochastic RSI is an indicator used in technical analysis that ranges between zero and one (or zero and 100 on some charting platforms) and is created by applying the Stochastic oscillator formula to a set of relative strength index ( RSI ) values rather than to standard price data. Using RSI values within the Stochastic formula gives traders an idea of whether the current RSI value is overbought or oversold. The Stochastic RSI oscillator was developed to take advantage of both momentum indicators in order to create a more sensitive indicator that is attuned to a specific security's historical performance rather than a generalized analysis of price change.”
How do traders use overbought and oversold levels in their trading?
The oversold level, that is when the Stochastic RSI is above the 80 level is typically interpreted as being 'overbought', and below the 20 level is typically considered 'oversold'. Traders will often use the Stochastic RSI at an overbought level as a confluence for entry into a short position, and the Stochastic RSI at an oversold level as a confluence for an entry into a long position. These levels do not mean that price will necessarily reverse at those levels in a reliable way, however. This is why this version of the Stoch RSI employs the triple timeframe overbought and oversold confluence, in an attempt to add a more confluence and reliability to this usage of the Stoch RSI.
This indicator was originally built as one of a many features included in the RF+ Divergence Scalping System and has been separated into it's own standalone indicator here for traders who do not want the many other features bundled into the original indicator. A number of features that exist in the original were intensive, and also quite niche. Therefore this lightweight single purpose chart overlay indicator offers this versatile feature of the ever popular Stochastic RSI to a wider audience of traders who may add it to various strategies.

Auto Fibo Multi Timeframe [Misu]█ This indicator shows a Multi Timeframe automatic Fibonacci retracement levels.
This indicator is built using pivots from a user-selected timeframe to draw and orient the Fibonacci retracement.
Fibonacci analysis uses a logical sequence of numbers to predict trends and price action.
█ Usages:
The Fibonacci retracement is used to identify hidden support and resistance levels that an investor can use for entry, exit, and stop placement.
Depending on your usage, you can track breakouts above and below retracement levels to provide early entry points for major breakouts and breakdowns.
Higher timeframe Fibs allow you to have more relevant and weighted signals.
█ Features:
Choose Timeframe
Choose Fib levels
Color Fib Levels Individually
Color Fib Levels all in one
█ Parameters:
Timeframe: The Timeframe chosen.
Left Bars: A parameter used to calculate pivots.
Right Bars: A parameter used to calculate pivots.
UI Settings: Select Fibs levels and colors.

STP PSAR V5PSAR V5: Automate your trading bots to automate your life!
Welcome to the new revolution in trading bots! PSAR V5 is built to automatically change its indicator settings based on real-time market conditions without any human intervention. Instead of setting up 8-10 alerts for each pair, just setup 1 or 2 alerts.
PSAR is our high-frequency scalper that is designed to take hundreds of trades a day and is the most profitable bot available from Swing Trade Pros. PSAR V5 uses multiple filters (SEE BELOW FOR FILTER DESCRIPTIONS) to reduce the risk of using PSAR by filtering out trades that could become stuck, and changes these filters based on real-time market conditions. Even with multiple filters to reduce risk, it is always important for users to manage their risk and accept the risks of running trading bots and strategies.
PSAR V5 is our first fully automated trading bot, changing its own settings based on real-time market conditions. Ever notice how one setting doesn’t work in all market conditions? PSAR V5 solves this by using 4 different trend indicators to detect the trend of the market, and then uses predefined settings for 8 different trend conditions to automatically adjust as the market changes! This reduces risk and saves the user time.
PSAR V5 isn’t just hands-off, set it and forget it for one market condition, PSAR V5 is set it and forget it for ALL market conditions!!!
PSAR V5 is meant for the beginner user, making it easy to setup and easy to adjust with predefined default risk conditions for each market condition. PSAR V5 ADVANCED allows the user to finely tune each setting for every market condition, and is available for our advanced users in VIP .
DETAILED DESCRIPTION OF FILTERS USED:
PSAR TREND: To detect trend, PSAR V5 uses 4 high time frame PSAR filters to detect overall market conditions. By combining lower time frames such as 5 minute and 15 minute with higher time frame such as 4 hour and daily, PSAR trend detection allows for quick reactions during quick market changes while still adapting and staying on trend with overall market conditions using the higher time frames.
This enables PSAR V5 to combine all 4 PSAR trend filters to determine the strength of the overall market while reacting to quick changes, providing 8 different customizable trend conditions which PSAR uses for settings and to trigger up to 8 different bots, allowing the user to risk on when trend is in their favor, and risk off when trend is not in their favor. PSAR V5 also shows NO TREND when there is indecision in the market when all time frames do not agree.
DIVERGENCES: PSAR V5 uses an enhances version of our previous divergence filter to detect loss of strength in the market by detecting divergences in the Relative Strength Index and filtering out those trades.
ADX: PSAR V5 uses the ADX filter to capture the strongest part of a move in price while avoiding the end of the price movement. This allows us to filter out late longs and shorts.
PSAR DISTANCE: Our PSAR Distance filter will filter out any trades that get beyond a predefined distance from the PSAR indicator dots. This is very useful for avoiding tops and bottoms.
REPAINTING: Significant code has been added to avoid repainting by making each high time frame calculation individually within its own time frame, and then using the bar merge method to eliminate repaints.

TMO ArrowsTMO - (T)rue (M)omentum (O)scillator) MTF Arrows
Do you want to use TMO but you lack space on the chart? This study is just for you. This is the more user-friendly version of the TMO Oscillator. In terms of the indicator there are no changes except the indicator is converted in to the simple arrows.
There are Four Types of Arrows:
1. TMO Arrow Up - Visualizes the TMO bullish crosses.
2. TMO Arrow Down - Visualizes the TMO bearish crosses.
3. TMO Arrow Up (Oversolds Only) - Visualizes only the bullish crosses that are at or below the oversold zone.
4. TMO Arrow Down (Overboughts Only) - Visualizes only the bearish crosses that are at or above the overbought zone.
In case you only want the arrows for extremes, turn off the Arrow Up / Arrow Down first. Arrows for extremes only are turned off by default.
Hope it helps.

RF+ Divergence Scalping SystemRF+ Divergence Scalping System + Custom Signals + Alerts.
This chart overlay indicator has been developed for the low timeframe divergence scalper.
Built upon the realtime divergence drawing code from the Divergence for Many indicator originally authored by Lonsometheblue, this chart overlay indicator bundles several additional unique features and modifications to serve as an all-in-one divergence scalping system. The current key features at the time of publishing are listed below (features are optional and can be enabled or disabled):
- Fully configurable realtime divergence drawing and alerting feature that can draw divergences directly on the chart using data sourced from up to 11 oscillators selected by the user, which have been included specifically for their ability to detect divergences, including oscillators not presently included in the original Divergence for Many indicator, such as the Ultimate Oscillator and TSI.
- Optional on chart table showing a summary of key statuses of various indicators, and nearby divergences.
- 2 x Range Filters with custom settings used for low timeframe trend detection.
- 3 x configurable multi-timeframe Stochastic RSI overbought and oversold signals with presentation options.
- On-chart pivot points drawn automatically.
- Automatically adjusted pivot period for up to 4 configurable time frames to fine tune divergences drawn for optimal divergence detection.
- Real-price line for use with Heikin Ashi candles, with styling options.
- Real-price close dots for use with Heikin Ashi candles, with styling options.
- A selection of custom signals that can be printed on-chart and alerted.
- Sessions indicator for the London, New York, Tokyo and Sydney trading sessions, including daylight savings toggle, and unique ‘invert background color’ option, which colours the entire chart - except the trading session you have selected, leaving your chart clear of distracting background color.
- Up to 4 fully configurable moving averages.
- Additional configurable settings for numerous built in indicators, allowing you to alter the lengths and source types, including the UO, TSI, MFI, TSV, 2 x Range Filters.
- Configurable RSI Trend detection signal filter used in a number of the signals, which filters buy signals where the RSI is over the RSI moving average, and only prints sell signals where RSI is under the moving average.
- Customisable on-chart watermark, with inputs for a custom title, subtitle, and also an optional symbol | timeframe | date feature.
The Oscillators able to be selected for use in drawing divergences at the time of publishing are as follows:
- Ultimate Oscillator (UO)
- True Strength Indicator (TSI)
- Money Flow Index (MFI)
- Cumulative Delta Volume (CDV)
- Time Segmented Volume (TSV)
- Commodity Channel Index (CCI)
- Awesome Oscillator
- Relative Strength Index (RSI)
- Stochastic
- On Balance Volume (OBV)
- MACD Histogram
What are divergences?
Divergence is when the price of an asset is moving in the opposite direction of a technical indicator, such as an oscillator, or is moving contrary to other data. Divergence warns that the current price trend may be weakening, and in some cases may lead to the price changing direction.
There are 4 main types of divergence, which are split into 2 categories;
regular divergences and hidden divergences. Regular divergences indicate possible trend reversals, and hidden divergences indicate possible trend continuation.
Regular bullish divergence: An indication of a potential trend reversal, from the current downtrend, to an uptrend.
Regular bearish divergence: An indication of a potential trend reversal, from the current uptrend, to a downtrend.
Hidden bullish divergence: An indication of a potential uptrend continuation.
Hidden bearish divergence: An indication of a potential downtrend continuation.
Setting alerts.
With this indicator you can set alerts to notify you when any/all of the above types of divergences occur, on any chart timeframe you choose, also when the triple timeframe Stochastic RSI overbought and oversold confluences occur, as well as when custom signals are printed.
Configurable pivot period values.
You can adjust the default pivot period values to suit your prefered trading style and timeframe. If you like to trade a shorter time frame, lowering the default lookback values will make the divergences drawn more sensitive to short term price action. By default, this indicator has enabled the automatic adjustment of the pivot periods for 4 configurable time frames, in a bid to optimize the divergences drawn when the indicator is loaded onto any of the 4 time frames selected. These time frames and their associated pivot periods can be fully reconfigured within the settings menu. By default, these have been further optimized for the low timeframe scalper trading on the 1-15 minute time frames.
How do traders use divergences in their trading?
A divergence is considered a leading indicator in technical analysis , meaning it has the ability to indicate a potential price move in the short term future.
Hidden bullish and hidden bearish divergences, which indicate a potential continuation of the current trend are sometimes considered a good place for traders to begin, since trend continuation occurs more frequently than reversals, or trend changes.
When trading regular bullish divergences and regular bearish divergences, which are indications of a trend reversal, the probability of it doing so may increase when these occur at a strong support or resistance level . A common mistake new traders make is to get into a regular divergence trade too early, assuming it will immediately reverse, but these can continue to form for some time before the trend eventually changes, by using forms of support or resistance as an added confluence, such as when price reaches a moving average, the success rate when trading these patterns may increase.
Typically, traders will manually draw lines across the swing highs and swing lows of both the price chart and the oscillator to see whether they appear to present a divergence, this indicator will draw them for you, quickly and clearly, and can notify you when they occur.
How do traders use overbought and oversold levels in their trading?
The oversold level is when the Stochastic RSI is above the 80 level is typically interpreted as being 'overbought', and below the 20 level is typically considered 'oversold'. Traders will often use the Stochastic RSI at, or crossing down from an overbought level as a confluence for entry into a short position, and the Stochastic RSI at, or crossing up from an oversold level as a confluence for an entry into a long position. These levels do not mean that price will necessarily reverse at those levels in a reliable way, however. This is why this version of the Stoch RSI employs the triple timeframe overbought and oversold confluence, in an attempt to add a more confluence and reliability to this usage of the Stoch RSI.
This indicator is intended for use in conjunction with related panel indicators including the TSI+ (True Strength Indicator + Realtime Divergences), UO+ (Ultimate Oscillator + Realtime Divergences), and optionally the STRSI+ (MTF Stochastic RSI + Realtime Divergences) and MFI+ (Money Flow Index + Realtime Divergences) available via this authors’ Tradingview profile, under the scripts section. The realtime divergence drawing code will not identify all divergences, so it is suggested that you also have panel indicators to observe. Each panel indicator also offers additional means of entry confirmation into divergence trades, for example, the Stochastic can indicate when it is crossing down from overbought or up from oversold, the TSi can indicate when the 2 TSI bands cross over one another upward or downward, and the UO and MFI can indicate an entry confluence when they are nearing, or crossing their centerlines, for more confidence in your divergence trade entries.
Additional information on the settings for this indicator can be found via the tooltips within the settings menu itself. Further information on feature updates, and usage tips & tricks will be added to the comments section below in due course.
Disclaimer: This indicator uses code adapted from the Divergence for Many v4 indicator authored by Lonesometheblue, and several stock indicators authored by Tradingview. With many thanks.
