Relative volume zone + Smart Order Flow Dynamic S/ROverview:
The Relative Volume Zone + Smart Order Flow with Dynamic S/R indicator is designed to help traders identify key trading opportunities by combining multiple technical components. This script integrates relative volume analysis, order flow detection, VWAP, RSI filtering, and dynamic support and resistance levels to offer a comprehensive view of the market conditions. It is particularly effective on shorter timeframes (M5, M15), making it suitable for scalping and day trading strategies.
Key Components:
1. Relative Volume Zones:
• The script calculates the relative volume by comparing the current volume with the average volume over a defined lookback period (volLookback). When the relative volume exceeds a specified multiplier (volMultiplier), it indicates a high volume zone, signaling potential accumulation or distribution areas.
• Purpose: Identifies high-volume trading zones that may act as significant support or resistance, indicating possible entry or exit points.
2. Smart Order Flow Analysis:
• The indicator uses Volume Delta (the difference between buying and selling volume) and a Cumulative Delta to detect order imbalances in the market.
• Order Imbalance is identified using a moving average of the Volume Delta (orderImbalance), which helps highlight hidden buying or selling pressure.
• Purpose: Reveals market sentiment by showing whether buyers or sellers dominate the market, aiding in the identification of trend reversals or continuations.
3. VWAP (Volume Weighted Average Price):
• VWAP is calculated over a default daily length (vwapLength) to show the average price a security has traded at throughout the day, based on both volume and price.
• Purpose: Provides insight into the fair value of the asset, indicating whether the market is in an accumulation or distribution phase.
4. RSI (Relative Strength Index) Filter:
• RSI is used to filter buy and sell signals, preventing trades in overbought or oversold conditions. It is calculated using a specified period (rsiPeriod).
• Purpose: Reduces false signals and improves trade accuracy by only allowing trades when RSI conditions align with volume and order flow signals.
5. Dynamic Support and Resistance Levels:
• The script dynamically plots support and resistance levels based on recent swing highs and lows (swingLookback).
• Purpose: Identifies potential reversal zones where price action may change direction, allowing for more precise entry and exit points.
How It Works:
• Buy Signal:
A buy signal is generated when:
• The price enters a high-volume zone.
• The price crosses above a 5-period moving average.
• The cumulative delta shows more buying pressure (cumulativeDelta > SMA of cumulativeDelta).
• The RSI is below 70 (not in overbought conditions).
• Sell Signal:
A sell signal is generated when:
• The price enters a high-volume zone.
• The price crosses below a 5-period moving average.
• The cumulative delta shows more selling pressure (cumulativeDelta < SMA of cumulativeDelta).
• The RSI is above 30 (not in oversold conditions).
• Dynamic Support and Resistance Lines:
Drawn based on recent swing highs and lows, these lines provide context for potential price reversals or breakouts.
• VWAP and Order Imbalance Lines:
Plotted to show the average traded price and highlight order flow shifts, helping to validate buy/sell signals.
How to Use:
1. Apply the Indicator:
Add the script to your chart and adjust the settings to match your trading style and preferred timeframe (optimized for M5/M15).
2. Interpret the Signals:
Use the buy and sell signals in conjunction with dynamic support/resistance, VWAP, and order imbalance lines to identify high-probability trade setups.
3. Monitor Alerts:
Set alerts for significant order flow events to receive notifications when there is a positive or negative order imbalance, indicating potential market shifts.
What Makes It Unique:
This script is unique because it combines multiple market analysis tools — relative volume zones, smart order flow, VWAP, RSI filtering, and dynamic support/resistance — to provide a well-rounded, multi-dimensional view of the market. This integration allows traders to make more informed decisions by validating signals across various indicators, enhancing overall trading accuracy and effectiveness.
Niftyanalysis

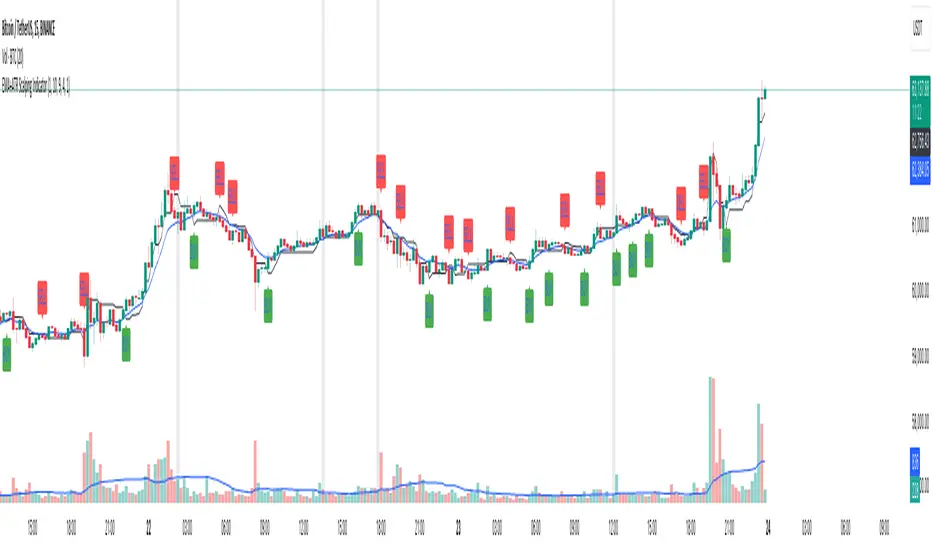
EMA+ATR Scalping Indicator by TradeTechIndicator Description: “EMA+ATR Scalping Indicator by Tradetech”
The “EMA+ATR Scalping Indicator” is a powerful tool designed to help traders identify optimal entry and exit points in the market, focusing on high-probability scalping opportunities. This indicator combines the strength of the Exponential Moving Average (EMA) with the Average True Range (ATR) to generate precise signals, aiming to maximize profits while minimizing risk.
Key Features:
• Sensitivity Key Value: Allows customization of the ATR multiplier, fine-tuning the trailing stop level for different market conditions.
• ATR Calculation: Measures market volatility over a specified period, dynamically adjusting the trailing stop to capture significant price moves while reducing noise.
• EMA for Confirmation: The 20-period EMA is used as a trend filter, ensuring that trades are aligned with the prevailing market direction.
• Trade Cooldown Period: Prevents over-trading by enforcing a minimum number of bars between consecutive trades, reducing the likelihood of whipsaws.
• Flat ATR Threshold: Identifies periods of low volatility (flat ATR), during which trading is avoided to protect against false signals.
Trading Logic:
• Entry Signals: The indicator generates long signals when the price crosses above the ATR trailing stop or breaks out consecutively in an uptrend, with the EMA confirming the bullish trend. Short signals are generated when the price crosses below the ATR trailing stop or consecutively breaks out in a downtrend, with the EMA confirming the bearish trend.
• Exit Signals: The exit points are defined by the ATR trailing stop, which adjusts dynamically with market conditions, ensuring that profits are locked in as the trend evolves.
• No Trading Zone: When the ATR is flat, indicating low volatility, the indicator displays a “No Trading Zone” to prevent taking positions in uncertain market conditions.
Why Combine EMA + ATR?
The combination of EMA and ATR in this indicator is crucial for several reasons:
1. Trend Identification (EMA): The EMA acts as a reliable trend filter, ensuring that trades are taken in the direction of the prevailing trend. By doing so, the indicator avoids taking trades against the momentum, which could result in lower probability setups.
2. Volatility-Based Trailing Stop (ATR): The ATR provides a volatility-adjusted stop-loss level, which is essential in scalping strategies where market conditions can change rapidly. This allows the trailing stop to widen during periods of high volatility and tighten during low volatility, optimizing the trade management process.
3. Enhanced Accuracy: By combining the EMA and ATR, the indicator filters out noise and avoids entering trades during flat market conditions, where the probability of false signals is higher. This synergy between trend and volatility creates a more robust and accurate scalping tool.
4. Dynamic Trade Management: The use of ATR for setting trailing stops ensures that the trade exits are dynamic and adaptable to current market conditions, maximizing the potential for capturing significant moves while minimizing drawdowns.
Overall, the EMA + ATR combination within the “EMA+ATR Scalping Indicator” provides a well-rounded approach to scalping, balancing trend-following with volatility management for more consistent trading results.
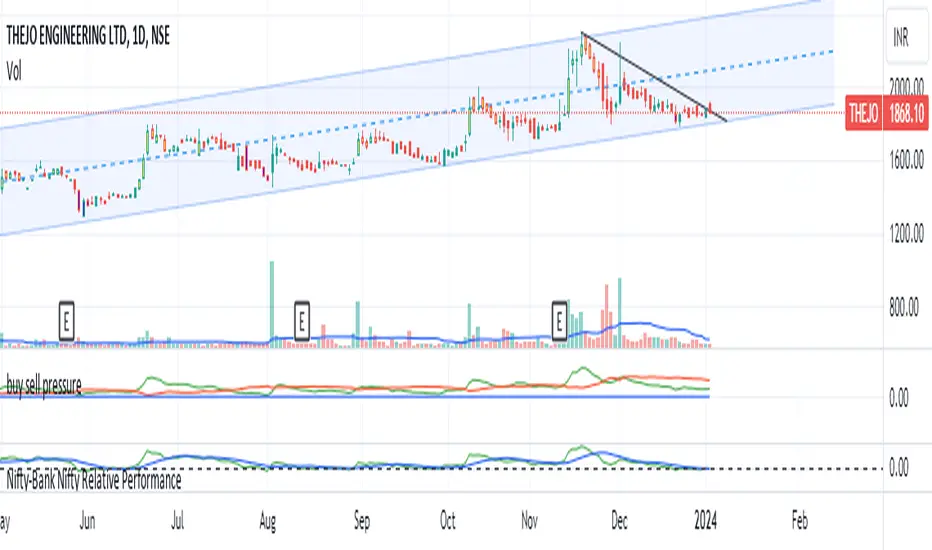
buy sell pressurebuy sell pressure indicator
Every stock /indices /chart is unique in nature. there will always be some kind of buyers and sellers present in these equities/stocks. due to their inherent buying and selling nature, these stocks also develop a pattern. such patterns are not always visible directly on the chart but we can calculate buying and selling pressure for these stocks individually . if we plot a graph on chart , we can easily see when stock is getting and when it is showing strength.
The logic for calculating buying and selling pressure is given below-
buying pressure= 14 days ema of {close- low(1)}
selling pressure= 14 days ema of {high(1)- close}
low (1) indicates 1 day ago candle's low price
high(1) indicates 1 day ago candle's high price
close= recent candle's close price
how to read chart :-
whenever buying pressure line (green color) crosses the selling pressure line (red color)stock will show strength and will go up. if the red line starts to cross the green line then we may see prices go down. so one can book profit here.
there is a unique zero line which is blue in color. it will act as a supreme buy and sell zone. if the green line touches or somehow goes below the zero line(blue line), stock will see strong buying pressure . if the red line (selling pressure line) goes below the zero line, the stock will witness strong selling pressure.
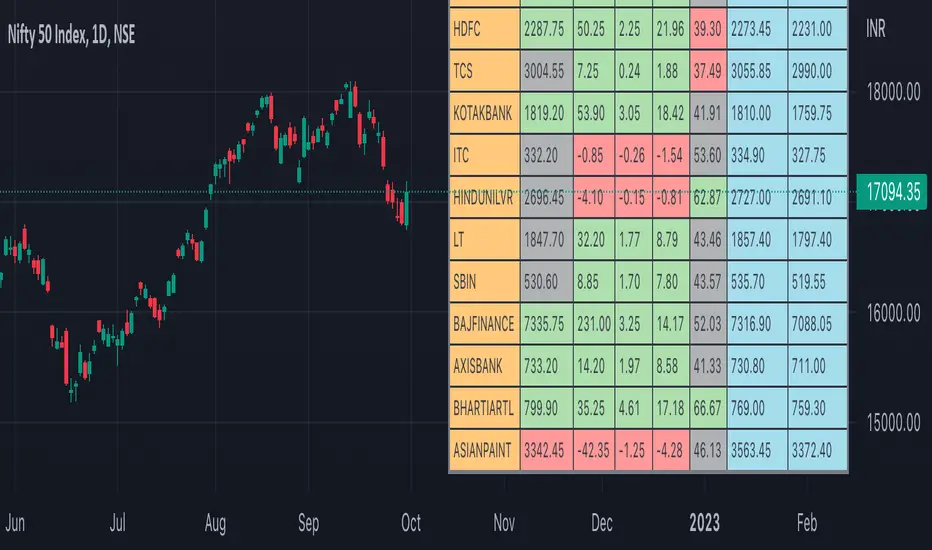
Nifty50 Participants - Top 25Nifty50 Index is calculated based on the movements of its participants. Every time you think of why is Index going up/down, who is actively dragging the index either ways, this Indicator gives you answer for the same in realtime!
This indicator will help you in pre-planning your trades based on the movements shown by different stocks of various sectors in Index calculation.
RSI column is an add-on to the participation table which will help you in getting RSI values of different stocks of Nifty 50 at a glance. You will see values getting updated in realtime in live market.
Checkout for customisations in indicator settings.
Note:
1. Participants present in this indicator and their participation percentage is taken from the official NSE website.
2. Table shows Top 25 participants by default. If you want to see less than 25 rows, you can update the input via indicator settings.
Feel free to contribute/comment changes if any! Comment in case of any suggestions :)
- Published by Soham Dixit
Nifty and Bank Nifty Dashboard V2This shows a performance glance of Dow and major Constituents of NSE:NIFTY or NSE:BANKNIFTY . This is an enhancement to the Bank nifty dashboard published earlier.
Usage
• Customizable Table and Style settings
• Customizable Indicator Settings
• Customizable Time frame of Indicators in Table. Can change to higher or lower TF other than the chart time frame
• Customizable Input symbols. Can modify with the Scripts you want to track.
• The Last row will be the current script viewed in charts.
• Can enable or disable indicators on the chart like ST, SMA, VWAP.
• Strong Volume Indication at bottom based on the average volume inputs for Nifty, Bank Nifty and for other stocks volume > 20 ma(volume)
• Displays bank nifty stocks if Bank nifty is the open chart else it will display top Nifty Stocks.
• This will help to monitor the performance of various scripts.
• Can change the stock list according to usage/Index.
• It will show all the symbols if Additional Symbols is selected.
Buy-Sell Signal
• Volume > Average Volume, it Shows #
• ST – Buy - Price > Super trend (10,2) and vice versa
• SMA – Buy - Price > MA and vice versa
• RSI – Buy – RSI > 50, Sell – RSI < 40
• ADX: Buy - ADX > 25, DMI+ Above DMI - and vice versa
• Previous day High low is not considered for buy or sell score calculation. This is just for additional observation.
• ATR will be highlighted when change > 0.75 of the average true range of daily price.
Strong colours will be shown for respective boxes when some additional conditions satisfy.
Style settings
Dashboard Location: Location of the dashboard on the chart
Dashboard Size: The size of the dashboard on the chart
Text/Frame Color: Determines the colour of the frame grid as well as the text colour
Bullish Cell Color: Determines the colour of cell associated with a rising indicator direction
Bearish Cell Color: Determines the colour of cell associated with a decreasing indicator direction
Cell Transparency: Transparency of each cell

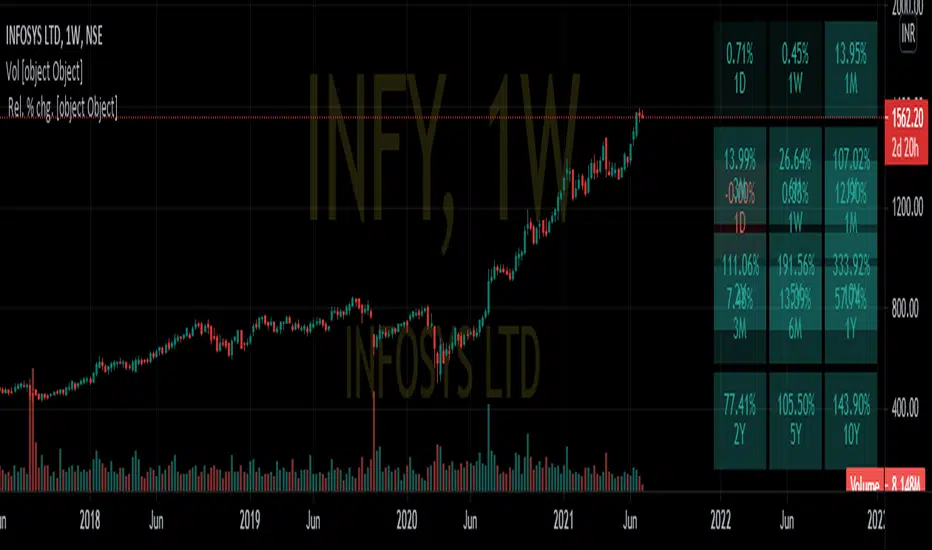
Nifty Relative PerformanceDISCRIPTION:-
This indicator is used to determine relative performance of a stock based on different time intervals as well as compared to benchmark indices as Nifty 50,Nift IT, Nifty auto etc.
USE CASE SCENARIO:-
The top right table provide performance of stock based on different interval
while the bottom table depicts its relative performance compared to an index
eg:-
INFY compared to Nifty 50
&
INFY compared to Nifty IT
DISCLAIMER:-
if using an android device kindly toggle full-screen mode and view it horizontally
In desktop full screen mode may provide better comprehensive view
Intraday Strategy - NIFTY INTRADAY STRATEGY - NIFTY (Index)
INSTRUMENT TO TRADE - Nifty Futures, Nifty Options (Buy) - In The Money Call / Put Options
TIME FRAME - 05 mins
DURATION TYPE - Intraday , every trade must be closed at End Of Trading Day.
STRATEGY TYPE - Trend following, Intraday
The script will indicate when to BUY / SHORT the Index instruments and when to EXIT the trade.
The backtesting is done using 1 qty of NIFTY on intraday trade.
Brokerage and commissions are included in backtest results.
Tradingview doesn't have Nifty futures data hence strategy is build on Nifty spot price.
The purpose of the scipt is for self learning / improvement and analysis.
Trading is a risky business and a trader must take any trade at their own RISK.
The author shall not be held responsible for Losses / Profits

Indian Market OutlookIndian Market Outlook provides an information Panel for Major Nifty Indices, Indicators and the status of your stock time frames 2,5,15,30,60 minutes in one window.
It provides Up/Down Trend of the NIFTY & Other Indices.
