MM Legend V2The MM Legend V2 is a two in one oscillator.
The Rsi BB is the Rsi with BB volatility band with Demarker Ma for strong trend analysis.
up/dn signals tell you the trend direction
oversold/over bought levels
candle mode for the rsi band
blue/red back ground color to help identify the trend
How to Use
when the background is red, you have down signal, Demarker and rsi are at red level of BB band =sell
when the background is blue, you have up signal, Demarker and rsi are at blue level of BB band =buy
The second oscillator built in is the Tilson T3 and Demarker cross
The Denmark technical indicator, also known as DeM, measures the demand for an asset by comparing the most recent high and low prices to the previous high and low prices. This will give the general directional bias of the market.
the preferred Demarker setting is to use a parameter value of 18-24 periods. We also like to tweak the overbought and oversold levels and instead of using the classical 0.7 and respectively 0.3.
The classic De Maker comes with line graphs, to improve the price vision we have made this beautiful indicator in a candle version.
We have added a tilson T3 moving average to better target the inputs.
What is the Tilson T3
The Tillson moving average a.k.a. the Tillson T3 indicator is one of the smoothest moving averages and is both composite and adaptive. The average is built using the EMA however, the formula is decomposed in order to improve smoothing.
The demarker indicator indicates to us overbought and oversold of the asset, you will be able to distinguish these signals when the marker is painted green for overbought, red for oversold, you will also see a background with these colors to better identify these areas.
Demarker by default comes inline format, you just have to press demarker in candle mode idem for the moving average of t3 and you can see it as it is seen on the chart.
Recommendation for a better view in candle mode, once you press that you want to see demarker in candle mode, go to the style window and destilde wick and borders of each demarker and T3.
How to use?
BUY: When demarking an oversold signal, and the oscillator is above the moving average, buy, you will also see the aqua background.
Sell: when the demarker is overbought and the oscillator is placed or below the T3 moving average sell, you will also see the orange background.
Link below or PM us for access you this indicator Happy Trading
Nnfx

MM Ultimate Hull CrossThe MM Ultimate Hull Cross Is based on the nnfx trading strategy
with a combination of a ribbon hull moving average, Vma, and Alma baseline for trend direction
the hull ma with generate buy/sell signals
the vma detects volume and will confirm your buy/sell signal buy turning red or green and grey for "hold"
the Alma acts as your baseline and changes from green to red to show up or downtrend .
has built in generated signals with entry, Atr calculated stop loss, and 3tp levels that can be turned off in the settings. every time a signal is generated.
has purple alerts when tp's are hit
Buy/Sell alerts
alma trend change alerts with background color
link below or PM us for access you this indicator Happy Trading

MM Auto Trend ChannelThe Auto Trend Channel is a simple indicator that automatically plot a trend channel based on the length you set from Up to Downtrend. and changes automatically when the trend is broken.
changes from red"downtrend to green "uptrend" and also has auto fib lines.
I use it set at the 50 period and work from there
works on any time frame
and set alerts for broken channel
Use link below or PM us for access you this indicator Happy Trading

NNFX Mr. Monta FT %Kung hindi nyo ako naiintindihan hindi nyo rin maiintindihan ang indicator na ito kaya good luck
God Bless!
Happy Trading :)

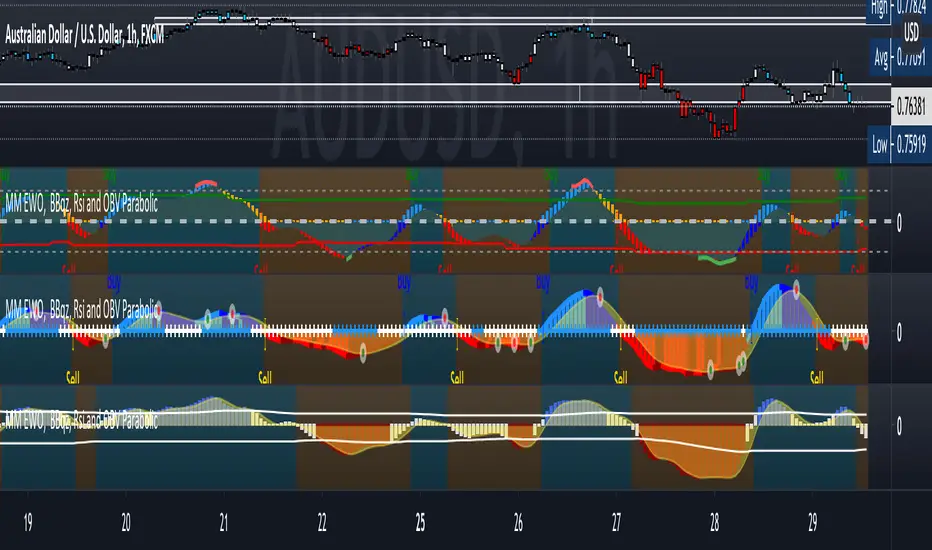
MM Matrix OscillatorHere I present MM Matrix Oscillator
What the oscillator and histogram represent are trend candles, when the histogram is painted lime above 0 line it is buy, you will also see the buy signal below with an arrow, when the oscillator is painted red below the 0 line you will see the signal in red sell.
Dynamic Support and resistance to see possible exit points and extra confirmation on zones
You have an additional, exit buy and exit sell to perform scalping.
It has buy and sell signals alarm and also the painting of candles on the chart to see the trend. green=uptrend/red= downtrend
added "color trend and exit" in settings
red=downtrend
white=ranging
green=buy
Use link below or PM us for access you this indicator Happy Trading
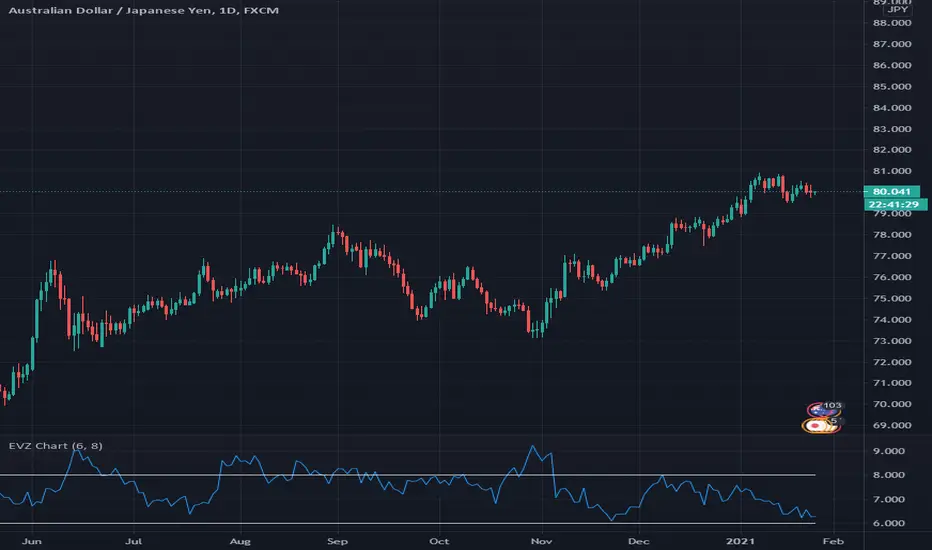
Indicator - EVZ Chart - DGHey Traders, this is the $EVZ chart plotted as an indicator. The $EVZ is the Euro Volatility Index, which can be used to measure volatility in markets.
The use of the $EVZ could be helpful for trend traders of FX. The concept developed by VP of no nonsense forex, we can use the value of the $EVZ to determine when we put on full risk if there is high volatility, half risk when there is medium volatility, or no risk if there is very low volatility.
This indicator has 2 adjustable horizontal lines, so you can put in the conditions or thresholds you need for your trading strategy.
Happy trading,
DG
MoneyMoves Strategy V1 The MoneyMoves Strategy V1 is one piece of the it is Hekin Ashi turned into a smooth Moving average for better visual of price trend.
By taking the average of the open, close, high and low of price this indicator will help with seeing short and long term price trend on any timeframe of your liking.
With added buy and sell alarms you can set so you don't miss a trade, also make for a good exit alarm if already in a trade.
In the settings you can change the type of moving average you want to use between sma, ema, wma, hma, vwma, and rma at different sources for your liking. (open/close/high/low)
You can also change the Length of the MA to better fit your liking both open and close prices to make it more precise
When you get A Buy Signal and the Moving Average IS Green= Buy
When you get A Sell Signal and the Moving Average IS Red =Sell
You can also change the colors of the Moving average in the settings tab
Use link below or PM us for access you this indicator. Happy Trading

My Version of No-Nonsense Forex (NNFX) Strategy - MQAHNAF SignalThis is my version of the No-Nonsense Forex (NNFX) Strategy, namely MQAHNAF Signal.
This strategy shows you only the entry signal with 1.5 x ATR for Stop Loss and 1 x ATR for Taking Profit.
This strategy uses 5 kinds of indicators:
1. Average True Range for SL and TP placement, and also for pullback range;
2. Kijunsen for Baseline;
3. SSL Channel for 1st Confirmation;
4. Absolute Strength Histogram for 2nd Confirmation;
5. Waddah Attar Explosion for Volume/Volatility.
This strategy implements the "Bridge Too Far" strategy.
This strategy also implements the "Pullback" strategy, with some modification: 1.5 x ATR from Kijunsen
This strategy doesn't use the exit indicator because this strategy intended only to shows you the entry signal, but you can use the SSL Channel (the yellow line) for the exit indicator.
This strategy also doesn't use the "Scale-Out" and the "Trailing Stop" strategy because again, this strategy only shows you the entry signal.
On the contrary, this strategy works best on the 4H timeframe, different from what VP emphasizes in his videos about the daily timeframe.
I hope you like this strategy and don't forget to thumb this up!
Also, don't forget to follow me for the update and for my other strategy/indicator/trade ideas!
Thank you for your attention!
Super SSLSuper SSL Indicator.
SSL + SuperTrend signal filtering.
Signals are delivered by SSL, signals are then filtered out by SuperTrend, in the nnfx way of trading (C1 = SSL, C2 = ST).
SSL deliver signals. Supertrend filter them.
Included 1CR rule option : in the nnfx way, we allow C2 to agree 1 candle later.
Some configuration settings of this tool pass the VP's 5 benchmark (can't be used to pass the private group admission though).

Label Display DemoA label function for display an arbitrary value above or below the chart.
There is no convenient way to display the value of a variable in pinescript. This is most convenient way I found.
It will follow the current bar (the position is calculated with highest/lowest and atr value, as such it will never display over the chart)
In this script we display ATR for the example

CCI - SWIFF KNIFECCI indicator swiff knife.
A lot of different usages of CCI ae possible with this script :
- 2 CCI lines crossovers.
- CCI - 0 Line crossovers
- CCI + Moving Average crossovers (many types of MA are available)
Filters can be added.
CCI can be used as a confirmation indicator, a continuation indicator, an exit indicator, a chopiness indicator .... It can even make coffee, who knows.

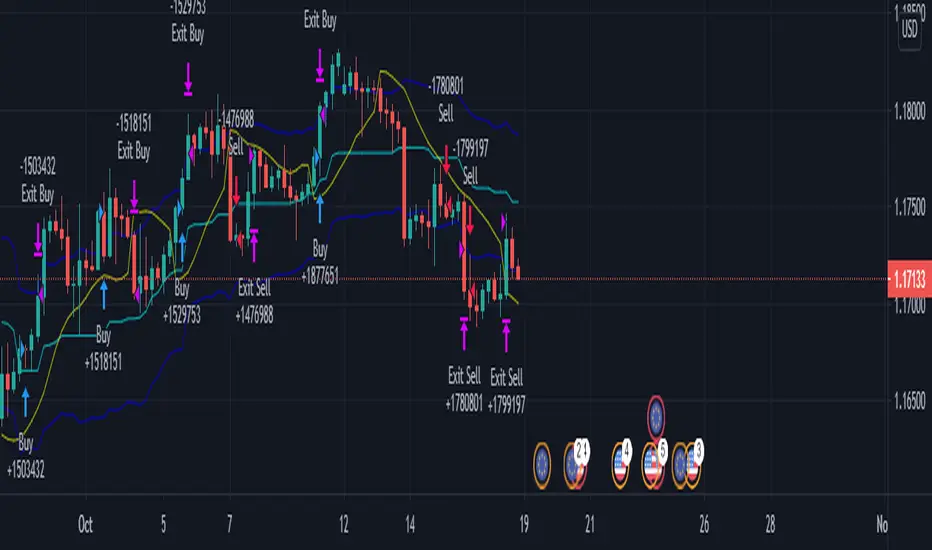
NN Trading SystemThis indicator is an attempt to be all-in-one solution that follows the structure of NNFX Youtube channel. The components may vary from trader to trader. This is my compilation. If you have any ideas to make it better, let me know.
Brief Info about the structure:
The trader chooses best indicators for the positions described below; enters and exits positions strictly based on the consensus of the indicators. Here are components:
1. Baseline (trend line): I usually use "Regression Line" indicator that can be found in the public library. If the price is above the baseline, look for longs; if the price is below the baseline, look for shorts. This part cannot be included in this indicator since it needs the indicator to be an overlay indicator. So choose and couple with your own.
2. Entry Signal: This is the main indicator that signals opening positions. I tested lots of indicators and finally chose LazyBear's MACD Leader Indicator. This is the modified version of it. When the signal line crosses over the zero line, it's a long signal. When the signal line crosses under the zero line, it's a short signal. You may also use the peaks of the hills it creates as a signal if you think it performs better. It's up to you. I have added dots for the possible peaks using "alma" cross algorithm.
3. Confirmation Signal #1: To open a position both the confirmation signals need to give a green signal. otherwise you are not allowed to open the position. Chosen indicator for this job is ATR. Set your minimum ATR value on the settings box and if the current ATR on the current timeframe is below the ATR value, a gray line will be drawn over the entry signal line and you should not take the trade. If you are already have a position, this doesn't mean that you should close the position though. It just informs you that momentum is low. YOU NEED TO ADJUST THIS ATR LIMIT FOR EVERY ASSET AND TIMEFRAME YOU TRADE. For BTC 1min, my example limit value is 8. Find your best value.
4. Confirmation Signal #2: I have chosen Aroon indicator for trend confirmations. If the background of the indicator is green, it's suitable for longs, if it's red, it's suitable for shorts. If the color is brighter, that means the signal is stronger. Aroon is a very powerful indicator but you need to find the best settings for the timeframe you are using.
5. Exit Signal: This one is the hardest role to find an indicator for. The one i ended up choosing is "Relative Vigor Index". It doesn't give good entry signals but with the right settings, it works as an exit signal in my experience. This signal is drawn as a green and red boxes and the top and the bottom of the indicator area. If it changes color while you have a position, it's time to close the position. Find the right settings for it so that every time it signals reversal, you obey the rule and close the position.
To summarise, the components are:
* ATR
* MACDL
* ALMA CROSSOVER
* AROON
* RVGI
plus
* a trend line indicator of your choice added seperately to your chart.
My recommendation is to turn all the indicators off on the settings box and enable on by one finding the best values individually. If you found the best settings for an asset and timeframe, please share in the comments for others.
You may leave a comment for bug reports, feedback and suggestions.
Hope it works for you.
Cheers.

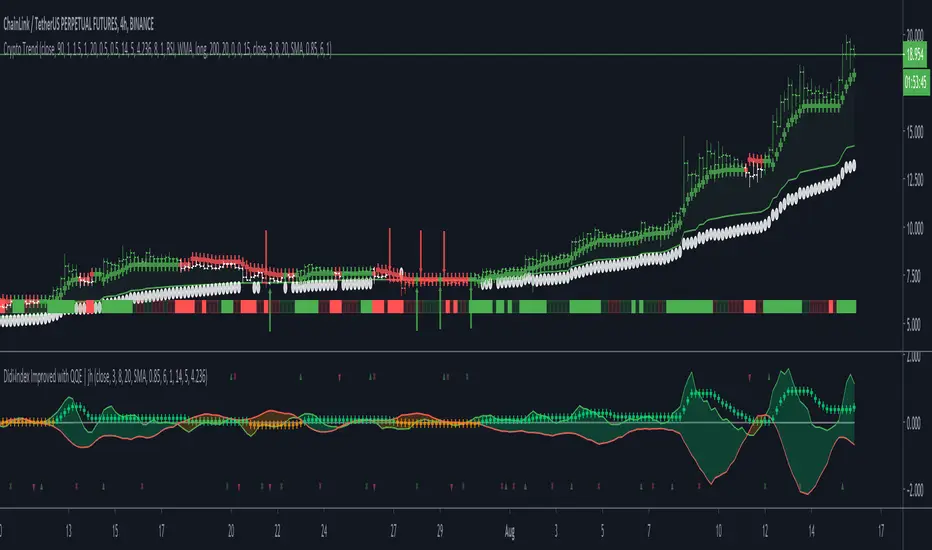
Crypto TrendThis indicator is based off of the Trend Follower system put together by jiehonglim:
This is a trend following system that combines 3 indicators which provide different functionalities, also a concept conceived by VP's No Nonsense FX / NNFX method. I’m primarily modifying this system for Crypto trading (mostly leveraged Crypto Futures). Suggestions/requests welcome.
New Features:
Added position inputs that will generate position labels
For leverage trading, position inputs will calculate your percentage-based stop loss given your entry, leverage and liquidation price
Added optional horizontal line plots for entry, stop loss, 50% take profit and 100% profit levels.
Added non-plotted Didi calculations for alert condition triggers
Added long and short alerts
These alerts will trigger for any of the 3 following conditions:
Baseline cross with volume confirmation
Didi two line cross with volume confirmation
Didi continuation with volume confirmation
1. Baseline
The main baseline filter is an indicator called Modular Filter created by Alex Grover
- www.tradingview.com
- Alex Grover - Modular Filter
-------
That's the moving average like baseline following price, filtering long and short trends and providing entry signals when the price crosses the baseline.
Entry signal indicated with arrows.
2. Volume / Volatility , I will called it Trend Strength
The next indicator is commonly known as ASH, Absolute Strength Histogram.
This indicator was shared by VP as a two line cross trend confirmation indicator, however I discovered an interesting property when I modified the calculation of the histogram.
- Alex Grover Absolute Strength
-------
My modification and other info here
- Absolute Strength Histogram v2
-------
I simplified the display of the trend strength by plotting squares at the bottom of the chart.
- Lighted Squares shows strength
- Dimmed Squares shows weakness
3. Second Confirmation / Exits / Trailing Stop
Finally the last indicator is my usage of QQE (Qualitative Quantitative Estimation), demonstrated in my QQE Trailing Line Indicator
- QQE Trailing Line for Trailing Stop
-------
Three usages of this amazing indicator, serving as :
- Second trend confirmation
- Exit signal when price crosses the trailing line
- Trailing stop when you scaled out the second trade
This indicator is plotted with crosses.
4. Position Calculator
For non-leveraged trades, set leverage to 1 and liquidation to 0
Fill out the rest of the position field to get labels that will tell you:
Your stop loss given your acceptable percentage of loss for your risk. So, for example if your actual investment is $200 and you’re trading on 20X leverage, you’d like to know what price would have to drop to for you to lose 15% of your $200 risk. This is what the position calculator is doing for you.
Your 50% take profit point
Your 100% take profit point
Check the “Show Position Lines” to plot horizontal lines for entry, stop loss, 50% TP and 100%TP
Alerts
You just get a Long Alert or Short Alert option. This was for two reasons, the first and most important was to reduce the number of alerts needed for this system to get maximum coverage. The second was just to keep things simple. Get an alert for your desired direction for any interesting signal and then check the chart manually to determine if a viable entry has presented itself. The three alert conditions are:
Main trend indicator, baseline cross with volume confirmation
Didi two line cross entry with volume confirmation
Didi continuation signal with volume confirmation
Additional plots and information
Bar Color
- Green for longs, Red for shorts, White when the baseline direction conflicts with the QQE trailing line direction
- When it's white, it's usually ranging and not trending, ASH will also keep you off ranging periods.
-------
ATR Filter
- White circles along the baseline, they will show up if the price has moved more than one ATR from the baseline
- The default allowance is 1 ATR.
-------
The previous and current ATR value
- Label on the right side of the chart showing the previous and current value of ATR
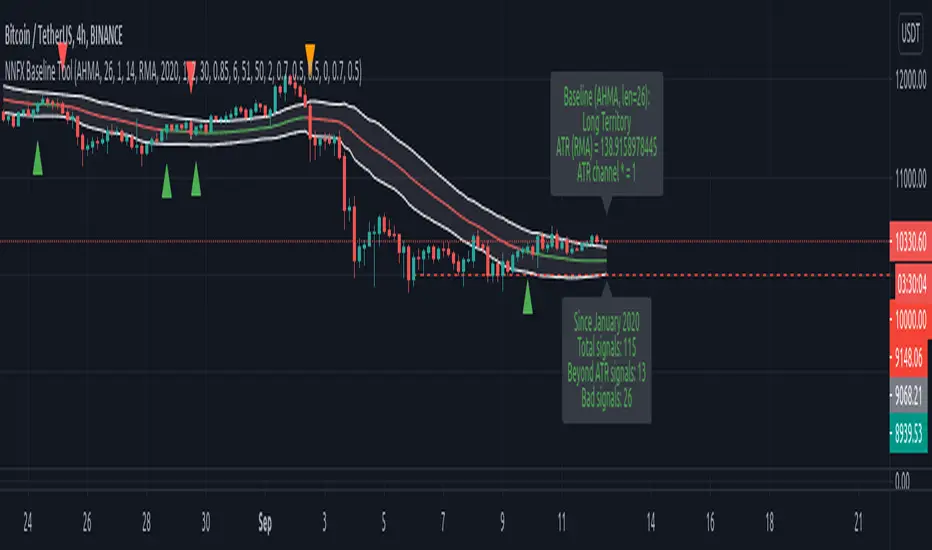
NNFX Baseline ToolNNFX All-in-One Baseline display / test tool.
This is usefull (hopefully) for the NNFX way of trading only. It's not intended to be used as a standalone tool.
Basically, this script displays and tests many types of Moving Averages as baselines.
It displays baseline signals, based on the NNFX ATR-related rule for baseline entries.
It can be used as a backtest tool, or plugged into the whole nnfx algo.
If signal display option is enabled, signals are displayed on chart : green for long, red for short, orange for crossovers beyond the ATR channel :
Many baselines available : SMA , EMA , WMA , VWMA , ALMA , AMA, SMMA , DEMA , FRAMA , HULL, KAMA , KIJUN, JURIK, LAGUERRE, MCGINLEY , TMA1, TMA2, VIDYA , MODULAR FILTER, VAMA , ZLEMA , T3, LSMA, etc.
Additional options :
- multiplying the ATR channel (and subsequent rule) by a factor (default = 1)
- plot the ATR channel (def = yes)
- fill it (def = yes)
- display signals (def = yes)
- option for add color to the baseline, for long/short territory (2 different options : baseline is colored, background is colored)
- darkmode / lightmode color option. (def = dark)
We also display panels, with general information and some test results. Tests are done within the test period.
I tried to test all the different MAs included in the script but some bugs might still be present, so use it at ur own risk.
If you'd like a new MA option added, please let me know in comments.
I included a "bad" signal detection, it can help for tweaking the settings. Signals are defined as "bad" when they are immediately followed by another signal.
When there is 2 or more bad signals next to another, you spotted a chopiness zone (a chopiness zone is defined as a zone where BL get eaten alive).
Example :
to do :
- plug it with the c1/c2 backtest tool (it's the whole point)
- add alerts,
- add more ma types
- stop to use the operator, it's not convenient at all
- add wr% calculation as a standalone feature (with TP / SL)
- add a way to measure chopiness in the test (dont know how yet)
- detect & display chopiness zones
I asked other users when I used their ideas (for some particular types of MAs). They all agreed.
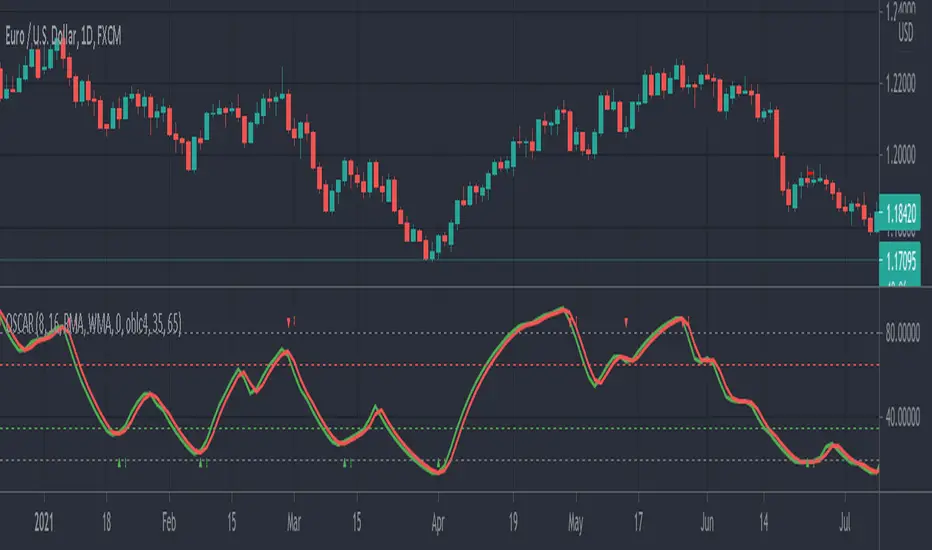
OSCAR Oscillator by GenZai - NNFXOSCAR Oscillator by GenZai
Green line is the Oscar Rough
Red line is the Oscar
By default based on the 8 last candles and smoothed using RMA
Purple line is the Slow Oscar
By default based on the 16 last candles and smoothed using WMA
HOW TO USE
Exit signaling
This indicator can be used as an exit indicator when line cross each other.
Entry signaling
When the green line crosses up, it indicates a long entry
When the red line crosses up, it indicates a short entry
Overbought/Oversold
When the indicator crosses the dashed grey lines it indicates Overbought Oversold
Slow Oscar Add-on
This is an Add-on to the orignal Oscar indicator
Can be hidden if you want the original experience of the Oscar indicator.
Can be used as a confirmation indicator by looking at the direction of the slope to verify is your are trending long or trending short.
Can be used as a baseline to confirm signals given by Oscar
Can be used to tweak your signals and test different settings.
Stock or Forex?
The program was originally written for stocks, but works equally well with the Forex market.
How this indicator is calculated ?
This is the formula we use to calculate the Oscar:
let A = the highest high of the last eight days (including today)
let B = the lowest low of the past eight days (including today)
let C = today's closing price
let X = yesterday's oscillator figure (Oscar)
Today's "rough" oscillator equals (C-B) divided by (A-B) times 100.
Next we "smooth" our rough number (let's call it Y) like this:
Final oscillator number = ((X divided by 3) times 2), plus (Y divided by 3).
SETTINGS:
You can choose between different smoothing options:
RMA: Moving average used in RSI. It is the Adjusted exponential moving averages (also known as Wilder's exponential moving average)
SMA : Simple moving average
EMA : Exponential moving average
WMA : Weighted moving average
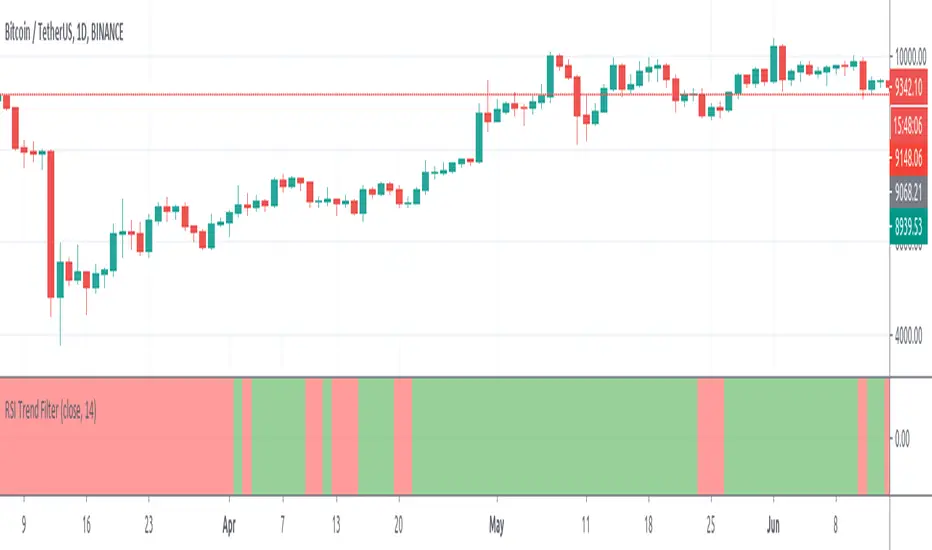
RSI Trend FilterRSI based basic trend filter. I don't used it in the NNFX structure but I wanted to test things.
Here RSI is not used as reversal indicator.
We check if RSI>50 or <50 and we use it as a trend confirmation indicator/filter.
SSL Off ChartThis is SSL channel, but displayed off chart.
I needed this for keep a clean chart during backtesting phases of NNFX algos.
Different display modes.
The "Colors Only" display mode is well adapted for SSL use as an exit indicator or a second confirmation indicator :
Let me know if you want a feature added :p

Z Score Enhanced Time Segmented Volume (Multi MA)**THIS VERSION HAS BEEN STANDARDIZED WITH A Z SCORE CALCULATION AND ALLOWS THE USER TO SELECT WHICH MOVING AVERAGE THEY WOULD LIKE TO UTILIZE FOR THE SIGNAL LINE**
Chart shows the Non-Standardized Enhanced Time Segmented Volume (Multi MA) with default settings on top and the Standardized version with default settings on the bottom.
Time Segmented Volume was developed by Worden Brothers, Inc to be a leading indicator by comparing various time segments of both price and volume . Essentialy it is designed to measure the amount of money flowing in and out of an instrument.
Time Segmented Volume was originally ported to TradingView by user @liw0 and later corrected by user @vitelot. I never quite understood how to read Time Segmented Volume until I ran across a version by user @storma where they indicated when price would be long or short, but that code also utilized the incorrect calculation from user @liw0.
In an effort to make Time Segmented Volume more accessible and easier to read, I have re-coded it here. The calculations are based on the code from @vitelot and I have added direction indicators below the chart.
If the histogram (TSV) is greater than zero and greater than the moving average, price should be moving long and there will be a green box below the chart.
If TSV falls below the moving average while still being greater than zero, the trend may be exhausting and has been coded to read Price Action Long - FAILURE with a black x below the chart.
If the histogram (TSV) is less than zero and less than the moving average, price should be moving short and there will be a red box below the chart.
If TSV rises above the moving average while still being less than zero, the trend may be exhausting and has been coded to read Price Action Short - FAILURE with a black x below the chart.
At times, the moving average may be above zero while TSV is below zero or vice versa. In these situations the chart will indicate long or short based on whether or not TSV is greater or less than zero. It is possible a new trend may be forming as the moving average obviously lags, but also possible price is consolidating with little volume and causing TSV to oscillate close to zero.
**Z Score // Standardized Option **
Thist Standardized code implements all of the above but also allows the user to select a threshold level that should not need to be adjusted for each instrument (since the output is standardized).
If the TSV value meets the long and short signal requirements above and TSV is greater than the threshold values a green or red box will print ABOVE the oscillator. The histogram will also change color based on which threshold TSV has met.
This calculation allows us to compare current volatility to the mean (moving average) of the population (Z-Length). The closer the TSV Z-Score is to the mean, the closer it will be to the Zero Line and therefore price is likely consolidating and choppy. The farther TSV Z-Score is from the mean, the more likely price is trending.
The MA Mode determines the Moving Average used to calculate TSV itself. The Z-Score is ALWAYS calculated with a simple moving average (as that is the standard calculation for Z-Score).
The Threshold Levels are the levels at which TSV Z-Score will change from gray to yellow, orange, green ( bullish ), or red ( bearish ).
Statistically speaking, confidence levels in relation to Z-Score are noted below. The built in Threshold Levels are the positive and negative values for 90%, 95%, and 99%. This would indicate when volatility is greater than these values they are out of the ordinary from the standard range. You may wish to adjust these levels for TSV Z-Score to be more responsive to your trading needs
80% :: 1.28
85% :: 1.44
90% :: 1.64
95% :: 1.96
99% :: 2.58
The Z Length is the period for which the Z Score is calculated
More information regarding Time Segmented Volume can be found here: www.worden.com
Original code ported by @liw0
Corrected by @vitelot
Updated/Enhancements by @eylwithsteph with inspiration from @storma
Multiple MA Options Credits to @Fractured and @lejmer
Bits and Pieces from @AlexGrover, @Montyjus, and @Jiehonglim
As always, trade at your own risk.

Enhanced Time Segmented Volume (Multi MA)**THIS VERSION ALLOWS THE USER TO SELECT WHICH MOVING AVERAGE THEY WOULD LIKE TO UTILIZE FOR THE SIGNAL LINE**
Chart shows two different options of many. Top option is the default settings and bottom option is a different moving average with no other changes.
Time Segmented Volume was developed by Worden Brothers, Inc to be a leading indicator by comparing various time segments of both price and volume. Essentialy it is designed to measure the amount of money flowing in and out of an instrument.
Time Segmented Volume was originally ported to TradingView by user @liw0 and later corrected by user @vitelot. I never quite understood how to read Time Segmented Volume until I ran across a version by user @storma where they indicated when price would be long or short, but that code also utilized the incorrect calculation from user @liw0.
In an effort to make Time Segmented Volume more accessible and easier to read, I have re-coded it here. The calculations are based on the code from @vitelot and I have added direction indicators below the chart.
If the histogram (TSV) is greater than zero and greater than the moving average, price should be moving long and there will be a green box below the chart.
If TSV falls below the moving average while still being greater than zero, the trend may be exhausting and has been coded to read Price Action Long - FAILURE with a black x below the chart.
If the histogram (TSV) is less than zero and less than the moving average, price should be moving short and there will be a red box below the chart.
If TSV rises above the moving average while still being less than zero, the trend may be exhausting and has been coded to read Price Action Short - FAILURE with a black x below the chart.
At times, the moving average may be above zero while TSV is below zero or vice versa. In these situations the chart will indicate long or short based on whether or not TSV is greater or less than zero. It is possible a new trend may be forming as the moving average obviously lags, but also possible price is consolidating with little volume and causing TSV to oscillate close to zero.
More information regarding Time Segmented Volume can be found here: www.worden.com
Original code ported by @liw0
Corrected by @vitelot
Updated/Enhancements by @eylwithsteph with inspiration from @storma
Multiple MA Options Credits to @Fractured and @lejmer
Bits and Pieces from @AlexGrover, @Montyjus, and @Jiehonglim
As always, trade at your own risk.

Enhanced Time Segmented VolumeTime Segmented Volume was developed by Worden Brothers, Inc to be a leading indicator by comparing various time segments of both price and volume. Essentialy it is designed to measure the amount of money flowing in and out of an instrument.
Time Segmented Volume was originally ported to TradingView by user @liw0 and later corrected by user @vitelot. I never quite understood how to read Time Segmented Volume until I ran across a version by user @storma where they indicated when price would be long or short, but that code also utilized the incorrect calculation from user @liw0.
In an effort to make Time Segmented Volume more accessible and easier to read, I have re-coded it here. The calculations are based on the code from @vitelot and I have added direction indicators below the chart.
If the histogram (TSV) is greater than zero and greater than the moving average, price should be moving long and there will be a green box below the chart.
If TSV falls below the moving average while still being greater than zero, the trend may be exhausting and has been coded to read Price Action Long - FAILURE with a black x below the chart.
If the histogram (TSV) is less than zero and less than the moving average, price should be moving short and there will be a red box below the chart.
If TSV rises above the moving average while still being less than zero, the trend may be exhausting and has been coded to read Price Action Short - FAILURE with a black x below the chart.
At times, the moving average may be above zero while TSV is below zero or vice versa. In these situations the chart will indicate long or short based on whether or not TSV is greater or less than zero. It is possible a new trend may be forming as the moving average obviously lags, but also possible price is consolidating with little volume and causing TSV to oscillate close to zero.
More information regarding Time Segmented Volume can be found here: www.worden.com
Original code ported by @liw0
Corrected by @vitelot
Updated/Enhancements by @eylwithsteph with inspiration from @storma
As always, trade at your own risk.

[GM PRO] VolatilityA highly customizable yet simple to use volatility indicator designed for algorithmic traders in mind.
Trend traders seek volume when entering a trade. Price action without volume is like a rocket without fuel -- it won't go very far.
In the Forex world, the actual volume is unknown, however with a good volatility indicator, we can more or less predict high/low volume periods relative to recent price action with a reasonable degree of accuracy.
This indicator uses standard deviations and moving averages to calculate when there is a strong price action, or weak/sideways price action.

[mya] ATR FilteredATR Filtered for NNFX trading.
A classic Average True Range (ATR) indicator with a simple feature to filter out the spikes.
The ATR value is the tool to determine your TP and SL on daily time-frame, specifically in the NNFX way of trading.
VP mentions in his podcast that when the ATR spikes up you have 2 options: 1. wait 14 candles for the ATR to normalize, 2. use the ATR value prior to the spike.
ATR spikes are easy to spot (thus easy to exclude) for an itraday flash crash.
On the other hand when volatility increases over several candles (as in the Covid-19 shock) it can be difficult to determine which ATR value to base your TP/SL on.
In definition of standard deviation, 95.4% of the value will fall within the 2 sigma bands. Therefore the rest 4.6% can be filtered out as an extreme value (a spike).
The ATR in this indicator will plot the standard ATR value in normal condition, then when the ATR spike happens it will stay at the highest value at the point, when the ATR exceeded its 2 sigma band.
The filtering will reset when the ATR comes back down below the extended highest value.
*Disclaimer: Use at your own risk. I am not a programmer, just another guy trying to beat this game. Let's go get it.

Underworld Hunter + Base ZoneUnderworld Hunter + Base Zone is designed to keep traders out of ranging markets by establishing a "dead zone" between the bands where price may be choppy or trends may be short lived. The original Underworld Hunter from @greenmask9 adapted Bollinger Bands by changing the basis from SMA to the EMA of the EMA of the EMA. This version now allows the user to select which moving average they would like to utilize for the calculation.
If price is outside of the upper bands, price may be bullish. If price is outside the lower bands, price may be bearish.
If price is within the green or red areas of the bands, a trend may be forming.
The system also plots when RSI has become over extended above the thresholds selected (70/20 is the default).
MA Period is the length/period the moving average is calculated with
MA Mode is the type of moving average that will be utilized in the basis calculation
The "Standard MA Calculation" Option changes the basis to calculate the moving average selected in MA Mode only once, instead of 3 times
Deviation 1 and Deviation 2 determine how far the dead zone bands will be from the basis
RSI Period is the length/period the RSI function is calculated with
RSI Extended - High Cutoff is the level RSI must reach to be marked as over extended. Most traders refer to this zone as "Overbought"
RSI Extended - Low Cutoff is the level RSI must reach to be marked as over extended. Most traders refer to this zone as "Oversold"
As many NNFx traders know, overbought and oversold essentially do not exist, though the zones can still be utilized
The remaining options are utilized for specific moving average calculations and are set to what is typically considered as "standard" for their values.
There are many options available for this code. The code has not been optimized but merely compiled. Settings should be adjusted for the instrument(s) you are trading.
Adapted from user @greenmask9
Multiple MA Options Credits to @Fractured and @lejmer
Bits and Pieces from @AlexGrover, @Montyjus, and @Jiehonglim
As always, trade at your own risk.
