RSI + EMA+ MTF Stop-LossThis is a simple RSI with multiple MTF (No security) to help with direction short and long-term.
The rsi for the current chart has a noise reduction, while the rest are based on ma's.
I have supplied an extra flexible mtf rsi ma for potential adjustable/long-term stop-loss or direction identification.
Enjoy
Noise

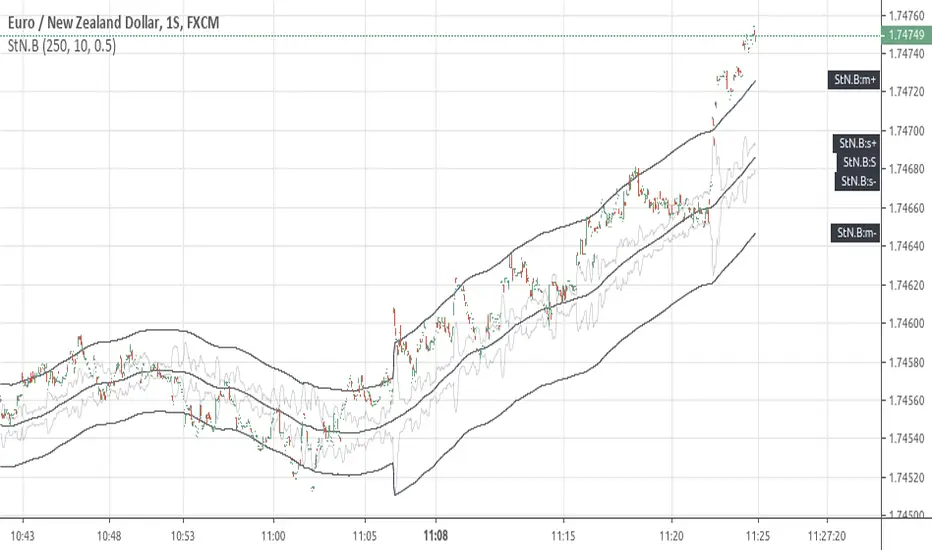
[RS]Signal to Noise BandsEXPERIMENTAL:
Bands using Signal to Noise Calculation.
The bands calculation is similar to bolingers in the aspect that both use standard deviation.
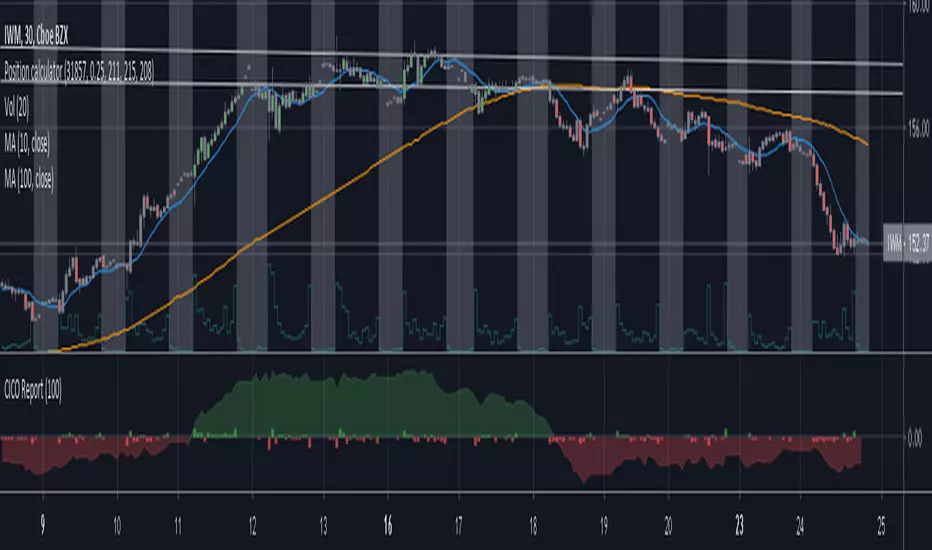
Cash in/Cash out Report (CICO) - Quiets market noiseThe cash in/cash out report (CICO for short) was built with the intent to quiet the market noise. The blunt way to say it, this indicator quiets the market manipulators voice and helps the retail investor make more money. I believe money is better of in the 99% hands versus the greedy hoarding that is currently going on. There are dozens of companies in the SP500 that have the same tax rate as unborn babies, nada. These hoarders also have machine learning high frequency trading bots that purposely create fear and anxiety in the markets. When all of the major markets move at the exact same time of day on frequent occasions, I see red flags. I recommend looking into Authorized participants in the ETF market to understand how the markets can be manipulated, specifically Creation and Redemption.
Enough of my rant. This indicator is open source. Directions on how to use the indicator can be found within the code. The basic summary is, clear your charts to bare minimums. Make the colors gray on all candles. Then apply this indicator. The indicator will color the "buy" and "sell" signals on the chart. Keep in mind, markets are manipulated to create fear in the retail investors little heart and can change drastically at any second. This indicator will show real time changes in running sum into and out of the market, it is estimated by average prices and not exact.
Once the chart is all greyed out and the indicator is applied you will see an area colored red and green. What this indicator does is takes a running sum of the new money into and out of the market. It takes the average of the high and low price times the volume. If the price is going up the value is positive, going down will be negative. Then the running sum is displayed. The area section is the running sum and the column bars are each value. When a market is steadily increasing in value you will see the large green area grow. When markets shift, values and display will change in color and vector. Full descriptions are available within the script in the comment sections.
I hope this help you make more money. If this helps you grow profits, give it a like!
Happy investing 99%er!
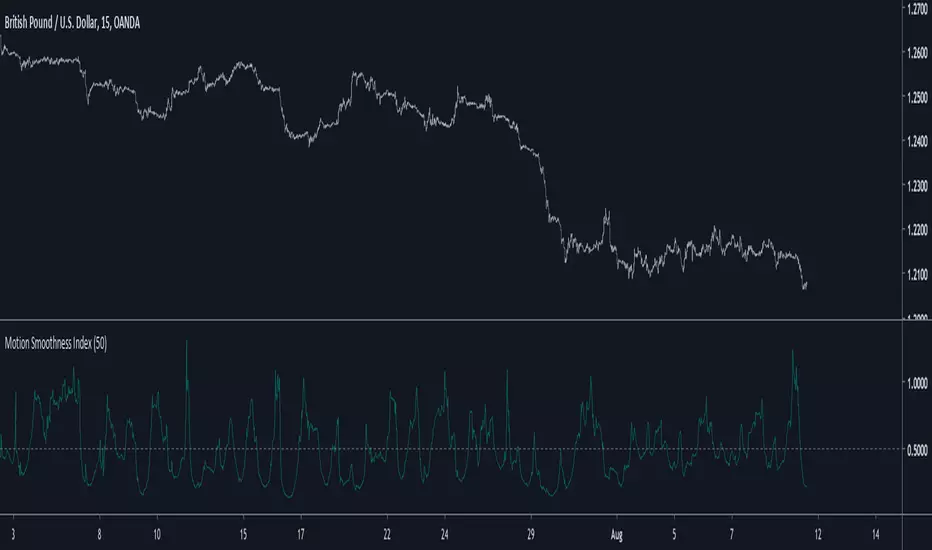
Motion Smoothness Index Introduction
Its holiday time for me, i have been working here a lot. But no leaving before publishing. Telling when market price is smooth or rough is not the easiest task, so today i present a trend metric indicator that allow you to give you this kind of information.
The Indicator
The indicator is in an approximate range of (0,1) with mean x̄ decaying for higher length's, when the indicator is below 0.5 the market is smooth, else rough, this is the simple interpretation. The indicator is simply the ratio of the price residual standard deviation and the price standard deviation.
Higher value of length will make the indicator less accurate when it comes to detect rough market price, you can still use the indicator direction or its running mean to give you insights but 0.5 is still the recommended detection threshold.
In More Depth
Even tho market is random by nature there can still be structures in the price (cycles and trends), the fractional BM model will tell you that market price is sometimes auto-correlated (trending) or non auto-correlated (ranging), knowing what is the current market state is therefore important, when price is rough it can means an excess in noise thus exhibiting an uncorrelated market at the contrary of a smoother price that can allow for auto-correlation.
Now, market is infected by noise, and thats really unfortunate but the noise posses various properties that can allow for all the structures we see in market price. So thinking about the market allowing for possible profits during auto-correlated states is encouraging.
Conclusion
Although the indicator measure smoothness/roughness it can still be interpreted as a trend/range state detector. I hope it provide to be useful.
I wish you all good holidays and see you next time ! Thanks for reading !
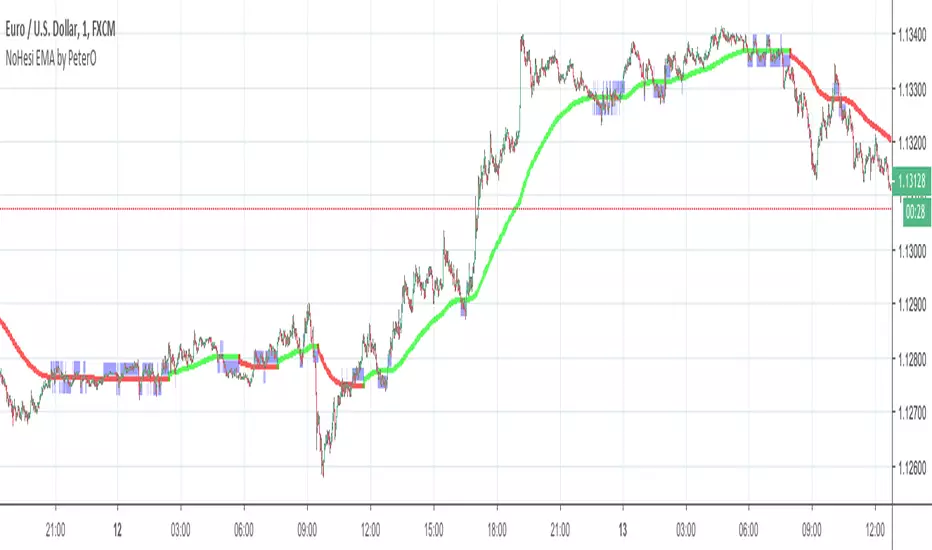
EMA NoHesi - cutting noise in EMA and any other data seriesNoise is common issue in variety of indicators. NoHesi is my take on reducing this noise.
Moving Averages are great indicators to show and maintain the trend. But sometimes - especially in pullback areas, smooth reversal zones or flat markets - MAs suggest trend changes, while it would be best for them to stay quiet :)
NoHesi function smoothens this noise, without adding unnecessary delay. NoHesi will make MA stay in the same direction as long as the move is not significant. If significant - MAs will report trend-change instantly.
Check the chart for illustration - NoHesi EMA keeps showing the same direction, despite its numerous attempts to change it (marked blue).
NoHesi can be applied to any data series: MAs, RSI , ADX , etc. EMA seemed like the most obvious example, so I used it for this presentation.
Hope it helps in your research!
P.S. When applying this to EMAs in other markets/timeframes, you will need to adjust "hesitation" parameter.
Signal to Noise Ratio [SNR]Intro
This script measures the Signal to Noise ratio of a security and plots it in deciBels scale!
Usage
Ideally, you would want the ratio to be above 10 dB, meaning the Signal strength is 10x the noise strength.
As a baseline, you should not rely on indicators that use any kind of moving average if the SNR is below 6 dB - meaning Signal strength is only 4x noise strength.
I've written the SNR as a functional block so you may simply copy and paste, then call getSNR() to get the ratio in dB.
Principle
I consider a bar's High and Low to be the range of that period and (High + Low)/2 to be the "real" value of the signal.
This script compares a bars range (noise) to the perceived signal using a Hilbert Transform.
Cheers,
DasanC

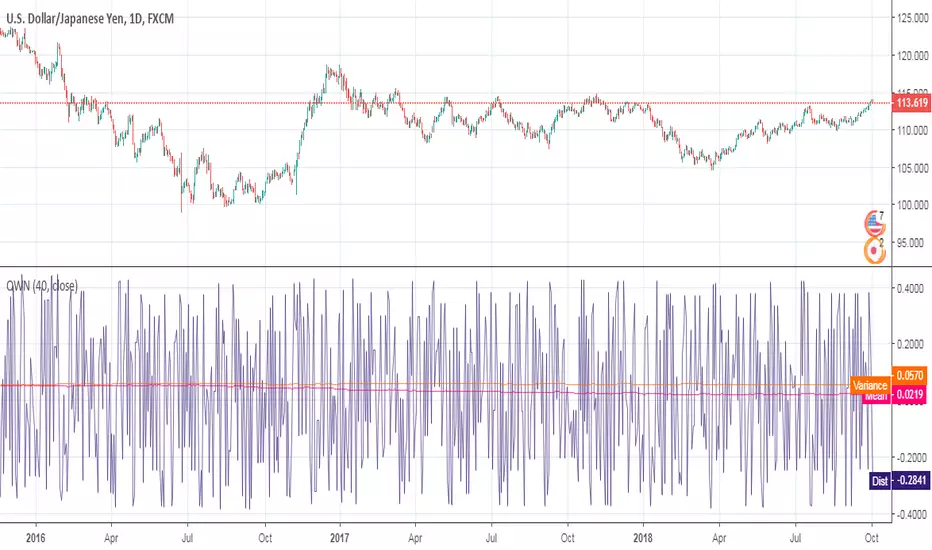
[RESEARCH] Quasi White NoiseQuasi White Noise script.
An experimental approach to implement a white noise using Pine Script. Uses Connors RSI under the hood.
en.wikipedia.org