KF Open InterestDefined by CME as “the total number of futures contracts held by market participants at the end of the trading day. It is used as an indicator to determine market sentiment and the strength behind price trends…it’s calculated by adding all the contracts from opened trades and subtracting the contracts when a trade is closed. Analysts typically use open interest to confirm the strength of a trend. Increasing open interest is typically a confirmation of the trend whereas decreasing open interest can be a signal that the trend is losing strength. The idea is that traders are supporting the trend by entering the market that increases the open interest. As traders lose faith in the trend they exit the market and open interest declines.”
This indicator is an attempt to provide traders with insights as to market participants positioning using the relationship between price and open interest. Data can be displayed in one of three modes
- Cumulative
- Histogram
- Oscillator
Candle selection is between
- Standard
- Hollow
- Trend (Shows positions opening/closing based on candle structure)
Two levels of Open Interest analysis that are represented in this indicator are
Open Interest up – Positions Building
Open Interest down – Positions Closing
Price Up – OI Up = New Longs
Price Down – OI Up = New Shorts
Price Down – OI Down = Longs Closing
Price Up – OI Down = Short Closing
Open interest extension above certain user selected standard deviation values can colour both the candles and background. The bands are able to be displayed on either histogram or oscillator modes.
Period starts lines (D, W, Anchored) can be displayed with an open price level plotted, along with coloured fills.
An additional analytical option of long/short position openings (position state) is able to be displayed as well. This is an experimental attempt to determine which side is positioned relative to price action. The market structure trend of price is compared to a similar trend of OI. An additional sensitivity option allows adjust how quickly a drop in OI shows closing positions relative to opening.
A combination of OI, Volume and Price analysis gives “HV” signals. HV Opens shows a high amount of volume transacted with a large rise in OI. HV Closes are ‘Pseudo liquidations”, showing drops in OI with high transacted volume.
The Position Pivots setting available in the ‘Cumulative’ mode gives traders a view of OI rotations. Once a market structure trend changes the last pivot low of OI is plotted until intersection. Once this level is tapped any positions opened since the pivot are likely closed.
There is also a trade-off between giving too many signals or being too lagging so different instruments may require different settings. Additionally if a symbol does not have any open interest data it will not plot.
Open interest

Open Interest RSIThis indicator started as an experiment.
It is an RSI which is not based on the price but on the open interest.
It captures the momentum of the open interest in the same way as the RSI of the price.
Rules Open Interest (OI):
If the OI rises and the price rises = Bullish trend.
If the OI falls and the price continues to rise = bearish reversal possible
If the OI falls and the price continues to fall = Bullish reversal possible
If the OI rises and the price falls = Bearish trend
Since the OI RSI captures the momentum of the OI, it is recommended to include the price RSI for the analysis.
In the picture are marked different examples which show extreme situations
Example rose lines:
The price RSI and the OI RSI form a bearish divergence to the price and run parallel = strong bearish signal.
Example orange circles:
Price Falling. The price RSI is in the oversold zone and the OI RSI is above 53 or in the best case in the overbought zone. = Strong bullish signal
Example Blue circle:
The price RSI and the OI RSI are running parallel downwards and the price is also falling = bearish momentum.
As mentioned, this is an experiment. The tests were performed in the 4H chart
Have Fun

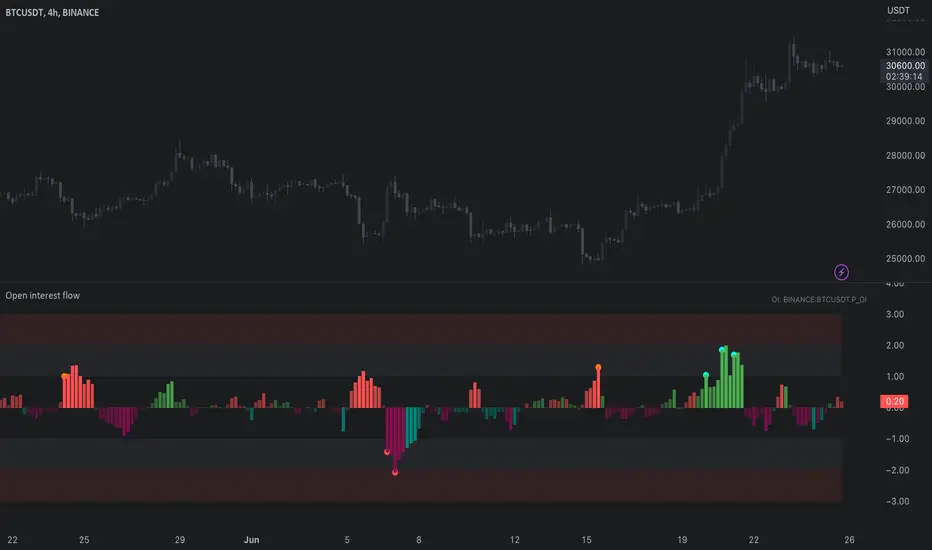
Open interest flow / quantifytools- Overview
Open interest flow detects inflows (positions opening) and outflows (positions closing) using open interest and estimates delta (net buyers/sellers) for the flows. Users are able to choose any open interest source available on Tradingview, by default set to BTCUSDT OI fetched from Binance. Using historical open interest flows, bands depicting typical magnitude of flows are formed for benchmarking intensity of flows. On the inflow side, +1 represents average inflows while +2 represents 2x above average inflows, a level considered an extreme. In a vice versa manner, -1 represents average outflows while -2 represents 2x above average outflows. Extreme inflows indicate aggressive position opening, in other words exuberance. Extreme outflows on the other hand indicate forced exiting of positions, in other words liquidations.
- Concept
Open interest flow is calculated using position of OI source relative to its moving average (by default set to SMA 10), referred to as relative open interest from hereon. When relative OI is positive (open interest is above its moving average), new positions are considered to enter the market. When relative OI is negative (open interest is below its moving average), existing positions are considered to exit the market. Open interest delta (side opening/closing positions, either net buyers/sellers) is calculated using relative price in a similar fashion to relative OI, but using close of viewed symbol as source. Price is considered to be up when relative price is positive, down when relative price is negative. Using relative OI and relative price in tandem, the following assumptions are applied:
Price up, open interest up = longs entering market
Price down, open interest up = shorts entering market
Price down, open interest down = longs exiting market
Price up, open interest down = shorts exiting market
Bands depicting magnitude of open interest flows are calculated using average turning points in relative OI. +1 and -1 represent levels where flows on average turn towards mean rather than continue to increase/decrease. These levels are then multiplied up to +2 and -2, representing two times larger deviations from the normal. When inflows are above 1, positions opening have reached a point where flows historically turn down. Therefore, anything above 1 would be abnormal amount of open interest entering, an extreme stretch being at 2 or above. Same logic applies to outflows, but in a vice versa manner (below -1 abnormal, extreme at -2)
Flow bursts further refine indications of aggressive inflows/outflows by taking into account change in open interest flows. Burst indications are activated when open interest is above its average turning point, coupled with a sufficient increase/decrease in flows simultaneously. Bursts are essentially a filtered version of abnormal flows and therefore a more reliable indication of exuberance/liquidations. Burst sensitivity can be adjusted via input menu, available in 5 settings. 1 sets OI burst requirements to loosest (more signals, more noise) while 5 sets OI burst requirements to strictest (less signals, less noise). Exact criteria applied to bursts can be viewed via input menu tooltip.
- Features
Users can opt for OI source auto-select for CRYPTO/USDT pairs. When auto-select is enabled and another chart is opened, corresponding open interest source is automatically selected as long as requirements mentioned above are met.
Open interest flows can be visualized as chart color, available separately for flow states and flow bursts.
Relative price line and flow guidelines (reminders for flow interpretation) can be enabled via input menu. All colors are customizable.
- Alerts
Available alerts are the following:
- Abnormal long inflows/outflows
- Abnormal short inflows/outflows
- Abnormal inflows/outflows from either side
- Aggressive longs/shorts (flow burst up)
- Liquidated longs/shorts (flow burst down)
- Aggressive or liquidated longs/shorts
- Practical guide
Open interest as a standalone data point does not reveal which side is likely opening/exiting positions and how extreme the participant behavior is. Using the additional data provided by open interest flows, moments of greed and fear can be detected. Smart money does not short into dips and buy into rips. When buyers or sellers have participated in a large move and continue to show interest even when efforts are not rewarded at an already overextended price, participants are asking for trouble.
Similar events can be observed when extreme outflows take place, indicating forced exits such as stop-losses triggering. When enough participants are forced out, price is likely to take the path of least resistance which is to the opposite direction.
Open Interest Chart [LuxAlgo]The Open Interest Chart displays Commitments of Traders %change of futures open interest , with a unique circular plotting technique, inspired from this publication Periodic Ellipses .
🔶 USAGE
Open interest represents the total number of contracts that have been entered by market participants but have not yet been offset or delivered. This can be a direct indicator of market activity/liquidity, with higher open interest indicating a more active market.
Increasing open interest is highlighted in green on the circular plot, indicating money coming into the market, while decreasing open interests highlighted in red indicates money coming out of the market.
You can set up to 6 different Futures Open interest tickers for a quick follow up:
🔶 DETAILS
Circles are drawn, using plot() , with the functions createOuterCircle() (for the largest circle) and createInnerCircle() (for inner circles).
Following snippet will reload the chart, so the circles will remain at the right side of the chart:
if ta.change(chart.left_visible_bar_time ) or
ta.change(chart.right_visible_bar_time)
n := bar_index
Here is a snippet which will draw a 39-bars wide circle that will keep updating its position to the right.
//@version=5
indicator("")
n = bar_index
barsTillEnd = last_bar_index - n
if ta.change(chart.left_visible_bar_time ) or
ta.change(chart.right_visible_bar_time)
n := bar_index
createOuterCircle(radius) =>
var int end = na
var int start = na
var basis = 0.
barsFromNearestEdgeCircle = 0.
barsTillEndFromCircleStart = radius
startCylce = barsTillEnd % barsTillEndFromCircleStart == 0 // start circle
bars = ta.barssince(startCylce)
barsFromNearestEdgeCircle := barsTillEndFromCircleStart -1
basis := math.min(startCylce ? -1 : basis + 1 / barsFromNearestEdgeCircle * 2, 1) // 0 -> 1
shape = math.sqrt(1 - basis * basis)
rad = radius / 2
isOK = barsTillEnd <= barsTillEndFromCircleStart and barsTillEnd > 0
hi = isOK ? (rad + shape * radius) - rad : na
lo = isOK ? (rad - shape * radius) - rad : na
start := barsTillEnd == barsTillEndFromCircleStart ? n -1 : start
end := barsTillEnd == 0 ? start + radius : end
= createOuterCircle(40)
plot(h), plot(l)
🔶 LIMITATIONS
Due to the inability to draw between bars, from time to time, drawings can be slightly off.
Bar-replay can be demanding, since it has to reload on every bar progression. We don't recommend using this script on bar-replay. If you do, please choose the lowest speed and from time to time pause bar-replay for a second. You'll see the script gets reloaded.
🔶 SETTINGS
🔹 TICKERS
Toggle :
• Enabled -> uses the first column with a pre-filled list of Futures Open Interest tickers/symbols
• Disabled -> uses the empty field where you can enter your own ticker/symbol
Pre-filled list : the first column is filled with a list, so you can choose your open interest easily, otherwise you would see COT:088691_F_OI aka Gold Futures Open Interest for example.
If applicable, you will see 3 different COT data:
• COT: Legacy Commitments of Traders report data
• COT2: Disaggregated Commitments of Traders report data
• COT3: Traders in Financial Futures report data
Empty field : When needed, you can pick another ticker/symbol in the empty field at the right and disable the toggle.
Timeframe : Commitments of Traders (COT) data is tallied by the Commodity Futures Trading Commission (CFTC) and is published weekly. Therefore data won't change every day.
Default set TF is Daily
🔹 STYLE
From middle:
• Enabled (default): Drawings start from the middle circle -> towards outer circle is + %change , towards middle of the circle is - %change
• Disabled: Drawings start from the middle POINT of the circle, towards outer circle is + OR -
-> in both options, + %change will be coloured green , - %change will be coloured red .
-> 0 %change will be coloured blue , and when no data is available, this will be coloured gray .
Size circle : options tiny, small, normal, large, huge.
Angle : Only applicable if "From middle" is disabled!
-> sets the angle of the spike:
Show Ticker : Name of ticker, as seen in table, will be added to labels.
Text - fill
• Sets colour for +/- %change
Table
• Sets 2 text colours, size and position
Circles
• Sets the colour of circles, style can be changed in the Style section.
You can make it as crazy as you want:

Biddles OIWAP-Price SpreadThis indicator is the companion to my OIWAP (Open Interested-Weighted Average price) open source indicator.
In observing the OIWAP, what seemed most interesting was the distance between price and OIWAP.
This indicator plots that spread in a histogram.
It seems when price is too high above all OIWAPs, it's locally overbought (sentiment is overly bullish), and vice versa when it's too far below all OIWAPs (sentiment is overly bearish).
But I think there are more unique observations to be made beyond that - I am still in discovery phase myself.
For example: Looking at the SPX while using the ticker override to display BINANCE:BTCUSDT.P OI-Price spread data.
It works on any asset that Tradingview has OI data for. But it's also interesting to view correlated assets by using ticker override in the indicator settings (open the correlated asset w/o OI data in your chart, then set ticker override to a symbol with OI data, like the SPX example above).
>> If you find any interesting observations using it, have suggestions for improving the script, etc., hit me up on Twitter!
>>> @thalamu_

Seasonal Open Interest° by toodegreesDescription:
The Open Interest (OI) is a valuable metric that gets released at the end of each trading day. This metric represents the number of outstanding futures contracts held by market participants for a given commodity or market
The concept of utilizing the OI data as a strategic trading tool was first introduced by Larry Williams :
Rise in Price + Rise in OI: strong trend – new money is coming into the market, showing aggressive buying activity
Rise in Price + Decline in OI: weakening trend – less money coming into the market, suggesting that the move is likely to reverse lower
Decline in Price + Decline in OI: strong trend – new money is coming into the market, showing aggressive selling activity
Decline in Price + Rise in OI: weakening trend – less money coming into the market, suggesting that the move is likely to reverse higher
The Inner Circle Trader (ICT) expanded on these ideas, by exposing Smart Money's behaviour:
Rise in Price + Rise in OI: shorts are being stopped out, and new sellers take their place – gradually, longs get stronger and shorts get weaker
Rise in Price + Decline in OI: Smart Money longs are taking profit and liquidating their positions, and weak shorts are exiting the market
Decline in Price + Decline in OI: longs are being stopped out, and new buyers take their place – gradually, shorts get stronger and longs get weaker
Decline in Price + Rise in OI: Smart Money shorts are taking profit and liquidating their positions, and weak longs are exiting the market
Further, ICT showed the importance of OI in consolidations at Institutional Support or Resistance levels:
Consolidation + Rise in OI: bearish sign due to Smart Money is playing the short side and accumulating positions
Consolidation + Decline in OI: bullish sign due to Smart Money covering their short positions
Last but not least, the Seasonal Open Interest shows us a historical reference point of how OI usually, but not always, develops over the trading year.
Depending on the narrative, a higher/lower OI than its Seasonal Tendency can provide an incredible edge by pointing traders towards what side Smart Money is taking.
The Open Interest Meter shows you a visual representation of how many Standard Deviations the Open Interest is deviating from its Seasonal Tendency.
You can also display this visually as a shaded area between the two metrics:
Features:
Plot Open Interest Data
Plot the Seasonal Open Interest for a specific year
See the OI vs. Seasonal OI in a tailored meter
Shade the area between the OI and the Seasonal OI based on their difference

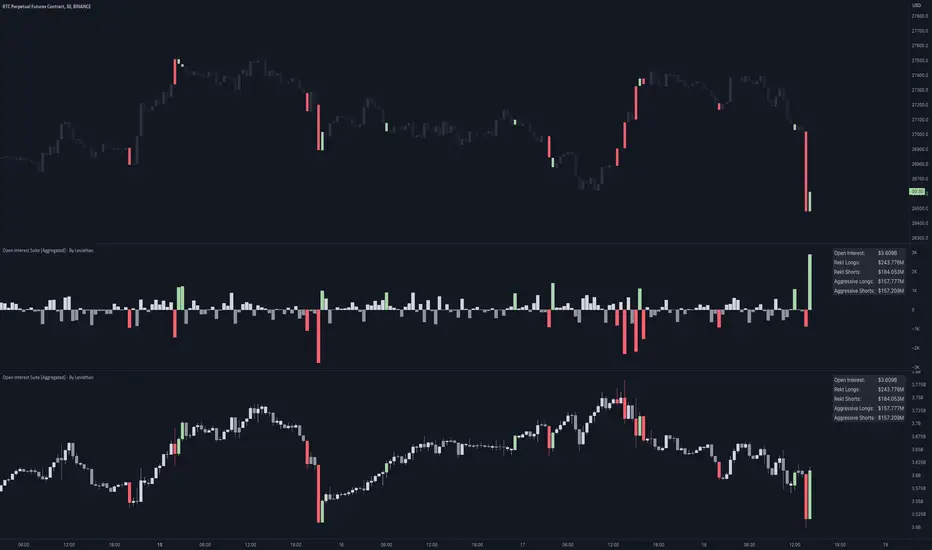
Open Interest Suite [Aggregated] - By LeviathanThis script is an all-in-one indicator that uses aggregated Open Interest data to plot OI candles, Open Interest Delta, OI x rVOL, and OI RSI. It also includes tools such as an OI Distribution profile, large OI increase/decrease coloring, a Stats Screener, and much more.
You can select and have the script plot the following:
- Open Interest in the form of OHLC candles
- Open Interest Delta in the form of a histogram
- Open Interest x Relative Volume in the form of a histogram
- Open Interest RSI in the form of a line
Additional features include:
- OI Distribution Profile (It shows the distribution of open interest in the visible range on y axis. This makes it easier to identify when Open Interest is relatively high or low and at which values most of the action took place)
- Stats screener (The screener includes the real-time net Open Interest value, Rekt Longs/Rekt Shorts based on large OI decreases and Aggressive Longs/Shorts based on large OI increases)
- Coloring (You can color OI Delta nodes, background and chart candles based on large OI increases/decreases)
- more
Instructions for the settings will be provided in the tooltips shortly.
Full credit goes to @KioseffTrading for the profile generation code.
Open Interest Profile [Fixed Range] - By LeviathanThis script generates an aggregated Open Interest profile for any user-selected range and provides several other features and tools, such as OI Delta Profile, Positive Delta Levels, OI Heatmap, Range Levels, OIWAP, POC and much more.
The indicator will help you find levels of interest based on where other market participants are opening and closing their positions. This provides a deeper insight into market activity and serves as a foundation for various different trading strategies (trapped traders, supply and demand, support and resistance, liquidity gaps, imbalances,liquidation levels, etc). Additionally, this indicator can be used in conjunction with other tools such as Volume Profile.
Open Interest (OI) is a key metric in derivatives markets that refers to the total number of unsettled or open contracts. A contract is a mutual agreement between two parties to buy or sell an underlying asset at a predetermined price. Each contract consists of a long side and a short side, with one party consenting to buy (long) and the other agreeing to sell (short). The party holding the long position will profit from an increase in the asset's price, while the one holding the short position will profit from the price decline. Every long position opened requires a corresponding short position by another market participant, and vice versa. Although there might be an imbalance in the number of accounts or traders holding long and short contracts, the net value of positions held on each side remains balanced at a 1:1 ratio. For instance, an Open Interest of 100 BTC implies that there are currently 100 BTC worth of longs and 100 BTC worth of shorts open in the market. There might be more traders on one side holding smaller positions, and fewer on the other side with larger positions, but the net value of positions on both sides is equivalent - 100 BTC in longs and 100 BTC in shorts (1:1). Consider a scenario where a trader decides to open a long position for 1 BTC at a price of $30k. For this long order to be executed, a counterparty must take the opposite side of the contract by placing a short order for 1 BTC at the same price of $30k. When both long and short orders are matched and executed, the Open Interest increases by 1 BTC, indicating the introduction of this new contract to the market.
The meaning of fluctuations in Open Interest:
- OI Increase - signifies new positions entering the market (both longs and shorts).
- OI Decrease - indicates positions exiting the market (both longs and shorts).
- OI Flat - represents no change in open positions due to low activity or a large number of contract transfers (contracts changing hands instead of being closed).
Typically, we monitor Open Interest in the form of its running value, either on a chart or through OI Delta histograms that depict the net change in OI for each price bar. This indicator enhances Open Interest analysis by illustrating the distribution of changes in OI on the price axis rather than the time axis (akin to Volume Profiles). While Volume Profile displays the volume that occurred at a given price level, the Open Interest Profile offers insight into where traders were opening and closing their positions.
How to use the indicator?
1. Add the script to your chart
2. A prompt will appear, asking you to select the “Start Time” (start of the range) and the “End Time” (end of the range) by clicking anywhere on your chart.
3. Within a few seconds, a profile will be generated. If you wish to alter the selected range, you can drag the "Start Time" and "End Time" markers accordingly.
4. Enjoy the script and feel free to explore all the settings.
To learn more about each input in indicator settings, please read the provided tooltips. These can be accessed by hovering over or clicking on the ( i ) symbol next to the input.

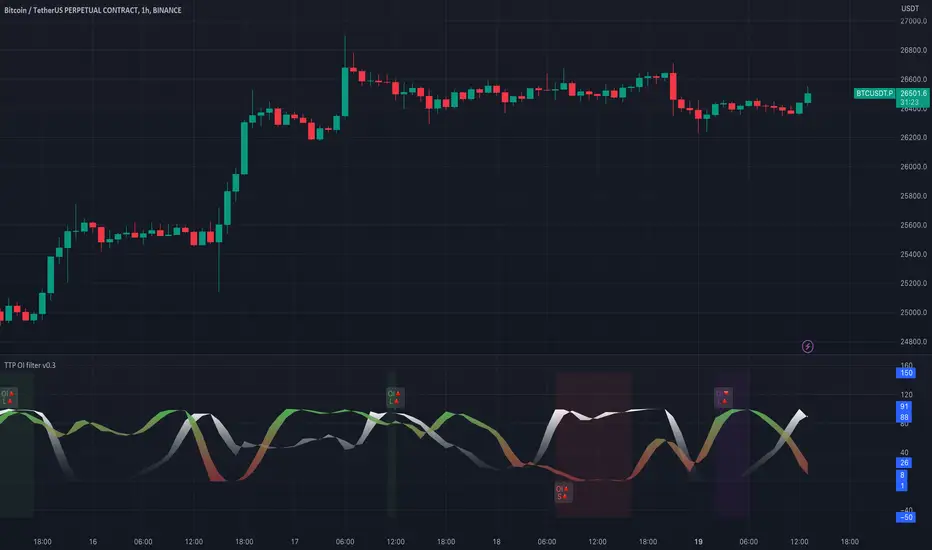
TTP OI + LS signal filterThis oscillator helps filtering specific conditions in the market based on open interest (OI) and the ratio of longs and shorts (LS) for crypto assets.
Currently it works with BINANCE:BTCUSDT.P but soon I'll be adding support for more assets.
It flags areas of interest like:
- Too many longs, too many shorts in the market
- Open interest too high or too low
It accepts an external signal as a source in which case filters can be applied to the original signal. For example the external signal might trigger and plot a 1 when RSI break below 70. By connecting such signal with this oscillator you'll be able to only pass-through the ones that occur when any of the areas of interest mentioned above are also valid.
If both filter are applied it acts as an OR. For example, if too many longs and too many shorts are active, it will pass through the signal in either condition.
The results of the original signal filtered is printed to be able to later use it in any external backtester strategy that accepts external sources too.
If external source signal is disabled it will trigger any time the combined filters are returning true.
Open interest and the ratio of longs/shorts is considered too high whenever the stochastic RSI calculation of the OI or ratio LS reaches a level above 80 and too low when below 20
The ratio of long/shorts is calculated by dividing the ratio of longs vs shorts from BITFINEX:BTCUSDLONGS and BITFINEX:BTCUSDSHORTS
Biddles OI Weighted Average PriceAhoy!
This script calculates Open Interested Weighted Average Price for the following lookback periods:
- 7, 30, 60
e.g. On the 1D chart, you will see OIWAP for the past 7, 30, and 60 days. It works on any timeframe though.
It works with any ticker that TV's OI indicator supports, and has ticker override if you are looking at an exchange that's unsupported, but for an asset that is.
e.g. If you're looking at Bybit's BTCUSDT.P which is unsupported- you can override to get OI data from Binance's BTCUSDT.P which is supported.
=====
Open-Sourced + Crowd Sourcing Goals
=====
I am open sourcing this in hopes we can work together to find interesting signal/observation, and make the script better.
The only way I could think of to calculate the OIWAP for the lookback periods was to manually factor in each period in the formula.
e.g. For the 60-period lookback, it's manually taking price and OI for each individual period.
I am also hoping other folks will make interesting observations.
With the few hours I've spent thus far, they seem to operate much like MA bands, with crossovers having similar implications.
But I feel like there are many other observations left unnoticed!
If you find any, hmu on twitter: @thalamu_
=====
Interesting Calculations in the Script, but not Plotted on the Chart
=====
There are calculations for up to 60 days of OIWAP taking change in OI rather than just OI.
There's one set for absolute value of change in OI, and one set for raw change in OI.
I didn't notice anything spectacularly interesting - but perhaps you will if you tinker with it!
=====
Find something cool? Have an improvement?
=====
Hmu on twitter: @thalamu_

Open Interest OffsetThis indicator is used to display whether there has been an abnormal increase or decrease in recent contract positions. Its usage is similar to the RSI indicator.
Please note that this indicator uses fixed (customizable) thresholds of 0.4 and 0.6 to indicate when abnormal opening and closing occur respectively. For some altcoins, their values may far exceed 0.4 so please adjust accordingly based on your symbol.
(1) When there is an abnormal increase in recent contract positions, the value of the indicator will be above 0.4. This means that there may be a liquidation market situation occurring subsequently. If the market background at this time is rising, it may not be suitable to continue buying because the indicator shows that it is currently overbought. On the contrary, it may be appropriate to sell now.
(2) When there is an abnormal decrease in recent contract positions, the value of the indicator will be below -0.4. This means that a liquidation market situation has occurred recently. If the market background at this time is falling, it may not be suitable to continue shorting because the indicator shows that it is currently oversold. On the contrary, it may be appropriate to buy now.
Special thanks to the following TradingView community members for providing open-source indicators and contributing to the development of this indicator!
Open Interest Delta - By Leviathan - @LeviathanCapital
Regarding the relationship with the above-mentioned open source indicator:
Indicator Open Interest Delta - By Leviathan - @LeviathanCapital obtained OI data for Binance USDT perpetual contracts in the code. We refer to their method of obtaining OI data in our code.
============= 中文版本 =============
该指标用于显示近期合约持仓量是否有异常的增加和减少。它的用法类似于RSI指标
请注意,该指标使用了固定的(可定制的)阈值0.4和0.6来提示异常开仓和平仓的发生。对于某些山寨币而言,指标的数值可能远大于0.4。请根据你所关注的标的自行调整
(1)当近期合约持仓量有异常的增加时,指标的值会在0.4以上。这意味着后续可能有清算行情的发生。若此时市场背景为上涨,此时可能不太适合继续做多,因为指标显示目前处于超买行情。相反,现在可能适合卖出
(2)当近期合约的持仓量有异常的减少时,指标的值会在-0.4以下。这意味着近期已经发生了清算行情。若此时市场背景为下跌,此时可能不太适合继续做空,因为指标显示目前处于超卖行情。相反,现在可能适合买入
特别感谢以下TradingView社区成员提供开源指标并为该指标的开发做出贡献!
Open Interest Delta - By Leviathan - @LeviathanCapital
与上述开源指标的关系:
指标Open Interest Delta - By Leviathan - @LeviathanCapital在代码中获取了Binance USDT永续合约的OI数据。我们在代码中参考他们获取OI数据的方式

Open Interest All ExchangesThe indicator collects data from available exchanges based on open interest. The indicators are calculated in the amount of Bitcoin.
Below are the tickers of the exchanges that provide the data:
- BITFINEX:BTCUSD
- BITFINEX:BTCUST
- KRAKEN:BTCUSDPERP
- BITMEX:XBTUSD
- BITMEX:XBTUSDT
- BINANCE:BTCUSDTPERP
- BINANCE:BTCUSDPERP (due to low volumes and limitations of 40 requests of the request.security function, the code contains data without using the calculation)
For me, Open Interest indicators play an important role in the trading system, for this reason I share with you. I am not a financial advisor.
**Open for cooperation**
Crypto Leverage Ratio [Market Cap / Open Interest in %]This indicator calculates what percentage of market cap data corresponds to open interest data.
Leverage Ratio = 1/(Market Cap / 100 * Open Interest)
Market Cap data comes from TradingView -> CRYPTOCAP:YOURCOINSYMBOL
Open Interest data comes from IntoTheBlock -> INTOTHEBLOCK:YOURCOINSYMBOL_PERPETUALOPENINTEREST
IntoTheBlock refresh perpetual data at the end of the day. It means there is no intraday data.
It can only be used in Daily or higher time intervals.
This indicator and any other indicator can not precisely calculate real leverage ratio except exchanges itself. This calculation is just based on assumption.
You can see the exact same result by just adding:
1/(CRYPTOCAP:BTC/100*INTOTHEBLOCK:BTC_PERPETUALOPENINTEREST)
to your symbol search, if your chart is a BTC chart.
"
The Futures Open Interest Leverage Ratio is calculated by dividing the market open contract value, by the market cap of the asset (presented as %). This returns an estimate of the degree of leverage that exists relative to market size as a gauge for whether derivatives markets are a source of deleveraging risk.
High Values indicate that futures market open interest is large relative to the market size. This increases the risk of a short/long squeeze, deleveraging event, or liquidation cascade.
Low Values indicate that futures market open interest is small relative to the market size. This is generally coincident with a lower risk of derivative led forced buying/selling and volatility.
Deleveraging Events such as short/long squeezes, or liquidation cascades can be identified by rapid declines in OI relative to market cap, and vertical drops in the metric.
-glassnode
"
says glassnode. I think it is more than that. Especially with MAs.

Net Positions (Net Longs & Net Shorts) - By LeviathanThis script is an experimental indicator that visualizes the entering and exiting of long and short positions in the market. It also includes other useful tools, such as NL/NS Profile, NL/NS Delta, NL/NS Ratio, Volume Heatmap, Divergence finder, Relative Strength Index of Net Longs and Net Shorts, EMAs and VWMAs and more.
To avoid misinterpretation, it's important to understand some basics. The “real” ratio between net long and net short positions in a given market is always 1:1. A futures contract is an agreement between two parties to buy or sell an underlying asset at an agreed-upon price. Each contract has a long side and a short side, with one party agreeing to buy (long) and the other party agreeing to sell (short) the asset at the agreed-upon price. The long position holder anticipates that the asset's price will rise, while the short position holder expects it to fall. Because every futures contract involves both a buyer and a seller, it is impossible to have more net longs than net shorts or vice versa (in terms of the net value). For every long position opened, there must be a corresponding short position taken by another market participant (and vice versa), thus maintaining the 1:1 ratio between longs and shorts. While there can be an imbalance in the number of traders/accounts holding long and short contracts, the net value of positions held on each side remains 1 to 1.
Open Interest (OI) is a metric that tracks the number of open (unsettled) contracts in a given market. For example, Open Interest of 100 BTC means that there are currently 100 BTC worth of longs and 100 BTC worth of shorts open in the market. There may be more traders on one side holding smaller positions, and fewer traders on the other side holding larger positions, but the net value of positions on one side is equal to the net value of positions on the other side → 100 BTC in longs and 100 BTC in shorts (1:1). Consider a scenario in which a trader decides to open a long position for 1 BTC at a price of HKEX:30 ,000. For this long order to be executed, a counterparty must take the opposite side of the contract by placing an order to short 1 BTC at the same price of HKEX:30 ,000. When both the long and short orders are matched and executed, the open interest increases by 1 BTC, reflecting the addition of this new contract to the market.
Changes in Open Interest essentially tell us 3 things:
- OI Increase - new positions entered the market (both longs and shorts!)
- OI Decrease - positions exited the market (both longs and shorts!)
- OI Flat - no change in open positions due to low activity or simply lots of transfers of contracts
However, different concepts can be used to analyze sentiment, aggressiveness, and activity in the market by analyzing data such as Open Interest, price, volume, etc. This indicator combines Open Interest data and price action to simplify the visualization of positions entering and exiting the market. It is based on the following concept:
Increase in Open Interest + Increase in price = Longs Opening
Decrease in Open Interest + Decrease in price = Longs Closing
Increase in Open Interest + Decrease in price = Shorts Opening
Decrease in Open Interest + Increase in price = Shorts Closing
When "Longs Opening" occurs, the OI Delta value is added to the running total of Net Longs, and when "Longs Closing" occurs, the OI Delta value is subtracted from the running total of Net Longs.
When "Shorts Opening" occurs, the OI Delta value is added to the running total of Net Shorts, and when "Shorts Closing" occurs, the OI Delta value is subtracted from the running total of Net Shorts.
To summarize:
Net Longs: Cumulative value of Longs Opening and Longs Closing (LO - LC)
Net Shorts: Cumulative value of Shorts Opening and Shorts Closing (SO - SC)
Net Delta: Net Longs - Net Shorts
Net Ratio: Net Longs / Net Shorts
This is the fundamental logic of how this script functions, but it also includes several other tools and options. Here is an overview of the settings:
Type:
- Net Positions (display values of Net Longs, Net Shorts, Net Delta, Net Ratio as described above)
- Relative Strength (display Net Longs, Net Shorts, Net Delta, Net Ratio in the form of a momentum oscillator that measures the speed and change of movements. Same logic as RSI for price)
Display as:
- Candles (display the data in the form of candlesticks)
- Lines (display the data in the form of candlesticks)
- Columns (display the data in the form of columns)
Cumulation:
- Visible Range (data is cumulated from the first visible bar on your chart)
- Full Data (data is cumulated from the beginning)
Quoted in:
- Base Currency (all data is presented in the pair’s base currency eg. BTC)
- Quote Currency (all data is presented in the pair’s quote currency eg USDT)
OI Sources
- Pick the sources from where the data is collected (if available).
Net Positions:
- NET LONGS (show/hide Net Longs plot, choose candle colors, choose line color)
- NET SHORTS (show/hide Net Shorts plot, choose candle colors, choose line color)
- NET DELTA (show/hide Net Delta plot, choose candle colors, choose line color)
- NET RATIO (show/hide Net Ratio plot, choose candle colors, choose line color)
Moving Averages:
- Type (choose between EMA and Volume Weighted Moving Average)
- NET LONGS (show/hide NL moving average plot, choose length, choose color)
- NET SHORTS (show/hide NS moving average plot, choose length, choose color)
- NET DELTA (show/hide ND moving average plot, choose length, choose color)
- NET RATIO (show/hide NR moving average plot, choose length, choose color)
Profile:
- Profile Data (choose the source data of the profile)
- Value Area % (set the percentage width of profile’s value area)
- Positions (set the position of the profile to left or right of the visible range)
- Node Size (set the relative size of nodes to make them appear smaller or larger)
- Rows (select the amount of rows displayed by the profile to control granularity)
- POC (show/hide POC- Point Of Control and select its color)
- VA (show/hide VA- Value Area and select its color)
Divergence finder
- Source (choose the source data used by the script to compare it with price pivot points)
- Maximum distance (the maximum distance between two divergent pivot points)
- Lookback Bars Left (the number of bars to the left of the current bar that the function will consider when looking for a pivot point)
- Lookback Bars Right (the number of bars to the right of the current bar that the function will consider when looking for a pivot point)
Stats:
- Show/Hide the Stats table
- Bars Back (choose the length of data analyzed for stats in number of bars)
- Position (choose the position of the Stats table)
- Select Data you want to display in the Stats table
Additional Settings:
- Volume Heatmap (show/hide volume heatmap and select its color)
- Label Offset (select how much the plot label is shifted to the right
- Position Relative Strength Length (select the length used in the calculation)
- Value Label (show/hide OI Delta values when candles are displayed)
- Plot Labels (show/hide the labels next to the plot)
- Wicks (show/hide wick when candles are displayed)
Code used for generating profiles is taken from @KioseffTrading's "Profile Any Indicator" script (used with author's permission)

Wunder OI botWunder OI bot
1. Wunder OI bot is based on the search for divergences on the Open Interest indicator. The strategy determines the divergence between the price and the Open Interest for a given period.
2. 50 EMA is used as an additional filter. If a divergence is found for a specified number of bars ago and the price is above or below, a trade will be opened.
3. A function for calculating risk on the portfolio (your deposit) has been added to the Wunder OI bot script. When this option is enabled, you get a calculation of the entry amount in dollars relative to your Stop Loss. In the settings, you can select the risk percentage on your portfolio. The loss will be calculated from the amount that will be displayed on the chart.
For example, if your deposit is $1000 and you set the risk to 1%, with a Stop Loss of 5%, the entry volume will be $200. The loss at SL will be $10. 10$, which is your 1% risk or 1% of the deposit.
*Important!** The risk per trade must be less than the Stop Loss value. If the risk is greater than SL, then you should use leverage.
The amount of funds entering the trade is calculated in dollars. This option was created if you want to send the dollar amount from Tradingview to the exchange. However, putting your volume in dollars you get the incorrect net profit and drawdown indication in the backtest results, as TradingView calculates the backtest volume in contracts.
To display the correct net profit and drawdown values in Tradingview Backtest results, use the ”Volume in contract” option.

OI Profile Composite [CE]OI Profile Composite
This indicator is a compliment tool to the OI Profile Remastered, the indicator works by allowing the user to choose:
-Start Time
-End Time
On load so the profile is built as a composite of this data.
the indicator provides the opportunity to show: Delta, Positive and negative OI in separation,
as well as calculate the High Value Nodes ( HVN ) + Liquidations independently of the OI shown.
Users are granted options such as
HVN - Auto detects areas of High Open Interest
Liquidations - Provides points of maximum likely liquidation areas
Extend Liquidations
Liquidation levels can also optionally be chosen to be extended, this may be useful e.g.
if a user wishes to see all positions built during expansion from swing low to swing high, we can gain insight into where participants have taken trades,
this will give us areas of potential liquidations for these traders and then extend these points beyond the swing high. This prevents more data being injested,
aside from the data in this movement, and the levels can be used for future trades accounting for historical liq generated data. Very useful feature of the composite creation.
Users can select their margin manually else the Auto settings for margin will do its job based on the chart selected, perp vs usdt.
All settings are set to defaults that I currently use for BTC trading.
Liquidation points can be useful for Targets when taking a trade.
HVN /OI. Can be used as S/R dynamically as well as the OI develops throughout the session.

OI Profile RemasteredOI Profile Remastered
This indicator is the successor to the very popular first open interest profile,
the indicator provides the opportunity to show: Delta, Positive and negative OI in seperation,
as well as calculate the High Value Nodes (HVN) + Liquidations independently of the OI shown.
Users are granted options such as
HVN - Auto detects areas of High Open Interest
Liquidations - Provides points of maximum likely liquidation areas
Users can select their margin manually else the Auto settings for margin will do its job based on the chart selected, perp vs usdt.
All settings are set to defaults that I currently use for BTC trading.
Liquidation points can be useful for Targets when taking a trade.
HVN /OI. Can be used as S/R dynamically as well as the OI develops throughout the session.
Positive Profile With Positive HVN Calculation
Delta Profile with Positive HVN Calculation (shows indepedence)

Volume / Open Interest "Footprint" - By LeviathanThis script generates a footprint-style bar (profile) based on the aggregated volume or open interest data within your chart's visible range. You can choose from three different heatmap visualizations: Volume Delta/OI Delta, Total Volume/Total OI, and Buy vs. Sell Volume/OI Increase vs. Decrease.
How to use the indicator:
1. Add it to your chart.
2. The script will use your chart's visible range and generate a footprint bar on the right side of the screen. You can move left/right, zoom in/zoom out, and the bar's data will be updated automatically.
Settings:
- Source: This input lets you choose the data that will be displayed in the footprint bar.
- Resolution: Resolution is the number of rows displayed in a bar. Increasing it will provide more granular data, and vice versa. You might need to decrease the resolution when viewing larger ranges.
- Type: Choose between 3 types of visualization: Total (Total Volume or Total Open Interest increase), UP/DOWN (Buy Volume vs Sell Volume or OI Increase vs OI Decrease), and Delta (Buy Volume - Sell Volume or OI Increase - OI Decrease).
- Positive Delta Levels: This function will draw boxes (levels) where Delta is positive. These levels can serve as significant points of interest, S/R, targets, etc., because they mark the zones where there was an increase in buy pressure/position opening.
- Volume Aggregation: You can aggregate volume data from 8 different sources. Make sure to check if volume data is reported in base or quote currency and turn on the RQC (Reported in Quote Currency) function accordingly.
- Other settings mostly include appearance inputs. Read the tooltips for more info.

Cuban's Open Interest Spaghetti [CE]Cuban's Open Interest Spaghetti is an indicator built for traders to track the open interest changes of highly correlated markets, spreads, and ecosystems.
The tool provides three different viewing modes for tracking open interest; a rolling bar lookback, a specific data and time anchor, and a visible range -- similar to the native Tradingview 'Compare' tool.
Included are pre-built lists for tracking the open interest of all 160+ Binance Futures assets, including custom fields for creating new spreads or watchlists. This gives the trader the ability to monitor the entire futures ecosystem within a single charting window.
We have also added an optional table to the right of the screen so that the trader can clearly see outperforming assets. This table is toggleable using radio buttons within the Style menu.
To improve asset visibility, the script also calculates the 'long tail' of the asset distribution and automatically lowers the visibility of clustered assets in the center.
While the Compare tool only allows for % returns and absolute value on the chart asset or separate scale, Cuban's Open Interest Spaghetti allows the trader to use a separate oscillator window with the open interest on a % scale. This gives the trader the ability to watch OI changes in real-time within any Tradingview window.
Within the user inputs, the user gains the ability to customize the following:
Lookback mode
Rolling lookback period
Timezone and time anchor
Percentage of assets highlighted
Dynamic label offset
Asset lists
TO DO:
Add % labels to assets in the tails of the distribution

Open Interest Wiser [WISY]This script calculates the open interest (OI) of a given futures contract and identifies when the OI is increasing or decreasing.
It then plots bubbles on the chart to indicate when the OI is increasing or decreasing, with larger bubbles indicating a larger increase or decrease.
The script also calculates the rate of change (ROC) and the relative strength index (RSI) of the OI and its delta.
The user can adjust the input parameters to change the sensitivity of the indicator to changes in OI.
Dear traders, while we strive to provide you with the best trading tools and resources, we want to remind you to exercise caution and diligence in your investing decisions.
It is important to always do your own research and analysis before making any trades. Remember, the responsibility for your investments ultimately lies with you.
Happy trading!

Range Analysis - By LeviathanThe Interactive Range Analysis script is an essential tool for analyzing price ranges. It automatically draws important range levels, generates a Volume Profile or Open Interest profile and horizontal/vertical heatmaps, plots the anchored VWAP, draws Fibonacci levels, and much more.
How to use the indicator:
1. The script will prompt you to select the "Start Time" and "End Time" using Tradingview's interactive interface. These two points will determine the length of the range.
2. Once you have selected the range, the script will automatically anchor the range highs and lows to the highest and lowest close/wick/hlc3/ohlc4 (whichever you prefer).
3. You can then begin exploring different tools and options such as Quarters, Eighths, Fibonacci, Outer Levels, VWAP, Horizontal Volume/OI Heatmap, Vertical Volume/OI Heatmap, Fixed Range Volume Profile, Open Interest Profile, Value Area, VAH, VAL, and POC.
4. You can adjust the range by dragging the Start Time and End Time anchors or by removing/reapplying the script.
Tool overview
Range Levels
After selecting your preferred time range, the script will identify and draw a range high level and a range low level, which serve as a base for other important levels. “Half” is the level halfway between the range high and range low. “Quarters” will, as the name suggests, split the range into four equal zones (quarters) and “Eighths” will split the range into eight equal zones (eighths).
”Fibonacci” option allows you to display Fibonacci retracement levels (0.786, 0.618, 0.382, 0.236). “VWAP” will plot a Volume Weighted Average Price, anchored to the start of the range. “Direction” input lets you choose whether your range is UP or DOWN trending in order to make sure that the Fibonacci levels and labels are generated and assigned correctly. With “Outer” turned ON, the script will also generate active levels (quarters/eighths/Fibonacci) above and below the selected price range. “Extend Right” will extend all levels to the right indefinitely, while “Extend (+Bars)” lets you choose how far right the levels get extended. “Diagonal Line” is drawn from the bottom left of the range to the top right of the range or from the top left of the range to the bottom right of the range, depending on the “Direction” input.
Volume Profile / Open Interest Profile
After selecting the “Data Type”, Volume Profile or OI Profile can be generated by turning ON the “Volume/OI Profile” option.
“Resolution” input defines the amount of nodes/rows in the range that are used in profile/heatmap generation for distributing the data. While you can increase the “Resolution” to get better, more granular profiles, you should keep in mind that you might need to lower the resolution when generating profiles for larger ranges.
”Node Type” offers you two options when it comes to the representation of data: Up/Down - divides a node in two sections for up volume/OI and down volume/OI, Total - one node for total volume/OI and Delta - net difference in up volume/OI and down volume/OI.
”Profile Position” lets you choose whether the profile is positioned on the left side of the range or on the right side of the range.
“Profile Direction” determines whether the profile nodes are facing right or left.
“Profile Type” enables you to visualize the nodes in a classic way (Type 1) or in a way where down volume/negative OI are positioned on the left side of the y axis and up volume/positive OI on the right side of the y axis.
“Node Size (%)” defines how much space in the range can be taken by the profile’s nodes. Eg. 50% will allow the largest node to extend to the middle of the range (and others scaled accordingly), 100% will allow the largest node to extend the max right point of the range (and others scaled accordingly).
”Value Area (%)” defines the VA zone, which represents the area where the most volume occured (usually 70% or 68%).
”Horizontal Heatmap” will display a heatmap-like overlay, that will help you identify the price levels where most volume/open interest action occurred.
”Vertical Heatmap” will display a heatmap-like overlay, that will help you identify the points in time where most volume/open interest action occurred.
A more detailed description of this indicator is coming in the next few days.
Important:
* If volume or OI profile does not get generated, try lowering the resolution.
* Once in a while, the script will disappear from your chart. Just remove and reapply.
* Open Interest data is only avaiable on Binance Perpetual Futures pairs
To learn more, read the tooltips in the indicator’s settings and stay tuned for upcoming additions (Range Market Structure, Liquidation Levels, Range Statistics,…)

Open Interest with Heikin Ashi candlesA simple modification of the Tradingview free script of futures Open Interest to Heikin Ashi candles. It displays the volume of the Open Interest futures contracts by applying the HA formula.
I use it to clear out the "noise" of up's and down's especially in intraday small time frames when I am scalping in crypto.
Background color can be turned on/off.
Just to give back a little something to a community that gave me A LOT!
Let me know what you think and if you need anything to add.
Have fun :)
P.S. The way I use it is to try to find traps in the market and take (fast) advantage of them. When the OI are going up really fast in small time frames (which means either longs or shorts are going up) this creates a good opportunity for a squeeze (the trap).
Of course I use other indicators/oscillators to determine that but it gets me on my toes to look for... something ;)

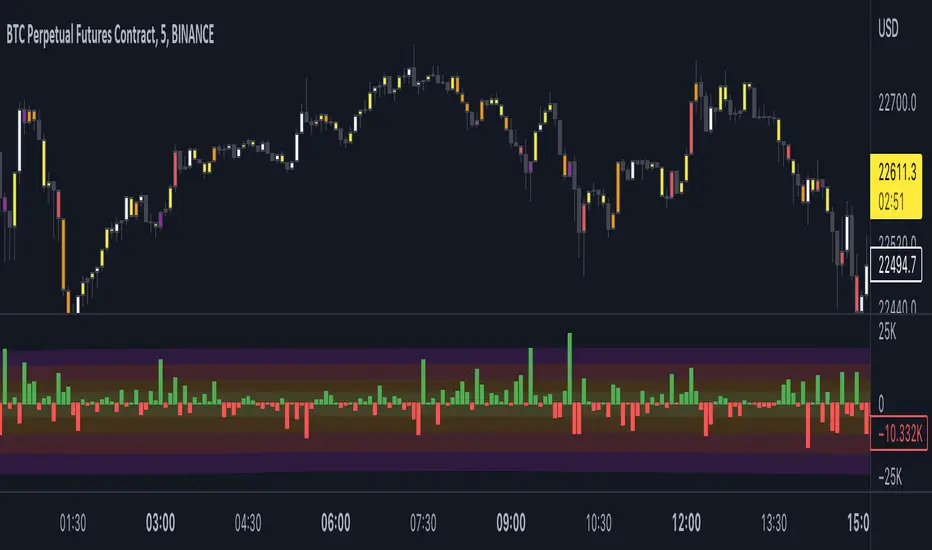
Open Interest Delta - By LeviathanThis script plots Open Interest Delta (change in OI). It also draws a heatmap and colors chart's candles to help you identify bars with large OI increase or decrease and apply Open Interest analysis concepts to your trading.
Positive OI Delta = net increase in open/unsettled positions
Negative OI Delta = net decrease in open/unsettled positions