OptiPine: High-Performance Caching and Data PipelinesOptiPine is a high performance architecture library for Pine Script™, built for algorithms that push beyond ordinary indicator workloads. It turns caching, sparse updates, reusable storage and workload-aware data structures into practical APIs that stay small at the call site.
In a small indicator, optimization is often optional. In a rendering engine, machine learning library, simulation, dashboard or object system, it can determine whether a feature runs at all. The problem is rarely one slo
Optimization
RSI Divergence: Out-of-Sample Optimizer [LuxAlgo]The RSI Divergence: Out-of-Sample Optimizer indicator is a comprehensive backtesting and optimization tool designed to identify the most effective RSI period for trading price-RSI divergences within a specified historical window and validate those results through out-of-sample and forward testing.
🔶 USAGE
The script is divided into three distinct chronological phases to simulate a professional quantitative workflow:
🔹 In-Sample (IS) Optimization
During this period (highlighted by the firs
Indicatore
Supertrend Parameter Sensitivity 3D [LuxAlgo]The Supertrend Parameter Sensitivity 3D indicator is a powerful optimization tool that executes 100 simultaneous Supertrend backtests bar-by-bar to visualize how different ATR Lengths and Multipliers impact performance across various metrics.
By projecting this data onto a 3D surface and a heatmap dashboard, it allows traders to identify "stable" parameter zones and avoid over-optimized "peaks" that may lead to curve-fitting.
🔶 USAGE
This tool is designed to help traders find the most ro
Strategy Sensitivity MatrixThe Strategy Sensitivity Matrix is an institutional-grade backtesting tool designed to evaluate the robustness and parameter sensitivity of trend-following strategies. It enables users to compare the historical performance of a broad range of parameter combinations across multiple metrics to assess the overall stability of the selected strategy. The model displays the complete backtest landscape in a structured, color-coded matrix that allows investors to quickly identify robust parameter region
Indicatore
Volatility Stop SelectorThe Volatility Stop Selector is a comprehensive trend-following tool designed to automatically identify the optimal volatility stop strategy. It features adjustable parameters and an integrated backtester that delivers institutional-grade insights into the recommended strategy. The model continuously adapts to new data in real time by evaluating multiple volatility length and factor combinations, determining the best-performing configuration, and presenting the backtest results in a clear, color
Indicatore
Adaptive Trend SelectorThe Adaptive Trend Selector is a comprehensive trend-following tool designed to automatically identify the optimal moving average crossover strategy. It features adjustable parameters and an integrated backtester that delivers institutional-grade insights into the recommended strategy. The model continuously adapts to new data in real time by evaluating multiple moving average combinations, determining the best performing lengths, and presenting the backtest results in a clear, color-coded table
Indicatore
PnL Bubble [%] | Fractalyst1. What's the indicator purpose?
The PnL Bubble indicator transforms your strategy's trade PnL percentages into an interactive bubble chart with professional-grade statistics and performance analytics. It helps traders quickly assess system profitability, understand win/loss distribution patterns, identify outliers, and make data-driven strategy improvements.
How does it work?
Think of this indicator as a visual report card for your trading performance. Here's what it does:
What You Se
Indicatore
*Auto Backtest & Optimize EngineFull-featured Engine for Automatic Backtesting and parameter optimization. Allows you to test millions of different combinations of stop-loss and take profit parameters, including on any connected indicators.
⭕️ Key Futures
Quickly identify the optimal parameters for your strategy.
Automatically generate and test thousands of parameter combinations.
A simple Genetic Algorithm for result selection.
Saves time on manual testing of multiple parameters.
Detailed analysis, sorting, filterin
Walk Forward PatternsINTRO
In Euclidean geometry, every mathematical output has a planar projection. 'Walk Forward Patterns' can be considered a practical example of this concept. On the other hand, this indicator might also be viewed as an experiment in 'how playing with Lego as a child contributes to time series analysis' :)
OVERVIEW
This script dynamically generates the necessary optimization and testing ranges for Walk Forward Analysis based on user-defined bar count and length inputs. It performs automati
Indicatore
Moving Average PropertiesThis indicator calculates and visualizes the Relative Smoothness (RS) and Relative Lag (RL) or call it accuracy of a selected moving average (MA) in comparison to the SMA of length 2 (the lowest possible length for a moving average and also the one closest to the price).
Median RS (Relative Smoothness):
Interpretation: The median RS represents the median value of the Relative Smoothness calculated for the selected moving average across a specified look-back period (max bar lookback is set at 3
Indicatore
Backtest any Indicator v5Happy Trade,
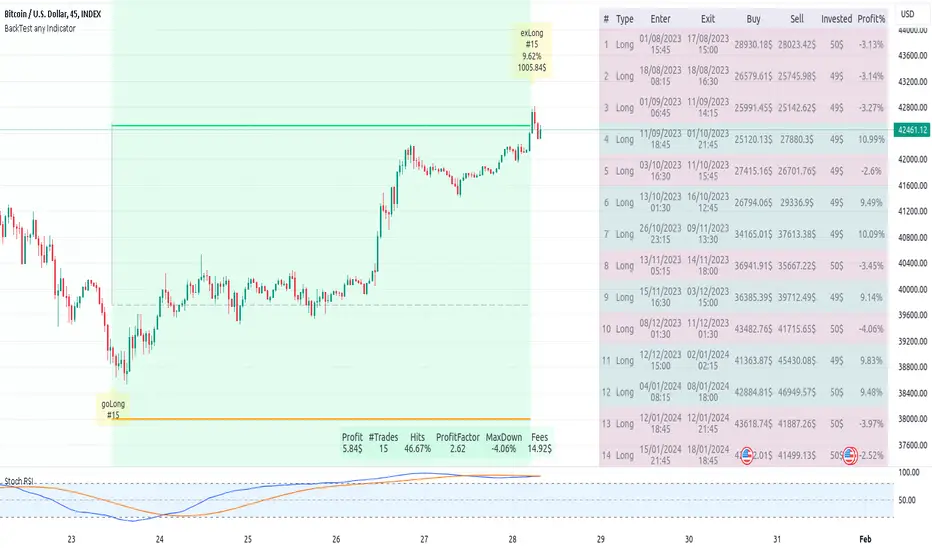
here you get the opportunity to backtest any of your indicators like a strategy without converting them into a strategy. You can choose to go long or go short and detailed time filters. Further more you can set the take profit and stop loss, initial capital, quantity per trade and set the exchange fees. You get an overall result table and even a detailed, scroll-able table with all trades. In the Image 1 you see the provided info tables about all Trades and the Result Summary. Fur
Indicatore
Supertrend - Optimised Exit We created a small script that will allow you to have a quick look into static SL/PT to choose from. This might save you time, replacing the manual search for optimal SL/PT.
We're checking signals of the strategy and computing its performance with a grid of SL/PT selected.
We used SuperTrend signals in this example, but it will be straightforward to integrate your signals.
In addition to total Return, we compute MAX Dd and Profit Factor. Other metrics can be implemented as well.
Thanks to
Indicatore
Reinforced RSI - The Quant Science This strategy was designed and written with the goal of showing and motivating the community how to integrate our 'Probabilities' module with their own script.
We have recreated one of the simplest strategies used by many traders. The strategy only trades long and uses the overbought and oversold levels on the RSI indicator.
We added stop losses and take profits to offer more dynamism to the strategy. Then the 'Probabilities' module was integrated to create a probabilistic reinforcement on
Strategia
Logistic RSI, STOCH, ROC, AO, ... by DGTExperimental attemt of applying Logistic Map Equation for some of widly used indicators.
With this study "Awesome Oscillator (AO)", "Rate of Change (ROC)", "Relative Strength Index (RSI)", "Stochastic (STOCH)" and a custom interpretation of Logistic Map Equation is presented
Calculations with Logistic Map Equation makes sense when the calculated results are iterated many times within the same equation.
Here is the Logistic Map Equation : Xn+1 = r * Xn * (1 - Xn)
Where, the value of
How to avoid trading on certain dates Time Breaks for optimizingThis Snippet is useful to avoid trading in certain times.
I use to optimize when I want to avoid certain times where market behave irrationally bull or bulltard :). That way the optimization can be improved because by optimizing more for the other 99% of the time where market beahve more rational
Indicatore
Optimized Linear Regression ChannelReturn a linear regression channel with a window size within the range (min, max) such that the R-squared is maximized, this allows a better estimate of an underlying linear trend, a better detection of significant historical supports and resistance points, and avoid finding a good window size manually.
Settings
Min : Minimum window size value
Max : Maximum window size value
Mult : Multiplicative factor for the rmse, control the channel width.
Src : Source input of the indicator
Indicatore
Momentum adjusted Moving Average by DGTA brand new Moving Average , calculated using Momentum, Acceleration and Probability (Psychological Effect).
Momentum adjusted Moving Average(MaMA) is an indicator that measures Price Action by taking into consideration not only Price movements but also its Momentum, Acceleration and Probability. MaMA, provides faster responses comparing to the regular Moving Average
Here is the math of the MaMA idea
Momentum measures change in price over a specified time period
momentum = sourc
Indicatore
Momentum Acceleration by DGTItalian physicist Galileo Galilei is usually credited with being the first to measure speed by considering the distance covered and the time it takes. Galileo defined speed as the distance covered during a period of time. In equation form, that is v = Δd / Δt where v is speed, Δd is change in distance, and Δt is change in time. The Greek symbol for delta, a triangle (Δ), means change.
Is the speed getting faster or slower?
Acceleration will be the answer, acceleration is defined as the rate o
Elliott Wave Oscillator Signals by DGTElliott Wave Principle , developed by Ralph Nelson Elliott, proposes that the seemingly chaotic behaviour of the different financial markets isn’t actually chaotic. In fact the markets moves in predictable, repetitive cycles or waves and can be measured and forecast using Fibonacci numbers. These waves are a result of influence on investors from outside sources primarily the current psychology of the masses at that given time. Elliott wave predicts that the prices of the a traded currency pair
Indicatore
Script Stopwatch - PineCoders FAQ█ WARNING
The publication of our LibraryStopwatch has deprecated this publication.
█ ORIGINAL DESCRIPTION
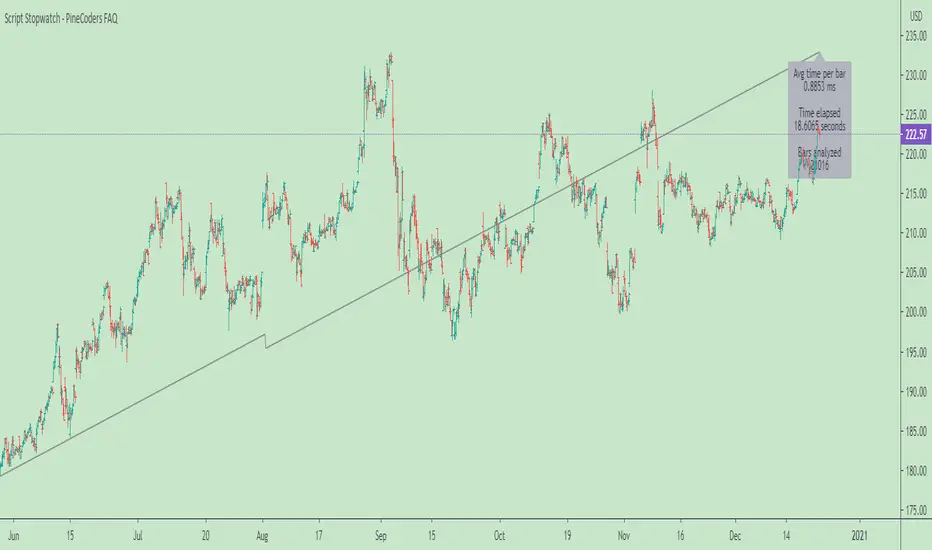
This script calculates the run time of a Pine script. While its numbers are not very precise and it doesn’t work on all scripts, it will help developers calculate run times more precisely than by hand, and so provides Pine coders with an additional profiling tool to help them optimize their code.
How to use the code
• Place the code included between the up/down arrows after your
Indicatore